Amazon CloudWatch Alarm Design and Alert Fatigue - Composite Alarms, Anomaly Detection, Metric Math, and Metric Cardinality
First Published:
Last Updated:
That is not a monitoring problem. The monitoring worked. It is a notification design problem, and it is the one part of observability that is usually left to accrete rather than be designed. Every alarm in the account was added by somebody who had a good reason at the time. No one owns the sum.
This guide is about the sum. It treats the question "what deserves to interrupt a human?" as a design problem with concrete levers on AWS, and it goes down to the level where the levers actually behave differently from how people assume: how an alarm decides its state, what the evaluation range is and why an alarm can stay
OK while the most recent data point is breaching, what the default for missing data really is, what a composite alarm's suppressor does during the window where both alarms are moving, how a mute rule interacts with that suppressor, and why the shape of your metric dimensions determines how many alarms you will eventually have to manage.Scope and honesty notes. Every factual claim below was verified against AWS's official documentation as of 2026-08-04; quotas, defaults, and feature availability change, so confirm current values for your account and Region before you rely on them. No AWS API calls were executed to produce this article and no measurements were taken — nothing here is presented as a benchmark, and there are no numbers in this article that came from an environment of mine. This article does not discuss pricing. Alarm count, metric count, and cardinality are discussed purely in terms of quotas, searchability, alarm manageability, and dashboard legibility, because those are the properties that determine whether the design still works at the size you grow to. I also do not propose a numeric target for how many pages per week is "healthy" — that number is a property of your system and your rotation, not of CloudWatch, and inventing one would be exactly the kind of unfalsifiable advice this article is trying to replace. Operations that stop notifications from being delivered — deleting an alarm, disabling its actions, applying a mute rule, wiring a permanent suppressor — are how monitoring gets silently lost, and they are flagged with warnings wherever they appear.
Several adjacent topics are deliberately delegated to existing articles rather than repeated here:
- Instrumentation — what to collect and with what, across serverless and containers, and how traces, metrics, and logs get correlated — belongs to the AWS Observability Architecture Guide. That article ends where this one begins: it produces the signals, this one decides which of them are allowed to wake someone.
- SLOs, error budgets, burn-rate alarming, and CloudWatch Application Signals also belong to that guide. Where this article says "the SLO layer," that is what it means.
- Log query authoring — the actual CloudWatch Logs Insights syntax and a library of working queries — belongs to the CloudWatch Logs Insights Query Collection and the CloudWatch Logs Insights Query Builder.
- Vocabulary — what a span, an SLI, a golden signal, or cardinality means in general — belongs to the AWS Observability Glossary.
- What to do once you are paged — triage order, decision trees, and the postmortem itself — belongs to Incident Triage Flowcharts and AWS Postmortem Case Studies and Design Lessons.
Table of Contents
- Introduction
- What Deserves to Wake Someone Up
- How an Alarm Actually Evaluates
- Static Thresholds Done Right
- Metric Math and Composed Symptom Signals
- Anomaly Detection
- Fleet-Wide and Query-Based Alarms
- Composite Alarms, Suppression, and Mute Rules
- Metric Cardinality
- Routing and Escalation
- Reviewing Alarms as a Product
- Failure Modes and Anti-Patterns
- Frequently Asked Questions
- Summary
- References
1. Introduction
The audience for this guide is the engineer carrying a pager and the lead who has been told to fix the pager. Concretely: SRE and operations engineers running an on-call rotation on AWS, and platform leads redoing an alerting scheme that has stopped being trusted.The organizing idea is that an alarm is a claim that a human should do something now, and that most alarm sprawl comes from never having made that claim explicitly. Sections 2 and 3 are the foundation: Section 2 forces the classification decision before any threshold is chosen, and Section 3 explains the evaluation machinery, because more false pages come from misunderstanding evaluation than from picking the wrong number. Sections 4 through 7 are the four ways to state a condition — static thresholds, metric math, anomaly detection, and query-based alarms — with the trade-offs of each. Section 8 is the noise-collapsing layer: composite alarms, action suppression, and mute rules, including how the two suppression mechanisms interact. Section 9 is metric cardinality, which is the part of alert fatigue that nobody frames as alert fatigue, and Sections 10 and 11 cover routing and the ongoing review that keeps the set honest. Section 12 collects the failure modes.
Three ideas run through all of it:
- Suppression is a loan against attention, not a payment. Every mechanism in Section 8 stops a notification from arriving. None of them stop the underlying condition. The good ones — a suppressor tied to a real upstream alarm, a mute rule with an expiry — are loans with a repayment date attached by the service itself. The bad ones are a
DisableAlarmActionscall somebody made during an incident and nobody re-enabled. - The evaluation configuration is part of the claim. "CPU above 80%" is not an alarm. "CPU above 80% as a 5-minute average, in 2 of the last 3 periods, treating missing data as not breaching" is an alarm, and those three extra clauses decide whether it fires when nothing is wrong.
- Cardinality is an alerting decision made months earlier. The moment somebody promotes a per-customer identifier to a metric dimension, the number of time series — and therefore the number of things somebody might put an alarm on, and the number of alarms somebody eventually will — stops being bounded by your architecture and starts being bounded by your traffic.
2. What Deserves to Wake Someone Up
The first decision is not a threshold. It is a taxonomy, and it has to exist before any alarm is created, because otherwise the taxonomy gets decided implicitly by whoever wired the first SNS topic.AWS states the goal in the Well-Architected Framework's Operational Excellence pillar, under OPS08-BP04 Create actionable alerts, and it is unusually blunt about the failure mode. The named anti-patterns are "setting up too many non-critical alerts, leading to alert fatigue," "not prioritizing alerts based on KPIs, making it hard to understand the business impact of issues," and "neglecting to address root causes, leading to repetitive alerts for the same issue." The level of risk when this practice is not established is rated High — the same band AWS uses for missing backups and absent access controls, which is a useful thing to be able to cite when alerting hygiene is treated as a nice-to-have.
2.1 Three destinations, decided first
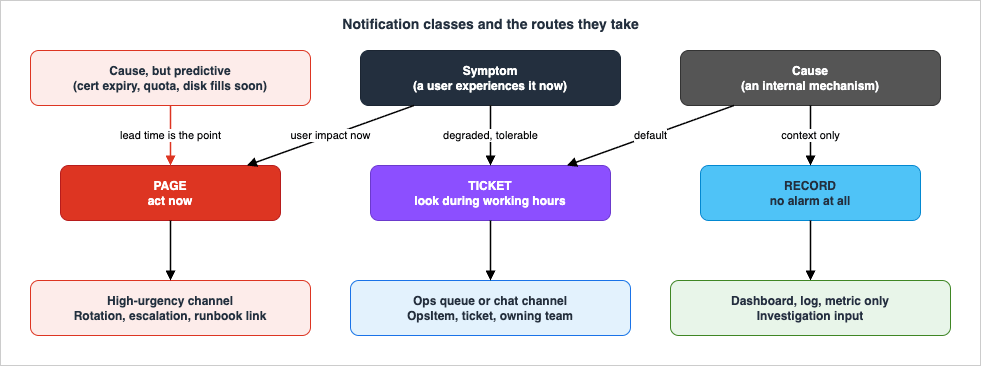
Every condition you are tempted to monitor lands in exactly one of three destinations. Deciding which one before choosing a metric is what keeps the set bounded.| Destination | The claim being made | Delivery | Test |
|---|---|---|---|
| Page | A human must act now, and waiting until morning makes it materially worse | High-urgency channel, paging rotation, escalation path | Is there something a human must do right now, and does a runbook say what? |
| Ticket | Something is wrong and someone should look during working hours | Queue, chat channel, ops item | Would you be comfortable if this were seen in six hours? |
| Record | The value is worth having when investigating, but implies no action | Dashboard, log, metric only — no alarm | Are you creating this because it is genuinely a decision input, or because it felt irresponsible not to? |
The third row is where most of the deletable alarms are. An alarm whose only consequence is that somebody acknowledges it is a dashboard widget wearing a costume.
2.2 Symptom versus cause
The second axis is orthogonal to urgency and is what keeps the number of paging alarms from scaling with the number of components.- A symptom alarm fires on something the user experiences: requests failing, latency past the point where the client gives up, a queue whose oldest message is older than the promise you made about it, an order pipeline that has stopped producing orders.
- A cause alarm fires on a mechanism: a full disk, a saturated connection pool, a throttled table, an unhealthy target.
Symptom alarms belong at the top of the routing tree because there are few of them, they map to user impact, and one of them can be true for many different reasons. Cause alarms are what you consult after being paged, and they should overwhelmingly be tickets and dashboard signals. The trap is that cause alarms are much easier to write — a saturated pool has an obvious number attached to it, whereas "the checkout experience is degraded" requires composing something — so an alerting scheme left to accrete becomes almost entirely cause alarms, which is precisely the configuration that produces twelve pages for one incident.
There is a legitimate exception, and it is worth naming so the rule does not get applied mechanically: a cause alarm earns paging status when it is predictive of an outage that has not happened yet and the lead time is what makes the fix possible. Certificate expiry, a quota you are approaching, a disk that will fill in two hours — nobody is affected yet, and that is the point. What distinguishes these from ordinary cause alarms is that acting late is qualitatively worse than acting early, not just quantitatively.
2.3 Writing the claim down
Two habits make the taxonomy survive contact with a growing account, and both use features CloudWatch already has.The alarm description is a free-text field of up to 1,024 characters on both metric alarms and composite alarms. It is the only place the reasoning survives the person who had it. Put the destination, the claim, and the runbook link there — the responder reads it in the notification, and the next engineer reads it when deciding whether the alarm can be deleted.
Tags are the other half. An alarm accepts as many as 50 tags, and setting them at creation time requires
cloudwatch:TagResource in addition to cloudwatch:PutMetricAlarm. A severity tag and an owning-team tag are what later make it possible to answer "which alarms page us?" without reading 400 alarm definitions, and — as Section 8.3 shows — tags are also what let you constrain, through IAM conditions, which alarms a given team is allowed to mute.If you have not previously had a starting point for what to alarm on at all, CloudWatch publishes one. Alarm recommendations are a curated set of best-practice alarms for metrics vended by AWS services, and each recommendation carries an intent, a threshold justification, and suggested values for statistic, period, comparison operator, treat-missing-data, evaluation periods, and datapoints to alarm. AWS deliberately leaves the threshold empty for metrics where the right value is workload-specific, and gives hints instead. They can be applied from the console or downloaded in bulk as infrastructure-as-code definitions per namespace — which matters for Section 11, because it means the starting point is reviewable in a pull request rather than clicked into existence.
3. How an Alarm Actually Evaluates
This section is the one that changes behavior. Most surprising alarm behavior — firing when nothing is wrong, staying quiet when something is, changing state twice for one event, flapping after a metric stops entirely — comes from the evaluation machinery rather than from the threshold. All of it is documented; very little of it is widely known.3.1 The two state axes
A metric alarm is in one of three alarm states:OK (the metric or expression is within the threshold), ALARM (outside it), or INSUFFICIENT_DATA (the alarm just started, the metric is unavailable, or there is not enough data to decide).Separately — and this is the part that tends to be missed — each alarm also has an evaluation state, which describes the health of the evaluation process itself rather than of your system:
| Evaluation state | Meaning |
|---|---|
PARTIAL_DATA | Not all available data could be retrieved, because of quota limits |
EVALUATION_ERROR | A configuration error in the alarm setup that needs correction; the StateReason field carries the detail |
EVALUATION_FAILURE | A temporary CloudWatch issue; AWS recommends manual monitoring until it resolves |
The evaluation state is visible in the console and through
describe-alarms / DescribeAlarms. It is worth surfacing on the operations dashboard, because an alarm sitting in EVALUATION_ERROR is an alarm that is not protecting anything while still appearing in the list of alarms that exist.3.2 Period, evaluation periods, datapoints to alarm
Three settings decide when the state changes:- Period — the length of time used to produce each individual data point for the alarm, in seconds.
- Evaluation Periods — how many of the most recent data points are considered.
- Datapoints to Alarm — how many of those must be breaching to go to
ALARM. Breaching data points do not have to be consecutive; they only have to fall within the last Evaluation Periods data points.
When the two counts differ you have an "M out of N" alarm, where M is Datapoints to Alarm and N is Evaluation Periods. The evaluation interval is N × period: 4 out of 5 with a 1-minute period is a 5-minute interval; 3 out of 3 with a 10-minute period is a 30-minute interval.
How often the alarm runs is a separate question from what window it looks at. For any period of one minute or longer, the alarm is evaluated every minute. If the period is 10, 20, or 30 seconds, it is evaluated every 10 seconds. If Evaluation Periods × period exceeds one day, the alarm becomes a multi-day alarm and is evaluated once per hour.
The AWS Cloud Operations team's own guidance is to prefer M < N — 2 of 3 rather than 3 of 3 — and the reason is specific rather than aesthetic. Metrics can arrive late; a data point that is delayed misrepresents the most recent slot at the moment of evaluation. Setting M below N means the alarm does not depend on the most recent, most delay-prone data point being correct.
There is a hard ceiling on the window: Period × Evaluation Periods cannot exceed 604,800 seconds (seven days), and for alarms with a period shorter than one hour the total cannot exceed 86,400 seconds (one day).
3.3 The evaluation range, and why a breaching data point may not fire
Here is the behavior that most often reads as a bug. When an alarm evaluates, CloudWatch retrieves more data points than Evaluation Periods. The exact number depends on the period length and whether the metric is standard or high resolution, and the time span of those extra points is called the evaluation range. Its purpose is to absorb ingestion delay: if the most recent slots are empty because data has not landed yet, real data from farther back can be used instead of treating the gap as signal.Three outcomes follow from that, and the third is the one people trip over:
- If no data points in the evaluation range are missing, the alarm is evaluated on the most recent Evaluation Periods data points and the extra ones are ignored.
- If some are missing but the total number of real data points retrieved is at least Evaluation Periods, the alarm evaluates on the most recent real data points, reaching farther back as needed — and the treat-missing-data setting is not consulted at all.
- Only if the real data points retrieved are fewer than Evaluation Periods does CloudWatch fill the gaps using your treat-missing-data setting, and even then it fills as few as it can, keeping every real data point in the evaluation.
The practical consequence, which AWS spells out in its troubleshooting guidance, is that a long period plus a single evaluation period produces a wide evaluation range: an alarm with a 1-hour period and 1 evaluation period retrieves three hours of data points. If that range holds one breaching and two non-breaching points, the alarm stays
OK even though the most recent point breached — and the operator staring at the graph sees a breach and no alarm. The fix is structural rather than a threshold change: shorten the period and raise the evaluation periods to cover the same wall-clock span. Turning 1 hour × 1 period into 15 minutes × 4 periods narrows the evaluation range from three hours to an hour and a half.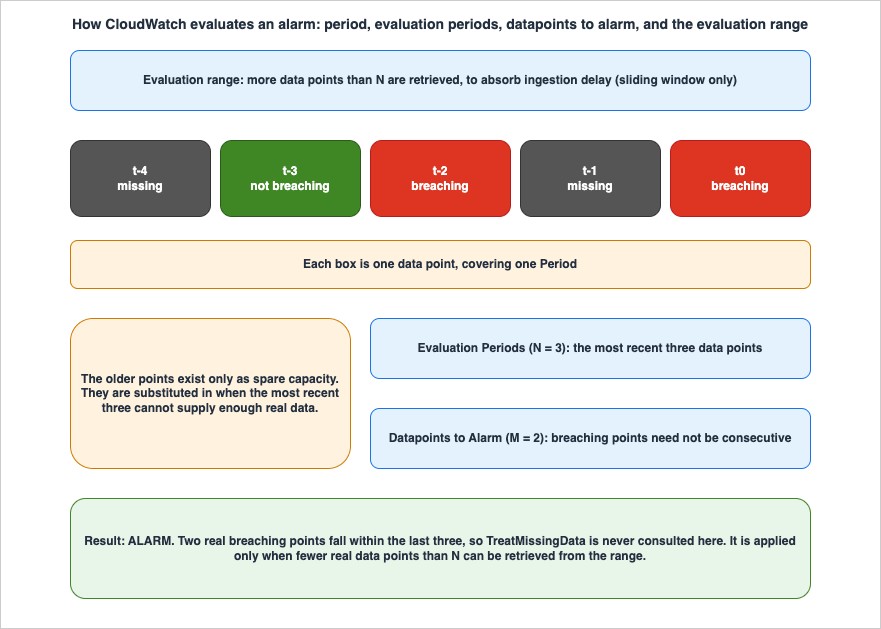
3.4 Missing data — the setting whose default surprises people
Each individual data point is in one of three categories, not two: not breaching, breaching, or missing. What CloudWatch does with the third is configurable per alarm:TreatMissingData | Behavior when the gap has to be filled |
|---|---|
notBreaching | Missing points are treated as good and within the threshold |
breaching | Missing points are treated as bad and violating the threshold |
ignore | The current alarm state is retained |
missing | If all data points in the evaluation range are missing, the alarm goes to INSUFFICIENT_DATA |
The default is
missing. That is the single most consequential default in this article, because missing means an alarm on a metric that stops being emitted goes quiet rather than loud — and a metric stops being emitted precisely when the thing emitting it has died. An alarm meant to catch "the worker stopped processing" that is left on the default will move to INSUFFICIENT_DATA when the worker stops, and INSUFFICIENT_DATA is a state most notification wiring ignores.The choice depends on the metric's emission behavior, and AWS gives the two ends of the spectrum explicitly. For a metric that continuously reports data and backs a rollback decision, treating missing as
breaching is reasonable, because absence probably indicates a problem. For a metric that only produces data points when something goes wrong — AWS names DynamoDB's ThrottledRequests — missing data means nothing went wrong, and notBreaching is correct.Two special cases are worth committing to memory:
- Alarms on metrics in the
AWS/DynamoDBnamespace always ignore missing data, regardless of what you set. When such a metric has missing data, the alarm holds its current state. Settingbreachingon a DynamoDB metric does not do what the setting says. - For alarms on Amazon EC2 metrics configured to take stop, terminate, reboot, or recover actions, AWS recommends treating missing data as
missingand having the alarm act only inALARMstate, because EC2 metric reporting can be briefly interrupted on a healthy instance. These are destructive actions; an alarm that stops or terminates an instance on a metric-delivery hiccup is a self-inflicted outage.
3.5 Premature alarm state — the logic that overrides M
CloudWatch deliberately avoids firing on the first breach after a run of gaps, because the next data point might be fine. With Evaluation Periods of 3, Datapoints to Alarm of 3, and an evaluation range of 5, a recent history of- - - - X or - - - X - does not immediately produce ALARM.But
- - X - - does — even when missing data is treated as missing. The rule AWS states is that an alarm always goes to ALARM when the oldest available breaching data point within the Evaluation Periods window is at least as old as the value of Datapoints to Alarm, and every more recent data point is either breaching or missing. This holds even if the total number of available data points is lower than M, and it applies to M-out-of-N alarms as well. It is the one case where an alarm fires on fewer breaching points than you asked for, and knowing it exists prevents an afternoon of trying to reproduce a "phantom" state change.One more evaluation quirk belongs here: an alarm may repeatedly re-evaluate the same last set of data points for a while after a metric stops flowing entirely. If the alarm had just changed state before the metric stopped, that re-evaluation can change the state again and re-execute the actions. AWS's stated mitigation is to use shorter periods.
3.6 Sliding versus wall clock evaluation windows
By default the evaluation window is a sliding window: it advances every time the alarm is evaluated, and its boundaries are not aligned to the clock. An alarm with a 1-hour period and 1 evaluation period might evaluate 13:07–14:07 on one pass and 13:08–14:08 on the next.The
EvaluationWindow parameter on PutMetricAlarm lets you swap that for a wall clock window, which aligns the evaluated range to fixed clock boundaries matching the period — the top of the hour for a 1-hour period, midnight for a 1-day period, and Monday 00:00 (the start of the ISO 8601 week) for a 1-week period. Those alignment points are fixed and cannot be changed. Omitting the parameter, or setting it to {"SlidingWindow":{}}, keeps the default.The reason this matters for alert fatigue is a specific, recurring false positive that AWS calls out directly: a daily backup alarm on a sliding window can enter
ALARM if two consecutive backups are more than 24 hours apart, even though every calendar day had a backup. A wall clock window evaluates each day independently and does not produce that page.The constraints are worth knowing before you reach for it:
| Property | Wall clock window |
|---|---|
| Supported periods | 60, 300, 3,600, 86,400, or 604,800 seconds only; other values return a validation error listing the supported ones |
| High-resolution alarms | Not supported (10, 20, 30 second periods) |
| PromQL alarms | Not supported; every other metric alarm type is |
| Time zone | Optional; IANA name (America/New_York), fixed offset (+05:30), or offset-prefixed identifier (UTC+05:30). Defaults to UTC. The offset must be a multiple of 5 minutes, and IANA names get automatic daylight-saving handling |
| Evaluation range | Does not apply. A wall clock alarm retrieves exactly Period × Evaluation Periods and does not reach farther back |
| Auto Scaling actions | Not recommended — the alarm reflects new data only after the period ends, which is too slow to track load |
| Metrics Insights alarms | CloudWatch reserves one extra period for alignment, so the effective ceiling becomes Period × (Evaluation Periods + 1) ≤ 3 hours; a 1-hour-period alarm supports 3 evaluation periods sliding but only 2 on wall clock |
Choosing between them is a single question: is the thing you are monitoring tied to a calendar period, or is it continuous? Batch jobs, nightly backups, and weekly compliance reports are calendar-shaped and belong on wall clock. Latency, error rates, and saturation are continuous and belong on sliding, which detects a breach as soon as data crosses the threshold rather than at the end of a period.
Note that the choice changes only the boundaries of the window, not how often the alarm runs. A 1-hour wall clock alarm is still evaluated every minute; each evaluation simply looks at the most recently completed clock hour.
4. Static Thresholds Done Right
A static threshold is still the right answer for most conditions. The problems attributed to static thresholds are usually problems with the statistic, the unit, or the sample count rather than with the number.4.1 Choose the statistic before the number
Statistic accepts SampleCount, Average, Sum, Minimum, and Maximum. Average is the default choice by habit and is frequently the wrong one for anything user-facing, because an average over a 5-minute period hides the tail that users actually experienced. For latency, percentiles are the honest statistic. The same choice decides whether a load test tells you anything: a run read as an average will agree with itself and disagree with the users, and the period the metric is aggregated over hides a further part of the run. Load Testing on AWS works through what a one-minute metric hides, and why the load generator's numbers and CloudWatch's numbers describe one run with two different clocks.Percentiles go in
ExtendedStatistic rather than Statistic, and when you specify a MetricName you must supply exactly one of the two. The valid forms are broader than most people use:| Form | Meaning |
|---|---|
p90 | Percentile |
tm90, TM(X%:X%) | Trimmed mean |
tc90, TC(X%:X%) | Trimmed count |
ts90, TS(X%:X%) | Trimmed sum |
wm90, WM(X%:X%) | Winsorized mean |
PR(n:m) | Percentile rank, where n and m are metric values |
IQM | Interquartile mean |
For the bounded forms, X is between 10 and 90 inclusive. The trimmed and Winsorized statistics are the ones to reach for when a metric has occasional extreme outliers that you want excluded from the aggregate without discarding the ordinary tail — a trimmed mean is far more stable than an average and far less jumpy than a raw maximum.
4.2 The low-sample-count trap
Percentile alarms have a failure mode that static-threshold alarms do not: in a quiet period, a p99 computed over a handful of requests is not meaningful, and one slow request can move it enough to fire.EvaluateLowSampleCountPercentile exists for exactly this. Set to ignore, the alarm state does not change during periods with too few data points to be statistically significant. Set to evaluate, or omitted, the alarm is always evaluated and can change state no matter how few data points there were — and omitted is the default.Any percentile alarm that pages a human and covers a service with variable traffic — overnight, weekends, a regional service outside its business hours — should have this set to
ignore unless you have a reason not to.4.3 Do not specify a unit
Unit looks like a correctness improvement and is usually a liability. AWS's recommendation is explicit: omit it, so that you do not inadvertently specify a unit that was never published for the metric. When you omit it, CloudWatch retrieves all unit types published for the metric and evaluates. When you specify one that does not match, the alarm gets stuck in INSUFFICIENT_DATA — silently, permanently, and looking exactly like a healthy alarm in a list.The one caveat AWS attaches: if a metric is published with multiple units and you do not specify one, the alarm's behavior is undefined. In practice metrics are published with a single unit, which is why omitting is the safer default.
4.4 High-resolution alarms
Periods of 10, 20, or 30 seconds make the alarm a high-resolution alarm, evaluated every 10 seconds. This only works properly on metrics stored viaPutMetricData with StorageResolution set to 1. Set a 10-second period on a metric that has only one-minute resolution and the alarm still tries to gather data at that rate, receives nothing for the attempts that do not line up with a one-minute data point, and lapses into INSUFFICIENT_DATA frequently — a specific and common source of flapping notifications.Wall clock windows are not available on high-resolution alarms, and AWS notes a higher charge for them, which — consistent with this article's scope — is a reason to be deliberate rather than a number to quote.
4.5 Start from the recommendations
For metrics vended by AWS services, the threshold argument has often already been had. Alarm recommendations give a metric-by-metric starting point that includes not just a threshold (where one is universally meaningful) but the intent, the threshold justification, and the recommended treat-missing-data, evaluation periods, and datapoints to alarm — which is to say, the parts of Section 3 that are easiest to get wrong. Treat them as a reviewed default to argue with, not as a set to adopt wholesale; AWS itself says you must review and configure the values for your needs, and recommends no actions by default.5. Metric Math and Composed Symptom Signals
Section 2 argued that symptom alarms should sit at the top of the routing tree and that the reason there are so few of them is that they are harder to express. Metric math is how you express them.5.1 Rates, not counts
The canonical case is the one that a raw count cannot express. "More than 50 errors in five minutes" is a threshold that is wrong at every traffic level except the one it was set at: it pages at 3 a.m. during a deploy that served two hundred requests, and stays silent at noon when the same rate would mean thousands of failed checkouts. The condition you meant is a ratio, and a ratio is an expression over two metrics:errorRate = (errors / requests) * 100An alarm set on that expression is a symptom alarm. It says something about what users experienced rather than about the size of a counter.
Three constraints govern the construction:
- The final expression must produce a single time series. Exactly one item in the
Metricsarray carriesReturnData: true, and that is the one the alarm watches. In the console this is the step where you clear every other checkbox. - A metric math alarm can reference at most 10 metrics. This is a hard limit that cannot be raised.
- Every metric in the expression must use the same period, and for a math-expression alarm you specify the period on each metric inside the
Metricsarray rather than on the alarm.
When 10 metrics is not enough, AWS documents three ways out: use a Metrics Insights query instead if the metrics share a namespace (Section 7), pre-aggregate into a custom metric with a Lambda function, or split the logic across several alarms and combine them with a composite alarm (Section 8). The third is usually the best of the three for alerting purposes, because it also gives you the intermediate states to look at during an incident.
One capability is missing from math-expression alarms: they cannot perform EC2 actions. Missing-data handling still applies, and a data point counts as missing when the expression returns no value for it.
5.2 Making the alarm care about time
A large fraction of "this alarm is noisy" reports are really "this alarm is noisy outside business hours, when the condition it describes is expected." Metric math can encode that directly, becauseMINUTE(), HOUR(), DAY(), DATE(), and MONTH() derive the calendar value of each data point's timestamp from the metric passed to them, and IF() can gate on the result.IF((DAY(m1)<6 AND (HOUR(m1)>=9 AND HOUR(m1)<17)), m1)Days of the week are numbered 1 through 7 from Monday, and hours 0 through 23, so this expression yields the original metric only on weekdays between 09:00 and 17:00 and nothing otherwise. An alarm on the resulting series is inert outside those hours.
Two honest caveats. The functions operate on the timestamp as CloudWatch stores it, so the "business hours" you get are the ones the underlying timestamps imply — if you need a specific local calendar, the wall clock evaluation window from Section 3.6 is the mechanism designed for that, and it handles daylight saving. And gating an alarm by time is a decision that nothing outside those hours is worth acting on; that is often true for a batch-facing internal service and almost never true for a customer-facing one. If the real requirement is "still notify, but not to the pager," the answer is Section 10's routing rather than a time gate that discards the signal.
6. Anomaly Detection
Anomaly detection replaces the number with a model. CloudWatch applies statistical and machine learning algorithms to a metric's past data, builds a model of expected values, and renders it as a band; an alarm can fire when the metric goes above the band, below it, or either way. Three comparison operators exist only for this purpose:GreaterThanUpperThreshold, LessThanLowerThreshold, and LessThanLowerOrGreaterThanUpperThreshold.It is genuinely the right tool for a specific shape of metric, and it is regularly presented as a general cure for false positives. It is not, and the reasons are in the documentation.
6.1 What the model actually is
| Property | What AWS documents |
|---|---|
| Training data | The algorithm trains on up to two weeks of metric data. You can enable it on a metric that does not yet have two weeks |
| Patterns modeled | Trend, plus hourly, daily, and weekly seasonality. It also works on flat patterns |
| Band width | You supply the anomaly detection threshold — the number of standard deviations. The default is 2, and a higher value produces a thicker band |
| Model scope | The model is specific to a metric and a statistic. A model built on AVG is an AVG model and tells you nothing about p99 |
| Logical bounds | For many common AWS-vended metrics, the band is prevented from extending outside logical values — a percentage stays within 0 and 100, and a count metric's band never goes below zero |
| Continuous adjustment | The model is continually re-evaluated and re-trained as values evolve, with additional predictors for metrics that are seasonal, spiky, or sparse |
| Excluded periods | You can exclude specified time ranges from training, so a deployment or a load test does not become part of "normal" |
6.2 What it does not do
The two-week training horizon is the boundary of what the model can know. AWS's Cloud Operations team states it plainly: anomaly detection does not extend beyond two weeks and cannot model one-time events, using Black Friday as the example. A seasonal peak that recurs annually is, from the model's point of view, an anomaly.The behavior that matters most for alert fatigue is what happens after a step change. When a metric's level shifts suddenly — the team's example is an average jumping from 1 to 1,000 — the band takes time to adapt, usually several hours, and during that window it can keep reporting anomalies and producing false alarms. This is the mechanism behind "we turned on anomaly detection and it was worse after the migration." The mitigation available is limited and worth knowing in advance: there are essentially two ways to adjust a band, namely changing the sensitivity (which changes width without retraining) or deleting and recreating the detector to force a retrain. Deleting an anomaly detector discards the trained model; the replacement starts from scratch and needs time before its band is meaningful, so this is not a step to take mid-incident.
Two more constraints:
- Anomaly detection models can be applied to metric math expressions, with basic arithmetic, comparison and logical operators, and most other functions supported; some functions are not. Creating and editing math-based detectors requires the latest version of the metrics interface — models created there are viewable but not editable in the older one.
- An alarm based on an anomaly detection model cannot have Auto Scaling actions.
For metrics ingested through the CloudWatch OTLP endpoint, the equivalent is built by hand in PromQL rather than with a managed model:
quantile_over_time for the baseline, stddev_over_time scaled by a multiplier for the width, and clamp_min to stop the lower bound going negative for a metric that cannot be negative. The trade-off is explicit — you own the sensitivity and the window, and there is no training period to wait for.6.3 Where it fits
The metrics that suit anomaly detection are those with a real, learnable rhythm and no defensible fixed number: request volume, order counts, connection counts, queue arrival rates. The metrics that do not are those with a genuine hard boundary (a quota, a timeout budget, a capacity limit), those that are sparse or bursty by design, and those whose "normal" you are actively trying to change.The right framing is that anomaly detection and static thresholds answer different questions and belong together. A static threshold on the same metric encodes the line you actually cannot cross; the anomaly band catches the departures from normal that occur well inside that line. Composing them — Section 8 — gives you an alarm that fires when the metric is both outside its expected band and past the point where it matters, which is a materially different claim from either one alone.
7. Fleet-Wide and Query-Based Alarms
There is a structural driver of alarm sprawl that no amount of threshold tuning addresses: one alarm per resource. A fleet of 200 instances with four alarms each is 800 alarm definitions to keep in agreement, and every scale-out event either creates more or leaves the new resource unmonitored.Query-based alarms are the answer to that, and they are the least-known part of the alarm surface. Instead of an alarm per resource, one alarm evaluates a query, and each time series the query returns becomes a contributor with its own state. The alarm goes to
ALARM when any contributor does, and — the part that matters operationally — the monitored set adjusts automatically as resources are added and removed. Create it once; anything that later matches the query joins the scope when its metric appears.7.1 Metrics Insights alarms
Metrics Insights is a SQL-like query language over metrics. Two shapes are useful for alarms, and AWS documents them as distinct use cases.Aggregate monitoring returns a single aggregated time series — the maximum CPU across the fleet, for instance — and the alarm behaves like any single-series alarm while automatically covering new instances:
SELECT FUNCTION(metricName)
FROM SCHEMA(...)
WHERE condition;
Per-resource fleet monitoring returns many time series, each a contributor:
SELECT AVG(DatabaseConnections)
FROM AWS/RDS
WHERE condition
GROUP BY DBInstanceIdentifier
ORDER BY AVG() DESC;
Both clauses in the second form are required rather than stylistic.
GROUP BY defines how the data splits into time series and therefore how many the query produces; ORDER BY establishes a deterministic ordering so the alarm evaluates the most important signals first.The limits are firm and shape the design:
| Limit | Value |
|---|---|
| Metrics Insights alarms per account per Region | 200 (default) |
| Data usable for evaluating conditions | Latest 3 hours only (the detail-page graph can show up to two weeks) |
Contributors tracked in ALARM | 100 |
EvaluationState becomes PARTIAL_DATA | Query returns more than 500 time series, or matches more than 10,000 metrics |
The contributor cap is not a silent truncation — it is visible in the alarm's
StateReason. With 150 time series and 95 of them breaching, the reason reads "95 out of 150 time series evaluated to ALARM"; with 105 breaching it reads "100+ time series evaluated to ALARM." A large volume of attributes can push the effective cap below 100. DescribeAlarmContributors returns the individual contributors currently in ALARM, which is what turns a fleet-wide alarm from "something is wrong somewhere" into an actionable page.7.2 Log alarms
A Log Alarm puts the threshold on a CloudWatch Logs Insights query rather than on a metric. The query runs on a schedule as a Scheduled Query, and the alarm evaluates the aggregated result. When the aggregation includes aby clause, each unique combination of field values becomes a contributor — which is the same fleet model applied to log data, and a way to alarm on high-cardinality conditions without minting metrics for them (Section 9).The configuration surface mirrors metric alarms closely enough to be recognizable:
QueryString, LogGroupIdentifiers, ScheduledQueryRoleARN, AggregationExpression, ScheduleExpression (for example rate(5 minutes)), StartTimeOffset and EndTimeOffset for the lookback window, ComparisonOperator, Threshold, and — the M-out-of-N pair — QueryResultsToEvaluate (N) and QueryResultsToAlarm (M), plus TreatMissingData.| Limit | Value |
|---|---|
| Log Alarms per account | approximately 1,000, bounded by the CloudWatch Logs managed Scheduled Query quota |
| Contributors per query execution | 500 |
Contributors tracked in ALARM | 100 |
Fields in the BY clause | 5 |
| Log lines in an SNS email notification | 50, also bounded by the SNS 256 KB payload limit |
That last row is a genuinely useful property for on-call: the notification can carry the offending log lines themselves, so the responder starts with evidence rather than with a metric name.
7.3 PromQL alarms and connected data sources
Two further sources round out the surface. PromQL alarms evaluate a Prometheus instant query against metrics ingested through the CloudWatch OTLP endpoint. They behave differently in two ways worth flagging: a PromQL alarm's state is set immediately toOK on creation rather than INSUFFICIENT_DATA, TreatMissingData does not apply to them, and they are the one alarm type that cannot use EvaluationWindow.Connected data source alarms watch metrics that are not in CloudWatch at all, retrieved through a Lambda function. The operational caveats are unusually specific and easy to get wrong. Because CloudWatch evaluates every minute regardless of period, the function must be able to return timestamps starting on any minute, spaced one period apart — an alarm with a five-minute period evaluated at 12:15 expects 12:00, 12:05, and 12:10, and at 12:16 expects 12:01, 12:06, and 12:11. Data points that do not align with the expected timestamps are dropped. If the function cannot resample to arbitrary offsets, every other evaluation degrades to missing data. AWS also recommends configuring these alarms to take actions on
INSUFFICIENT_DATA, because several classes of Lambda failure land there regardless of the treat-missing-data setting: a permission problem produces missing-data transitions, and any other error from the function moves the alarm to INSUFFICIENT_DATA.Finally, these query-based alarms interact with a newer parameter shape.
PutMetricAlarm now accepts an EvaluationCriteria union together with EvaluationInterval (the evaluation frequency in seconds — 10, 20, 30, or any multiple of 60, up to 3,600). When you use EvaluationCriteria, all evaluation parameters live inside that structure and the classic ones — Namespace, MetricName, Dimensions, Period, Statistic, Metrics, Threshold, ComparisonOperator, EvaluationPeriods, DatapointsToAlarm — cannot be supplied in the same call.8. Composite Alarms, Suppression, and Mute Rules
This is the layer that decides how many notifications one incident produces. AWS gives you three distinct mechanisms here, they compose, and their interaction has a documented precedence that is easy to get wrong.8.1 Composite alarms: one incident, one page
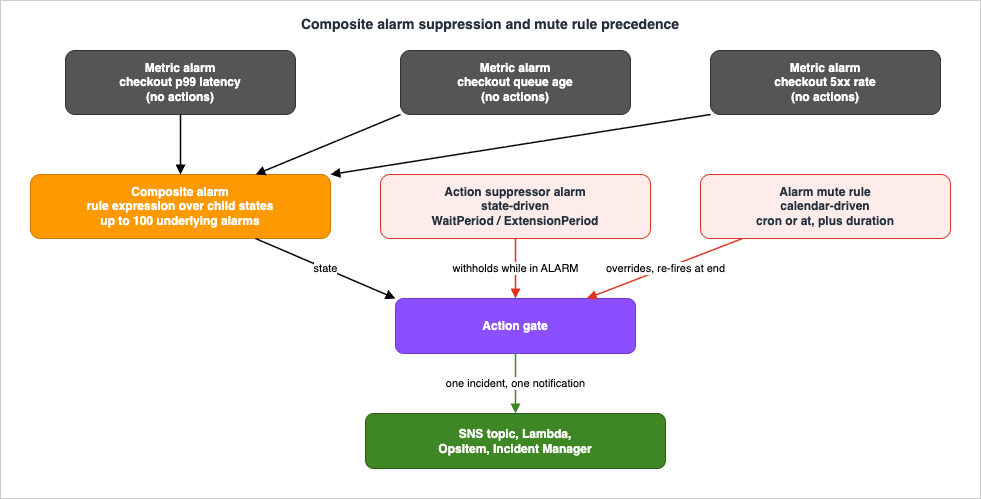
A composite alarm has no metric. It has a rule expression over the states of other alarms, and it goes toALARM only when the rule's conditions are met. The referenced alarms can be metric alarms or other composite alarms, so hierarchies are possible.The expression is boolean over alarm states, which is what lets you encode a claim rather than a threshold crossing:
ALARM("checkout-p99-latency")
  AND ALARM("checkout-queue-age")
  AND NOT ALARM("upstream-provider-degraded")
That composite says something a single metric alarm cannot: the checkout path is slow and backing up, and it is not because the upstream provider we do not control is already known to be degraded. Only the composite has an SNS action; the three children have none. One incident, one page.
The structural limits:
| Property | Value |
|---|---|
| Underlying alarms referenceable in one rule expression | 100 |
| Composite alarms that can reference a single alarm | 150 |
| Actions available | SNS notification, Lambda invocation, Systems Manager OpsItem, Systems Manager Incident Manager incident |
| Actions not available | EC2 actions and Auto Scaling actions |
INSUFFICIENT_DATA | Occurs only in the moment right after creation — the only time a composite alarm can be in that state |
Two operational notes. Updating an alarm completely overwrites its previous configuration rather than merging, which is an argument for managing them as code (Section 11.3). And cycles are possible: composite A can depend on B while B depends on A, at which point neither can be deleted because each is still referenced. AWS's documented way out is to break the cycle by changing one alarm's rule — the simplest change being to set its
AlarmRule to false. CloudWatch also stops evaluating when it detects a cycle in the evaluation path, so a cycle is not merely untidy; it is a region of your alerting that has quietly stopped working.8.2 Action suppression: silencing the downstream during a known upstream failure
The classic storm is an upstream dependency failing and every downstream alarm firing at once. Action suppression addresses it by letting a composite alarm nominate a suppressor alarm. Any alarm can serve as one. When the suppressor goesOK → ALARM, the composite stops taking actions; when it returns to OK, actions resume. The composite keeps evaluating and its state remains visible — only the actions are withheld.The subtlety is the transition window, where both alarms are moving and neither has settled. Two parameters exist for it, and both are required whenever
ActionsSuppressor is specified:WaitPeriod— the maximum time the composite waits for the suppressor to reachALARMbefore performing its actions. It compensates for the suppressor lagging behind. If your suppressor typically takes 60 seconds to goOK→ALARM, set 60.ExtensionPeriod— the maximum time the composite waits after the suppressor leavesALARMbefore performing its actions. It compensates for the composite lagging behind on the way back down.
AWS recommends 60 seconds for each, on the grounds that metric alarms are evaluated every minute. The composite takes no actions while either period is active, and takes actions based on its current state once they become inactive. State changes during a period restart or discard it: if the suppressor reaches
ALARM during a WaitPeriod, the wait is discarded and the suppressor takes over; if the composite returns to OK during a WaitPeriod, that wait is discarded and a new one starts on the next transition. Replacing the suppressor alarm discards any active WaitPeriod or ExtensionPeriod.Set both to zero and you get the failure this design exists to prevent: the composite fires in the seconds before the suppressor has caught up, and the storm you suppressed arrives anyway, once, on every incident.
8.3 Alarm Mute Rules: scheduled silence with an expiry
Suppression is driven by another alarm's state. Alarm Mute Rules, announced on 2026-02-10, are driven by the calendar — the mechanism for planned maintenance, deployment windows, load tests, and off-hours, where the noise is expected and the schedule is known in advance.A mute rule has an expression, a duration, a time zone, and a target list:
| Attribute | Detail |
|---|---|
| Expression | A cron expression for recurring windows, or at(yyyy-MM-ddThh:mm) for a one-time window |
| Cron fields | minute, hour, day of month, month, day of week — cron(0 9 * * SUN#4) activates on the fourth Sunday of each month at 09:00. English month (JAN–DEC) and day (SUN–SAT) names are accepted |
| Duration | ISO-8601, minimum PT1M, maximum P15D |
| Time zone | Standard identifiers such as America/Los_Angeles |
| Targets | Alarm names — metric alarms and composite alarms both. Up to 100 per rule, and they must be in the same account and Region as the rule |
| Optional bounds | Start and end timestamps, so a rule cannot activate before or persist after a given date |
| Quota | 2,000 mute rules per Region |
The behavior during a mute window is the part that makes this safe to use, and it is where mute rules differ from every homegrown "disable the alarm during the deploy" script:
- Alarms continue to evaluate and transition normally, and the state changes remain visible in the console and in alarm history. Only the actions are withheld.
- When the window ends, if a targeted alarm is still in the same state, CloudWatch automatically re-triggers the actions that were muted. The condition does not get to slip through because it started during a maintenance window.
- Muting is all-or-nothing across states and actions: every action on the targeted alarms is muted, for
OK,ALARM, andINSUFFICIENT_DATAalike. You cannot mute the page and keep the ticket. - A rule reports one of three statuses —
SCHEDULED,ACTIVE, orEXPIRED— andEXPIREDis what a one-time rule becomes after its window, or a recurring rule after its end timestamp passes.
The permission model deserves attention because it is what stops mute rules from becoming the new way monitoring disappears.
cloudwatch:PutAlarmMuteRule is required on two resource types: the mute rule resource (arn:aws:cloudwatch:REGION:ACCOUNT:alarm-mute-rule:*) and each alarm the rule targets (arn:aws:cloudwatch:REGION:ACCOUNT:alarm:NAME). IAM conditions can scope the second half by resource tag, so a team can be permitted to mute alarms tagged Team=TeamA and nothing else. This is the concrete payoff of the tagging habit from Section 2.3.A mute rule stops notifications from being delivered. Scope the target list to the alarms the planned work actually affects; a rule that targets a broad set for convenience is indistinguishable, during the window, from having deleted those alarms. The 15-day maximum duration and the
EXPIRED status are the service's own guard rails against a mute becoming permanent — which is more than can be said for a DisableAlarmActions call.8.4 Precedence, and how to choose
The two suppression mechanisms can both be active on the same composite alarm, and AWS documents which wins: mute rules take precedence and suppress all alarm actions. After the mute window ends, the composite's action suppression configuration then determines whether actions execute, based on the suppressor's state and the configured wait or extension periods.| Situation | Mechanism |
|---|---|
| A known upstream failure should stop downstream pages, and you cannot predict when | Action suppression with a suppressor alarm on the upstream |
| Planned maintenance, a deployment window, a load test, an announced shutdown | Mute rule, scoped to the affected alarms, with a duration that matches the work |
| An incident is already open and the same alarms keep re-notifying | Mute rule with an at expression for the length of the response, so the silence expires on its own |
| A condition is genuinely no longer worth alerting on | Delete the alarm — do not leave a permanent suppressor or a recurring mute rule standing in for a decision nobody wants to make |
The last row is the one that matters for alert fatigue. A permanent suppressor and an indefinitely recurring mute rule are both ways of not deciding, and they are worse than deletion because the alarm continues to appear in every inventory as though it were protecting something.
9. Metric Cardinality
Cardinality does not look like an alerting topic. It becomes one the moment somebody asks "why do we have four thousand alarms?", and the answer turns out to have been decided in a pull request that added one line to an instrumentation call.9.1 What a dimension costs you
A metric is identified by its namespace, its name, and its dimensions — up to 30 of them. Dimensions are not tags; they are part of the metric's identity. Every distinct combination of dimension values is a different metric, and retrieving data requires specifying all of the dimensions the metric was published with. PublishServerStats with Server=Prod, Domain=Frankfurt and a query for Server=Prod alone returns nothing — which is also the most common root cause of an alarm stuck in INSUFFICIENT_DATA after somebody changed the instrumentation.That identity property is the whole problem. Promote a customer ID, an order ID, or a request ID to a dimension and you have not added detail to one metric; you have created one metric per distinct value. AWS states this for the embedded metric format in exactly those terms: if you unintentionally create metrics based on high-cardinality dimensions such as
requestId, EMF will by design create a custom metric corresponding to each unique dimension combination.What breaks, in the order you notice it:
- Discovery. The metric list stops being browsable. Nobody can find the metric they need, so they create a new one.
- Dashboards. Widgets that were meant to show a service now show a thousand nearly identical lines, or one line per customer that means nothing in aggregate.
- Alarm manageability. Each series is something an alarm could be attached to. Somebody attaches them — often programmatically — and now the alarm inventory scales with your customer count rather than your architecture.
- Quotas. The account starts running into limits that were never a consideration during design, and the fixes are all disruptive.
None of this is recoverable by tuning thresholds. It is recovered by changing what is a dimension.
9.2 Designing the dimension set
The rule that follows is simple to state and takes discipline to hold: dimensions are for the small, bounded set of things you aggregate by; identifiers belong in the log record.Good dimensions are enumerable and stable — service, operation, environment, status code class, Availability Zone. You can list them, and the list does not grow with traffic. Bad dimensions are anything minted by a request: customer, order, session, request, trace, tenant, URL path with an ID in it.
In the embedded metric format, this is a structural decision rather than a convention, because EMF makes the dimension set explicit. The
_aws.CloudWatchMetrics metadata carries a Dimensions field that is an array of dimension key sets — each set is a distinct aggregation, and each set may contain at most 10 keys. Values are taken from top-level properties of the same document:{
"_aws": {
"Timestamp": 1565375354953,
"CloudWatchMetrics": [
{
"Namespace": "OrderSystem",
"Dimensions": [ [ "Operation" ], [ "Operation", "Partition" ] ],
"Metrics": [
{ "Name": "Requests" },
{ "Name": "ProcessingLatency", "Unit": "Milliseconds" }
]
}
]
},
"Operation": "Store",
"Partition": "4",
"Requests": 1,
"ProcessingLatency": 137.52,
"CustomerName": "Globex Corp",
"RequestId": "a4110ca8-4139-444d-ab95-ae8fe230aadc"
}The design is in the difference between the two lists.
Operation and Partition are named in Dimensions, so they generate metrics. CustomerName and RequestId are present in the document, fully searchable in Logs Insights, and generate nothing. Adding "RequestId" to a dimension set would be a one-token change with an unbounded consequence.EMF documents are subject to the same limits as CloudWatch Logs events, capped at 1 MB, and failures to generate metrics from them are themselves observable: EMF processing publishes metrics in the
AWS/Logs namespace that distinguish parsing failures from validation failures. That is worth an alarm — a silently failing EMF pipeline looks exactly like a healthy system with no traffic.9.3 Where the high-cardinality questions go instead
Demoting identifiers out of dimensions does not mean giving up per-customer investigation. It means moving it to the tools designed for it.CloudWatch Contributor Insights analyzes log data and produces time series of the top-N contributors, the number of unique contributors, and their usage — explicitly for fields that cannot be effectively monitored as metric dimensions, such as customer names and site IDs. A rule specifies a log group, a contribution key, a filter, and an aggregation: contribution
remote_ip, filter http_status IN [403, 404], aggregate COUNT(*) gives you the IPs generating the most access denials without creating a metric per IP.The output is not just a console view.
GetInsightRuleReport returns statistics per data point — UniqueContributors, MaxContributorValue, SampleCount, Sum, Minimum, Maximum, Average — and the INSIGHT_RULE_METRIC metric math function brings a rule's output into the metric space, which means you can alarm on a Contributor Insights rule. "The number of unique customers experiencing errors exceeded N" becomes a single alarm rather than N alarms. Rules are limited to 100 per Region by default, and the quota is adjustable.The Log Alarms of Section 7.2 are the other route, and they are complementary: Contributor Insights ranks contributors continuously, while a Log Alarm evaluates a scheduled query and can carry the matching log lines into the notification.
9.4 EMF and alarm timing
One timing property connects this section back to Section 3. EMF metrics are generated asynchronously — CloudWatch Logs has to process the log before the metric exists — so publishing logs promptly is a precondition for alarming on them. AWS's guidance for high-resolution metrics via EMF is to flush logs to CloudWatch Logs at an interval of 5 seconds or less, to avoid introducing a delay that causes alarming on partial or missing data. With the CloudWatch agent this is theforce_flush_interval parameter, which defaults to 5 seconds.Where you cannot control the flush interval — AWS names Lambda and other platforms — the documented mitigation is to use an M out of N alarm to control how many data points the decision rests on. This is the same recommendation as Section 3.2's, arrived at from a different direction, and it is the general shape of the answer whenever metric delivery is not perfectly punctual.
10. Routing and Escalation
By this point the set of conditions is small and each one has a stated destination. Routing is how the destination becomes real.10.1 What an alarm can do directly
Alarm actions are ARNs, and there are three independent lists —AlarmActions, OKActions, and InsufficientDataActions — each holding at most 5 items.| Action type | ARN form |
|---|---|
| SNS notification | arn:aws:sns:region:account-id:topic-name |
| Lambda invocation | arn:aws:lambda:region:account-id:function:name, optionally with :version or :alias |
| Systems Manager OpsItem | arn:aws:ssm:region:account-id:opsitem:severity#CATEGORY=category-name |
| Systems Manager Incident Manager | arn:aws:ssm-incidents::account-id:responseplan/response-plan-name |
| Amazon Q Developer operational investigation | arn:aws:aiops:region:account-id:investigation-group:investigation-group-id |
| EC2 action | arn:aws:automate:region:ec2:stop / :terminate / :reboot / :recover |
| Auto Scaling policy | arn:aws:autoscaling:region:account-id:scalingPolicy:... |
Three things follow from this table.
The
OKActions list is the most under-used field in CloudWatch. An alarm that notifies on the way into ALARM and never on the way out leaves the responder to work out whether it recovered, and leaves the channel full of unresolved-looking messages. Wiring OKActions to the same topic closes the loop.InsufficientDataActions deserves a deliberate decision rather than being left empty by default. For most alarms, notifying on INSUFFICIENT_DATA is noise. For an alarm whose whole purpose is to detect that something stopped — and especially for connected-data-source alarms, where AWS explicitly recommends it — it is the state that carries the signal.EC2 actions and the SSM integrations require the
iam:CreateServiceLinkedRole permission; the roles CloudWatch creates on first use are AWSServiceRoleForCloudWatchEvents and AWSServiceRoleForCloudWatchAlarms_ActionSSM. EC2 stop, terminate, reboot, and recover actions change or destroy running infrastructure. Combined with the missing-data behavior in Section 3.4, an alarm wired to terminate and left on a default treat-missing-data setting is a mechanism for turning a metric delivery gap into a deleted instance. AWS's recommendation for these — treat missing data as missing, act only on ALARM — is not optional advice.10.2 Routing through EventBridge
SNS fans a notification out. EventBridge routes on content, and that is what severity-based routing needs. CloudWatch sends three event types directly to EventBridge, all withsource: aws.cloudwatch and durable delivery:CloudWatch Alarm State Change— the event you route on. The detail carriesalarmName, the fullconfigurationincluding the metric and its dimensions,state, andpreviousState, each with a human-readablereasonand a machine-readablereasonData.CloudWatch Alarm Configuration Change— fires when an alarm is created, updated, or deleted, with anoperationfield. This is the audit signal for Section 11.CloudWatch Alarm Contributor State Change— the per-contributor equivalent for the multi-time-series alarms of Section 7.
A rule that pages only on transitions into
ALARM from OK, for one named alarm, is a small pattern:{
"source": ["aws.cloudwatch"],
"detail-type": ["CloudWatch Alarm State Change"],
"detail": {
"alarmName": ["checkout-degraded"],
"state": { "value": ["ALARM"] },
"previousState": { "value": ["OK"] }
}
}Because
configuration carries the alarm's dimensions, an input transformer can pull an instance ID or a table name out of the event and pass it to the target — which is how an alarm becomes an automated remediation rather than a notification. If you want to test patterns before wiring them, the EventBridge Pattern Tester does that against sample events.Two operational notes. Alarms can watch metrics in another account: the sharing account needs a role named
CloudWatch-CrossAccountSharingRole whose policy grants access to the monitoring account, and the monitoring account needs the AWSServiceRoleForCloudWatchCrossAccount service-linked role. And PutMetricAlarm has a maximum uncompressed payload of 120 KB, which is a real ceiling for large metric-math or Metrics Insights alarm definitions generated by templates.10.3 Escalation without duplicating the alarm
Escalation is usually implemented by putting the same person on several channels, which produces the same page three times. AWS Prescriptive Guidance describes the alternative, which is to make severity a property of the window rather than of the recipient list: several alarms on the same metric, with different thresholds and different evaluation periods, each routed to a different destination. A short window at a low threshold notifies the owning team through a chat channel; a longer window at the same threshold pages the team and its lead; a hard threshold over a longer period escalates further. Each alarm makes a different claim, and the claims are ordered by how long the condition has persisted, which is a better proxy for severity than the raw value.The same guidance makes a point that is easy to skip and expensive to relearn: target distribution groups, not individuals. An alarm whose SNS subscription is a personal address is an alarm that stops working when that person changes teams, and nothing in the system will tell you.
For the response side, alarm actions can open a Systems Manager OpsItem or start an Incident Manager response plan directly — which is how the notification becomes a tracked piece of work rather than a message. Composite alarms can do both, and composite alarms are usually the right thing to attach them to, since the composite is the thing that represents the incident.
11. Reviewing Alarms as a Product
An alarm set is not a project with a completion date. It drifts: services get decommissioned and their alarms outlive them, thresholds set for a traffic level that has doubled become permanently noisy, and the person who knew why an alarm existed leaves. Without a review cycle, every alerting scheme converges on the state described at the top of this article. AWS's own guidance recognizes this — the Cloud Operations team's alarm guidance includes a section on cleaning up low-value alarms, and OPS08-BP04 names "neglecting to address root causes, leading to repetitive alerts for the same issue" as an anti-pattern in its own right.11.1 The questions a review asks
The review is a small set of questions asked of every alarm that pages, on a fixed cadence:- Did it fire? What happened next? An alarm that fired and led to no action is the primary artifact of alert fatigue. Either the threshold is wrong, the condition is not worth a page, or the response is automatable. All three are decisions; leaving it alone is not.
- Did it not fire when it should have? The inverse is harder to see and is where postmortems earn their value. Every incident that was noticed by a human before an alarm caught it is a gap; the postmortem case studies are worth reading for how the detection gap gets described in public RCAs.
- Is it evaluating at all? Any alarm in
EVALUATION_ERROR, or permanently inINSUFFICIENT_DATA, is inventory rather than protection. Section 4.3's unit trap and Section 9.1's dimension mismatch are the two usual causes. - Does the description still describe it? If the alarm description no longer matches what the alarm does, nobody downstream can act on it.
- Is the notification path itself alive? A path that has never been exercised is a path that might not work. Testing it is a deliberate act — and note that
SetAlarmStateforces a state transition and executes the configured actions, so it exercises the real path; use it against a purpose-built test alarm rather than a production one, and never assume a state you force will not trigger downstream automation.
11.2 What to review it with
Three sources answer most of these questions without manual inspection.Alarm history is retained for 30 days and covers state transitions and configuration updates. Thirty days is shorter than most review cycles, which is why AWS's own Cloud Operations blog documents extending it: an EventBridge rule matching
CloudWatch Alarm State Change with a CloudWatch Logs log group as its target writes every transition to a log group you control the retention of, and Logs Insights then answers "which alarms fired most often last quarter" over a window longer than 30 days.CloudWatch Alarm Configuration Change events give you the other half — who changed what, and when. An alarm whose threshold was widened three times in six months is telling you something the alarm history alone does not.DescribeAlarms with its evaluation_state field is the cheap health sweep. It also returns the full configuration, which makes it the basis for a drift check against what your templates say should exist.11.3 Managing alarms as code
Everything in this article is more maintainable declared than clicked, and the reasons are specific rather than ideological:- Updating an alarm completely overwrites the previous configuration. There is no merge. A template is the only record of what the configuration was supposed to be.
- The evaluation settings from Section 3 — period, evaluation periods, datapoints to alarm, treat-missing-data, evaluation window — are exactly the fields that get set once, forgotten, and then copied into the next twenty alarms. In a template they are reviewable in a pull request; in the console they are invisible after creation.
- Composite alarm rule expressions are code. They deserve a diff.
- The starting point can be generated: alarm recommendations can be downloaded in bulk as infrastructure-as-code definitions for an entire namespace, so the first version of a service's alarm set can be a reviewed file rather than an afternoon of clicking.
The resource types are
AWS::CloudWatch::Alarm and AWS::CloudWatch::CompositeAlarm. On the composite resource, ActionsSuppressor, ActionsSuppressorWaitPeriod, and ActionsSuppressorExtensionPeriod are all no-interruption updates, so tuning the suppression windows from Section 8.2 does not disturb the alarm.Two habits complete the picture. Tag alarms with an owning team and a severity so the inventory is queryable, and put the review itself on a schedule with a named owner — the alarm set has an owner in the same sense a service does, or it has none.
12. Failure Modes and Anti-Patterns
| Anti-pattern | Why it produces noise or silence | What to do instead |
|---|---|---|
| An alarm on every metric a service emits | Alarm count scales with metric count, which scales with instrumentation. Most of them are cause signals nobody acts on | Classify first (Section 2). Symptoms page, causes ticket, the rest is a dashboard |
| Copying a threshold from another service | The number encoded one service's traffic shape. In a different one it is either permanently breached or never reached | Start from alarm recommendations where they exist, and state the threshold justification in the description |
Leaving TreatMissingData at the default | The default is missing. An alarm meant to catch "the worker stopped" goes to INSUFFICIENT_DATA — a state most notification wiring ignores — precisely when the worker stops | Decide per metric based on emission behavior (Section 3.4). Continuously-emitted metric backing a rollback decision: breaching. Error-only metric: notBreaching |
| Setting Datapoints to Alarm equal to Evaluation Periods | A single delayed data point misrepresents the most recent slot and produces a false transition | Prefer M < N, per AWS's own recommendation — 2 of 3 rather than 3 of 3 |
| A long period with one evaluation period | The evaluation range is far wider than the period suggests: 1 hour × 1 period retrieves three hours, so a breach can be outvoted by older non-breaching points | Shorten the period and raise the evaluation periods to cover the same span |
Specifying Unit for tidiness | A unit that was never published for the metric leaves the alarm permanently INSUFFICIENT_DATA, looking healthy in the list | Omit Unit |
| A high-resolution period on a standard-resolution metric | The alarm gathers at a rate the metric does not supply and lapses into INSUFFICIENT_DATA repeatedly, producing flapping notifications | Use 10/20/30-second periods only on metrics published with StorageResolution 1 |
| A percentile alarm with no low-sample-count handling | In quiet periods a p99 over a handful of requests is not meaningful, and one slow request fires the page | Set EvaluateLowSampleCountPercentile to ignore on percentile alarms that page |
| Treating anomaly detection as a cure for false positives | The model trains on at most two weeks, is specific to one statistic, cannot model one-time events, and takes several hours to adapt after a step change — during which it keeps reporting anomalies | Use it where there is a learnable rhythm and no defensible fixed number, and compose it with a static threshold rather than replacing one |
| A permanent suppressor or an indefinitely recurring mute rule | Both are ways of not deciding. The alarm still appears in every inventory as though it were protecting something | If the condition is no longer worth alerting on, delete the alarm |
ActionsSuppressorWaitPeriod and ExtensionPeriod at zero | The composite fires in the seconds before the suppressor catches up, so the storm arrives anyway — once, every incident | 60 seconds each, per AWS's recommendation, since metric alarms evaluate every minute |
| Composite alarms referencing each other in a cycle | Neither can be deleted, and CloudWatch stops evaluating when it detects a cycle — a region of alerting that has silently stopped working | Break the cycle by setting one alarm's AlarmRule to false, then restructure |
| An SNS subscription pointing at a person | Stops working when that person changes teams, and nothing reports it | Target distribution groups and rotations |
| A notification path that has never been exercised | An untested path is an assumption. The first real test is the first real incident | Test deliberately against a purpose-built alarm, and wire OKActions so recovery is also observable |
| Promoting an identifier to a metric dimension | One metric per unique value, by design. Discovery, dashboards, alarm manageability, and quotas degrade in that order | Keep dimensions to enumerable, stable fields. Send identifiers to logs, and use Contributor Insights or Log Alarms for top-N questions |
| One alarm per resource across a fleet | The definitions drift, and every scale-out either adds more or leaves the new resource unmonitored | Use a Metrics Insights alarm with GROUP BY, so the monitored set follows the fleet |
| Alarming on EMF metrics without controlling flush | EMF metrics are generated asynchronously from logs; a slow flush means alarming on partial or missing data | Flush at 5 seconds or less for high-resolution EMF metrics, and use M out of N where the interval is not yours to control |
| An EC2 stop/terminate action on default missing-data handling | Turns a metric delivery gap into destroyed infrastructure | Treat missing data as missing and act only on ALARM, per AWS's recommendation |
13. Frequently Asked Questions
Why did my alarm not fire when the graph clearly shows a breach?Most often the evaluation range. CloudWatch retrieves more data points than Evaluation Periods to absorb ingestion delay, and with a long period and a single evaluation period that range can be far wider than the period implies — an alarm with a 1-hour period and 1 evaluation period retrieves three hours of data. One breaching point among two non-breaching ones leaves the alarm
OK. Shorten the period and raise the evaluation periods to cover the same span. Two other candidates: the graph may include data points published after the last evaluation, and the graph's period may differ from the alarm's. Compare the aggregated value at the evaluation timestamp in the alarm history, not the current value on the graph.What is the default for missing data, and why does it matter so much?
The default is
missing, which sends the alarm to INSUFFICIENT_DATA when all data points in the evaluation range are absent. That is the opposite of what you want from an alarm whose job is to detect that something stopped, because a stopped component stops emitting. Set it deliberately per metric. Two exceptions to remember: alarms on AWS/DynamoDB metrics always ignore missing data regardless of the setting, and AWS recommends missing for EC2 alarms that take stop, terminate, reboot, or recover actions.Should I use a composite alarm or a metric math expression?
They solve different problems. Metric math composes values into a new signal — an error rate, a ratio, a derived utilization figure — and is limited to 10 metrics. A composite alarm composes states, can reference 100 underlying alarms, and lets each child keep its own evaluation configuration and missing-data treatment. If the condition is "these two independent things are simultaneously true," it is a composite. If it is "this number, computed from those numbers, is too high," it is metric math. When a math expression needs more than 10 metrics, splitting it and combining with a composite is one of the three ways out AWS documents.
When should I use a mute rule instead of composite alarm action suppression?
Suppression is state-driven and mute rules are calendar-driven. If the trigger is another alarm — an upstream dependency is down, so downstream pages are meaningless — use a suppressor. If the trigger is a schedule you know in advance — maintenance, a deployment window, a load test — use a mute rule. If both are active on the same composite alarm, the mute rule takes precedence and suppresses all actions; after the window ends, the suppression configuration decides based on the suppressor's state and the configured wait or extension periods.
Does muting an alarm mean I lose the event that happened during the window?
No, and this is the property that makes mute rules safer than the scripts they replace. Targeted alarms continue to evaluate and transition normally throughout the window, and the state changes remain visible in the console and alarm history — only the actions are withheld. When the window ends, if a targeted alarm is still in the same state, CloudWatch automatically re-triggers the actions that were muted. What you cannot do is mute selectively: every action on the targeted alarms is muted, across
OK, ALARM, and INSUFFICIENT_DATA alike.Will anomaly detection stop my false positives?
Not on its own, and in one situation it will add some. The model trains on at most two weeks of data, is specific to a single statistic, cannot model one-time events such as an annual sales peak, and — the part that matters most — takes time to adapt after a sudden level change, usually several hours, during which it can keep reporting anomalies. It is the right tool for metrics with a learnable rhythm and no defensible fixed number, used alongside a static threshold rather than instead of one, with training exclusion windows configured for deployments and load tests.
How do I alarm on something per-customer without creating a metric per customer?
Do not make the customer identifier a dimension. Keep it as a searchable field in the log record or as a non-dimension EMF property, then use CloudWatch Contributor Insights to rank top-N contributors and unique contributor counts, or a Log Alarm whose aggregation includes a
by clause so each field combination becomes a contributor. Contributor Insights output can be brought into the metric space with the INSIGHT_RULE_METRIC math function, so "the number of unique customers seeing errors exceeded N" is a single alarm. Both paths cap contributors tracked in ALARM at 100.How many alarms should page my team per week?
There is no number that this article can give you, and any article that gives you one is guessing about your system. What is measurable, and what a review cycle should actually track, is the ratio the number is a proxy for: of the alarms that paged, how many led to an action a human had to take. An alarm that fired and led to nothing is the artifact to act on, whether it happened once or fifty times.
We already have an observability stack. Where does this fit?
Below the SLO layer and above the raw signals. Instrumentation, tracing, and SLO definition are covered in the AWS Observability Architecture Guide; this guide covers what happens between "the signal exists" and "a human is interrupted." If you have SLOs and burn-rate alarming already, the parts of this article that still apply are Section 3 (the evaluation semantics underneath every alarm, including burn-rate ones), Section 8 (collapsing many conditions into one notification), and Section 9 (keeping the metric space navigable).
14. Summary
Alert fatigue is not solved by tuning thresholds. It is solved by deciding, explicitly and in advance, which conditions are allowed to interrupt a human, and then using the mechanisms CloudWatch provides to make everything else arrive somewhere quieter.The decisions that carry the most weight:
- Classify before configuring. Page, ticket, or record — and symptom or cause. Symptom alarms page because there are few of them and they map to user impact; cause alarms are what you consult once paged. Record the claim in the alarm description and make the inventory queryable with tags.
- Get the evaluation semantics right. They cause more false pages than thresholds do. Prefer M < N. Know that the evaluation range is wider than the period suggests and can outvote a recent breach. Set
TreatMissingDatadeliberately, because the default ismissing. Use a wall clock evaluation window for calendar-shaped work and a sliding window for continuous signals. - Choose the right way to state the condition. Static thresholds with the right statistic and
EvaluateLowSampleCountPercentilefor percentiles; metric math for rates and composed symptom signals within its 10-metric ceiling; anomaly detection where there is a rhythm and no defensible number, composed with a static threshold rather than replacing it; query-based alarms so one definition follows a fleet instead of one definition per resource. - Collapse many signals into one notification. Composite alarms turn an incident into a page. Action suppression handles the state-driven case with non-zero wait and extension periods; mute rules handle the calendar-driven case with an expiry the service enforces and a re-trigger when the window closes. Mute rules take precedence when both apply. When a condition is genuinely not worth alerting on, delete the alarm rather than leaving a permanent silencer.
- Treat cardinality as an alerting decision. Dimensions are for enumerable, stable fields; identifiers belong in the log record. Contributor Insights and Log Alarms answer the top-N questions without minting a metric per value.
- Review the set on a cadence, and manage it as code. An alarm that fired and led to no action is the artifact to act on. An alarm in
EVALUATION_ERRORis inventory, not protection. Updates overwrite rather than merge, which makes a template the only reliable record of what the configuration was meant to be.
The test that survives all of it is still the simplest one: if this fires at 3 a.m., is there something a human must do right now, and does the notification say what it is? If not, it is a dashboard.
15. References
- Amazon CloudWatch User Guide - Alarm evaluation
- Amazon CloudWatch User Guide - Alarm evaluation window
- Amazon CloudWatch User Guide - Create a metric alarm that uses a wall clock evaluation window
- Amazon CloudWatch User Guide - Configuring how CloudWatch alarms treat missing data
- Amazon CloudWatch User Guide - Alarm data queries
- Amazon CloudWatch User Guide - Limits
- Amazon CloudWatch User Guide - Log alarms
- Amazon CloudWatch User Guide - Alarming on logs
- Amazon CloudWatch User Guide - Alarm suppression
- Amazon CloudWatch User Guide - Alarm Mute Rules
- Amazon CloudWatch User Guide - Using CloudWatch anomaly detection
- Amazon CloudWatch User Guide - Math expressions with metrics
- Amazon CloudWatch User Guide - Embedding metrics within logs
- Amazon CloudWatch User Guide - Specification: Embedded metric format
- Amazon CloudWatch User Guide - Setting alarms on metrics created with the embedded metric format
- Amazon CloudWatch User Guide - Best practice alarm recommendations for AWS services
- Amazon CloudWatch User Guide - Recommended alarms (Classic)
- Amazon CloudWatch User Guide - Alarm events and EventBridge
- Amazon CloudWatch User Guide - CloudWatch service quotas
- Amazon CloudWatch API Reference - PutMetricAlarm
- Amazon CloudWatch API Reference - PutAlarmMuteRule
- Amazon CloudWatch API Reference - DescribeAlarmContributors
- Amazon CloudWatch API Reference - WallClockWindow
- Amazon EventBridge - Amazon CloudWatch events
- AWS CloudFormation - AWS::CloudWatch::CompositeAlarm
- AWS Well-Architected Framework - OPS08-BP04 Create actionable alerts
- AWS Prescriptive Guidance - Alarming options with CloudWatch
- AWS What's New - Amazon CloudWatch Alarm Mute Rules eliminate alert fatigue
- AWS Cloud Operations Blog - Elevating Your AWS Observability: Unlocking the Power of Amazon CloudWatch Alarms
- AWS Cloud Operations Blog - Operationalizing CloudWatch Anomaly Detection
- AWS Cloud Operations Blog - Enhance CloudWatch metrics with metric math functions
- AWS Cloud Operations Blog - Accelerate troubleshooting with structured logs in Amazon CloudWatch
- AWS Cloud Operations Blog - Extending and exploring alarm history in Amazon CloudWatch, part 1
- AWS Cloud Operations Blog - Introducing Amazon CloudWatch Alarm Recommendations
- AWS re:Post - How do I troubleshoot a CloudWatch alarm that doesn't invoke?
- AWS re:Post - How do I troubleshoot my CloudWatch alarm in the INSUFFICIENT_DATA state?
Related Articles
- AWS Observability Architecture Guide — The instrumentation, tracing, and SLO layer that produces the signals this guide decides what to do with.
- AWS Observability Glossary — Definitions for the vocabulary used throughout, including cardinality and the golden signals.
- CloudWatch Logs Insights Query Collection — Working queries for the log side of Sections 7 and 9.
- Incident Triage Flowcharts for Network, Database, and Application Issues — What the responder does after the page that Section 10 delivered.
- AWS Postmortem Case Studies and Design Lessons — Where the detection gaps that feed Section 11's review get described.
- AWS History and Timeline regarding Amazon CloudWatch — The service history behind the alarm features discussed here.
- Route 53 Health Check and Failover Pitfalls — The other evaluation engine in the AWS estate, with its own missing-data semantics.
- AWS Well-Architected Practical Checklist — Where OPS08-BP04 sits among the rest of the operational excellence practices.
- AWS Disaster Recovery Strategies Guide — The recovery objectives that decide which conditions are worth waking someone for.
- LLMOps Observability and Evaluation Architecture on AWS — The same alarm design applied to a workload whose quality signals are not numeric.
- AWS Service Quotas Practical Cheat Sheet — Watching the quotas that Section 9's cardinality growth eventually reaches.
- CloudWatch Logs Insights Query Builder Tool — Builds the queries behind Log Alarms and Contributor Insights investigations.
- CloudWatch Metric Filter Tester Tool — Tests filter patterns before they become metrics with dimensions you cannot take back.
- EventBridge Pattern Tester Tool — Validates the alarm state change patterns in Section 10.2.
- Amazon GuardDuty Extended Threat Detection Architecture — The detection side whose findings need the routing designed here.
- Chaos Engineering on AWS with AWS Fault Injection Service — Where these alarms become experiment stop conditions.
- Amazon EBS Performance Engineering — A worked example of which storage signals are worth alarming on.
References:
Tech Blog with curated related content
Written by Hidekazu Konishi