Route 53 Health Check and Failover - Common Pitfalls and Designs
First Published:
Last Updated:
This article is the long version of the "I wish someone had told me this before I shipped a multi-region failover" conversation. I read the Route 53 Developer Guide pages on health checks end-to-end, lined up the numbers (failure threshold, request interval, the 18 percent consensus rule, the four-second TCP-connection budget for HTTP/HTTPS checks, the 5,120-byte string-match window), and then walked through the five misconfigurations I see most often, with reproducible verification commands and a CloudFormation snippet for each fixed design.
If you have read AWS Postmortem Case Studies — Design Lessons from AWS Public RCAs, this article is the follow-up: those RCAs gave us the vocabulary (blast radius, cellularization, static stability), and Route 53 health checks plus failover routing are where most teams first try to apply that vocabulary. The pitfalls below are not edge cases — they are the default outcome if you do not design against them.
Pitfalls covered in this article
- Pitfall 1: A health check endpoint that returns 200 OK while the application is broken, because the health check tests the wrong layer.
- Pitfall 2: A failover that takes far longer than your TTL because of resolver caching and JVM-level DNS caching.
- Pitfall 3: A calculated health check that flaps because the at-least-N-of-M rule is set against a moving denominator.
- Pitfall 4: A CloudWatch alarm-backed health check that silently returns to "healthy" during a metric outage, because
InsufficientDataHealthStatuswas left at the default. - Pitfall 5: Public DNS resolvers that pin a stale record long after Route 53 has flipped, plus the special case of ALB and NLB DNS aliases.
The article ends with three workload-specific design patterns and a pre-launch checklist you can paste into a runbook.
Table of Contents:
- Route 53 Health Check Mechanics — How DNS Failover Actually Works
- Failover Routing Policy in Detail
- Pitfall 1: Health Check Logic Misalignment with Application Health
- Pitfall 2: TTL and DNS Caching Surprises
- Pitfall 3: Calculated Health Check Composition
- Pitfall 4: CloudWatch Alarm Integration
- Pitfall 5: Cross-Region Endpoint Caching by Resolvers
- Verification and Chaos Testing
- Decision Patterns by Workload
- Summary and Pre-Launch Checklist
- References
1. Route 53 Health Check Mechanics — How DNS Failover Actually Works
1.1 The Three Kinds of Health Checks
The Route 53 Developer Guide groups health checks into three kinds, and the rest of this article only makes sense if you remember which kind you are looking at:- Endpoint health checks — Route 53 health checkers in data centers around the world send HTTP, HTTPS, or TCP probes to an IP address or to a domain name on an interval you configure. This is the default and the only kind that actually probes an endpoint.
- Calculated health checks — A parent health check that aggregates the status of up to 255 child health checks using one of three composition rules: AND (all healthy), OR (any healthy), or "at least N of M" healthy. A calculated check cannot monitor another calculated check.
- CloudWatch alarm health checks — A health check whose state is driven by the data stream of a CloudWatch alarm in the same AWS account. Route 53 monitors the data stream itself, not the alarm state, which has consequences I will get to in section 6.
There is also Amazon Application Recovery Controller (ARC) routing controls, which look like health checks but are explicit on/off switches you flip. ARC is the right answer when you want a human or a runbook in the failover loop; it is not what this article is about.
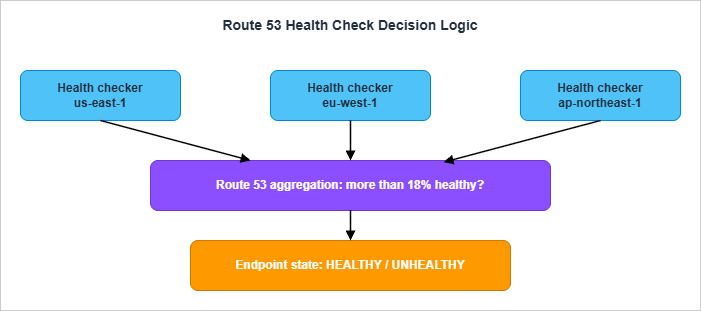
1.2 The 18 Percent Consensus Rule
The single most important sentence in the entire Route 53 Developer Guide health-check chapter is this:If more than 18% of health checkers report that an endpoint is healthy, Route 53 considers it healthy. If 18% of health checkers or fewer report that an endpoint is healthy, Route 53 considers it unhealthy.
That percentage is not a tunable. It is a built-in consensus threshold that exists for a specific reason: so that local network conditions in one or two health-check regions cannot mark your endpoint unhealthy. AWS's own framing is that the value "was chosen to ensure that health checkers in multiple regions consider the endpoint healthy" before flipping the verdict. The threshold may change in a future release, but as of writing it is the published value.
The practical consequence is that a single health checker thinks "is the endpoint up." Route 53 thinks "do enough health checkers agree the endpoint is up." This is exactly the same pattern AWS publishes in its RCAs for internal services: never let a single observer's verdict become a global truth, because a network partition in front of that observer is indistinguishable from the endpoint being down.
1.3 What "Healthy" Means Per Protocol
For an HTTP or HTTPS endpoint health check, an individual checker considers the endpoint healthy when:- A TCP connection is established within four seconds.
- After the connection, the endpoint returns an HTTP status code of 2xx or 3xx within two seconds.
That is the entire contract. A 4xx is a failure. A 5xx is a failure. A 2xx that takes 2.5 seconds is a failure. A 200 OK with a body that says "everything is broken" is a success. The status code is the truth, the body is not — unless you turn on string matching, in which case the search string must appear entirely in the first 5,120 bytes of the response body and the search string itself can be at most 255 characters.
For a TCP health check, the contract is shorter: the TCP handshake must complete within ten seconds. Nothing about the application is observed.
There are two surprises baked into the protocol layer that bite teams later. The Developer Guide states them explicitly:
HTTPS health checks don't validate SSL/TLS certificates, so checks don't fail if a certificate is invalid or expired.
If your renewal automation breaks and you serve an expired certificate, Route 53 will keep happily declaring the endpoint healthy. Browsers will refuse the connection. This gap is the reason I always pair an HTTPS health check with a separate certificate-expiry alarm that uses CloudWatch metrics on
AWS/CertificateManager.The second surprise: when you specify the endpoint by domain name (not IP), Route 53 only uses IPv4 to send health checks. If the domain only has AAAA records, the health check will fail with "DNS resolution failed." This is a footnote in the docs but it shows up in real environments that ship IPv6-first.
1.4 Request Interval and Failure Threshold
Two parameters determine how fast a Route 53 health check can flip:- Request interval: 30 seconds (Standard) or 10 seconds (Fast). This is the gap between the response arriving from the endpoint and the next request leaving the same checker.
- Failure threshold: 1 to 10. The number of consecutive checks an endpoint must fail (or pass, in the recovery direction) before Route 53 changes the aggregated state.
Neither value can be edited after the health check is created. If you wired up a check with interval 30 and threshold 3, the floor on detection time at the health-check layer is
30 × 3 = 90 seconds, plus aggregation. With Fast 10s and threshold 1, you can get there in roughly 10 seconds, at a higher cost and a higher false-positive rate.The aggregation step adds a delay you can rarely measure but should reason about. Health checkers run in many regions, and each runs its own threshold counter. Route 53 reaggregates the verdicts often enough that, in practice, the aggregation delay is small compared to the threshold delay — but it exists. When you read the propagation timeline in section 4 you will see this same number reappear.
1.5 What a Health Check Reports When New
One last detail that surprises people: a brand-new health check is considered healthy by Route 53 until enough data has been collected to flip it. If you turn on the Invert health check status option, a new health check is considered unhealthy until there is enough data.This means there is a small window after creation where the failover state is whichever direction you happened to pick by default. If you launch a new failover record and your primary's health check has not had time to gather enough data, Route 53 may already be returning the primary even though no probe has succeeded. This is rarely a problem in steady state, but it does matter during initial deploys and chaos drills — wait at least a few intervals after creating the check before declaring the test pre-conditions met.
2. Failover Routing Policy in Detail
2.1 The Two Failover Configurations
Route 53 supports two failover topologies that sound similar and behave very differently:- Active-passive failover uses the Failover routing policy with explicit primary and secondary records. Route 53 returns only the primary while it is healthy. If the primary is unhealthy, Route 53 returns the secondary.
- Active-active failover uses any other routing policy — weighted, latency, geolocation, geoproximity, or multi-value answer — with health checks attached to each record. All records that are currently healthy are eligible answers. There is no notion of "primary" in this mode; there are only healthy and unhealthy nodes.
Both topologies rely on the same health-check engine described in section 1. The difference is what Route 53 does with the verdict.
2.2 The "If No Record Is Healthy, All Records Are Healthy" Rule
There is one Route 53 rule that surprises every team the first time it bites them. It is buried in the documentation under "How Amazon Route 53 chooses records when health checking is configured":If none of the records in a group of records are healthy, Route 53 needs to return something in response to DNS queries, but it has no basis for choosing one record over another. In this circumstance, Route 53 considers all the records in the group to be healthy and selects one based on the routing policy and on the values that you specify for each record.
In other words: if everything is broken, Route 53 returns something anyway. It does not return NXDOMAIN. It does not refuse to answer. This is a deliberate design choice — a DNS service that stops answering during global failures is less useful than one that keeps answering with stale targets — but it has implications. If your runbook assumes "DNS goes silent so I will know there is a problem," your runbook is wrong.
The same idea is reasserted in the documentation of failover specifically:
If Route 53 considers both the primary and secondary records unhealthy, Route 53 returns the primary record.
Failover does not give you a "no answer" state. The worst case is "primary stays selected even though everyone agrees it is broken." Plan your monitoring around that fact: alarm on
HealthCheckStatus going to zero, not on the absence of DNS responses.2.3 Failover with Multiple Resources Behind One Side
A failover record can point to a single resource or to a group of resources behind another routing policy. This is where most realistic designs end up: a primary failover alias that targets a group of weighted records (or latency records, or an ALB), and a secondary failover alias that targets the standby region.Two rules to remember:
- The primary failover record is considered healthy as long as at least one of the resources behind it is healthy. This is the same rule alias records follow with
EvaluateTargetHealth: true. - For alias targets that are AWS resources (ALB, NLB, S3 website endpoint, another Route 53 record set in the same hosted zone), AWS strongly recommends
EvaluateTargetHealth: trueinstead of attaching an explicit health check. Route 53 will check the underlying resource's health automatically, including across the multi-AZ targets behind a load balancer.
The Developer Guide spells this out:
If you're routing traffic to any AWS resources that you can create alias records for, don't create health checks for those resources. When you create the alias records, you set Evaluate Target Health to Yes instead.
Translated: do not double up. If you have an ALB in a public subnet across three AZs, do not create your own HTTP health check against the ALB DNS name and attach it to a non-alias record. Use an alias record with
EvaluateTargetHealth: true and let Route 53 use the ELB's own health information. You will get faster, more accurate failure detection than any external probe could give you, because the ALB sees the targets that Route 53 cannot see.2.4 Optional Secondary Health Check
A subtle behavior that has caught me at least twice: when you configure failover, the health check on the secondary record is optional. If you omit it, Route 53 will return the secondary whenever the primary is unhealthy, even if the secondary is broken too.This is not always wrong. The classic example is a primary application server with a secondary alias to an S3 website that serves a static "we'll be back soon" page. The S3 website does not need a health check — its job is to be the always-on fallback. But if your secondary is itself an active region that you expect to take traffic, you want a health check on it too, otherwise the failover rule reduces to "swap to whatever is on the secondary, broken or not."
2.5 Weighted-Zero as an Active-Passive Hack
There is one more pattern worth knowing about because it shows up in older deployments. With weighted records, you can assign nonzero weights to some records and zero to others. Route 53 only considers the nonzero records initially; if all of them go unhealthy, it considers the zero-weighted records.This gives you a poor-man's active-passive that does not require the failover routing policy. It still works, but two cautions apply:
- The zero-weighted target must actually be a viable answer to a DNS query — Route 53 will use it eventually.
- All nonzero records must be unhealthy before zero-weighted records are returned. There is no "tiered" notion; it is a binary cliff.
For most new designs the failover routing policy is clearer. Weighted-zero is mostly useful as a transitional state when you are moving from a single-record deployment to a true failover topology.
3. Pitfall 1: Health Check Logic Misalignment with Application Health
3.1 The Anti-Pattern: HTTP 200 Lies
The single most common Route 53 health-check mistake is writing a health endpoint that returns 200 OK whenever the web server is running, regardless of whether the application can do its job. The classic version looks like this:# /healthz handler - DO NOT use as your only Route 53 health endpoint
@app.route("/healthz")
def healthz():
return "ok", 200
That endpoint returns 200 the moment the process is running. It returns 200 when the database connection pool is exhausted, when the Redis cache is unreachable, when the secret manager has failed to roll a credential, when a downstream API has been timing out for an hour. Every Route 53 health checker in the world agrees: 200 OK in less than two seconds, endpoint is healthy. Failover never fires.
The opposite mistake is just as bad: a health endpoint that calls every dependency on every probe.
# Also wrong - turns soft dependencies into hard ones
@app.route("/healthz")
def healthz():
    db.execute("SELECT 1")
    redis.ping()
    requests.get("https://api.partner.example/ping", timeout=1)
    s3.head_bucket(Bucket="reports")
    return "ok", 200
This passes all the same Route 53 probes as the trivial version, but it has converted every soft dependency into a hard one. If the partner API has a hiccup, your health check fails, Route 53 fails over, and you have just forced a regional flip because of a service that you only call once an hour during normal operation. The AWS Builders' Library article on health checks names this pattern explicitly:
If a service only occasionally needs a dependency, checking it in health endpoints means: if the dependency is down, the service also goes down, creating a cascading failure with increased scope of impact.
The fix is to be deliberate about what tier of health you are reporting.
3.2 The Three Layers of Health
The Builders' Library article uses three layers, and this terminology is worth adopting:- Liveness check — Is the process running and accepting connections on its port? This is what a TCP probe answers. It is what a load balancer should use to decide whether to put traffic on a target at all.
- Local health check — Is this instance healthy in ways that depend only on itself? Disk writable, file descriptor count below limit, ulimit not exhausted, critical worker threads alive. None of this requires reaching out across the network.
- Dependency health check — Can this instance reach the things it needs? Database, cache, secret store, downstream API. A failure here does not necessarily mean the instance is broken; it might mean the dependency is.
Route 53 health checks should generally be at the local health layer, not the dependency layer. The reason is the consensus rule from section 1.2: Route 53 is making a regional decision based on aggregated probes. If your probe encodes a dependency check, you are asking Route 53 to fail over a region whenever that dependency has trouble, even if the trouble is a flap in the dependency itself rather than your fault.
3.3 A Better /healthz
Here is the version I deploy when I want a single endpoint that Route 53 (or an ALB) can probe and that genuinely reflects whether the instance can serve traffic.import time
import threading
# State updated by background workers, not by the request handler
_health_state = {
"process_started_at": time.time(),
"last_db_check_at": 0.0,
"last_db_check_ok": False,
"fd_used_pct": 0.0,
}
_state_lock = threading.Lock()
def _refresh_db_health_loop():
while True:
ok = False
try:
db.execute("SELECT 1")
ok = True
except Exception:
ok = False
with _state_lock:
_health_state["last_db_check_at"] = time.time()
_health_state["last_db_check_ok"] = ok
time.sleep(5)
@app.route("/healthz")
def healthz():
with _state_lock:
s = dict(_health_state)
now = time.time()
if now - s["process_started_at"] < 30:
# Warm-up grace window
return "warming", 200
if s["fd_used_pct"] > 0.9:
return "fd-exhausted", 503
if now - s["last_db_check_at"] > 30:
return "db-stale", 503
if not s["last_db_check_ok"]:
return "db-unhealthy", 503
return "ok", 200
The important property is that the request handler does not call any dependency synchronously. A background loop checks the database every five seconds and updates a shared state variable. The handler reads the state. This means the probe stays fast (well under the four-second TCP budget and the two-second response budget), the dependency is checked at a controlled rate independent of probe frequency, and a brief dependency hiccup does not produce a thundering herd of probe-driven retries. The background interval (5 seconds) is shorter than Route 53's standard 30-second interval, so by the time Route 53 probes again, the state is already current.
3.4 Where to Attach Health Checks: ALB First, Route 53 Second
The other half of the fix is at the architecture layer. The right division of labor is usually:- The ALB or NLB runs the per-target health check at high frequency. It owns the within-target-group decisions: which instances get traffic, when an instance is taken out of rotation, when it is restored.
- Route 53 runs an alias record with
EvaluateTargetHealth: trueagainst the load balancer. It owns the regional failover decision. It does not probe the targets directly.
If you do this, you do not need a Route 53 endpoint health check on your application at all in steady state. The Route 53 alias automatically becomes unhealthy when the load balancer reports zero healthy targets in its target group. This is faster and more accurate than any external HTTP probe, because the load balancer has visibility into things Route 53 cannot see — like graceful deregistration, slow start, and target group draining.
The CloudFormation snippet for this pattern is short:
PrimaryAlias:
  Type: AWS::Route53::RecordSet
  Properties:
    HostedZoneId: !Ref HostedZoneId
    Name: !Ref AppDomainName
    Type: A
    SetIdentifier: primary
    Failover: PRIMARY
    AliasTarget:
      DNSName: !GetAtt PrimaryAlb.DNSName
      HostedZoneId: !GetAtt PrimaryAlb.CanonicalHostedZoneID
      EvaluateTargetHealth: true

SecondaryAlias:
  Type: AWS::Route53::RecordSet
  Properties:
    HostedZoneId: !Ref HostedZoneId
    Name: !Ref AppDomainName
    Type: A
    SetIdentifier: secondary
    Failover: SECONDARY
    AliasTarget:
      DNSName: !GetAtt SecondaryAlb.DNSName
      HostedZoneId: !GetAtt SecondaryAlb.CanonicalHostedZoneID
      EvaluateTargetHealth: true
No
HealthCheckId is attached. The two ALBs each run their own health checks against their target groups; Route 53 reads the ALB health through the alias's EvaluateTargetHealth semantics.I write more about layered routing-and-cert configurations like this in Adding CloudFront, WAF Edge, and ACM to a Custom Origin Like AWS Amplify Hosting, where the same alias-with-evaluate-target-health pattern shows up at the CloudFront layer.
4. Pitfall 2: TTL and DNS Caching Surprises
4.1 The Real Failover Time Equation
When you publish a failover SLO ("we will fail over in under five minutes"), you are making a claim about the sum of three independent delays:Total failover time =
health-check delay + # how long until Route 53 marks primary unhealthy
propagation delay + # how long until the new answer is everywhere
cache expiry delay # how long until clients re-resolve
Each one is bounded by a different parameter:
- The health-check delay is
Failure Threshold × Request Intervalplus a small aggregation window. With Standard 30s and threshold 3, it is a little over 90 seconds. With Fast 10s and threshold 1, it is a little over 10 seconds. - The propagation delay is the time for the new authoritative answer to be visible from all of Route 53's name servers. In practice this is a small number of seconds for hosted zones served entirely by Route 53 — but it is not zero, and it is not under your control.
- The cache expiry delay is bounded above by the record's TTL — in theory. In practice, downstream resolvers and clients can extend it, sometimes substantially.
The first two delays you can budget by setting the threshold and interval. The third delay is where the real surprises live.
4.2 The TTL Floor That Route 53 Imposes
For a Route 53 alias record, the effective TTL is the TTL of the underlying AWS resource record, not a value you set. For most aliases (ELB, CloudFront, S3 website endpoint) that ends up around 60 seconds. For non-alias records, you can choose any TTL — but choosing a very small TTL has costs (more queries hitting the resolvers, more queries reaching Route 53 for resolvers that bypass cache) and benefits that are limited by what the rest of the resolver chain does with your TTL.A reasonable failover record TTL is 60 seconds. Going below that (some teams set 10 or 20) usually does not buy you faster failover, because the resolvers in front of your clients enforce their own minimums.
4.3 Resolver Caching: The Resolvers Lie About Your TTL
Here is the part that is not under your control. When a public resolver answers a recursive query, the resolver caches the answer for what it considers the appropriate amount of time. RFC 2181 says it should respect the authoritative TTL. Real resolvers do not always.Some examples I have measured myself by querying public resolvers right after a known failover:
- Some resolvers honor very short TTLs faithfully, giving you the failover behavior you designed.
- Some resolvers enforce a floor, refusing to cache for less than 30 seconds even if the authoritative TTL is 5.
- Some resolvers "round up" small TTLs internally (a 60-second authoritative TTL might be served back to clients with a remaining TTL that drifts higher than expected during the cache lifetime).
Worse, there are intermediate caches you may not even know about: corporate DNS resolvers, container DNS sidecars, ISP recursive resolvers, the resolver in your home Wi-Fi router, the OS-level cache (macOS
mDNSResponder, Linux nscd or systemd-resolved, Windows DNS Client). Each one of these can extend the apparent TTL beyond what Route 53 publishes.The robust mental model is: your authoritative TTL is the lower bound on cache expiry, not the actual time clients will see the new answer. If your runbook says "TTL is 60 seconds so traffic moves in 60 seconds," your runbook is optimistic. A safer phrasing is "after the health check fires, expect most traffic to move within two times the TTL, but plan for stragglers up to ten times the TTL."
4.4 The Java InetAddress Trap
JVM-based clients have a special version of this problem. Thejava.net.InetAddress class caches successful DNS lookups, by default, for the lifetime of the JVM. The setting is controlled by the networkaddress.cache.ttl security property. Until Java 8 it was effectively forever; since Java 8u51 the default is 30 seconds for positive lookups when a security manager is not installed. With a security manager, the default is still infinite caching.The point is that a Route 53 TTL of 60 seconds does not make a Java client re-resolve every 60 seconds. If you have a long-lived JVM process — a Spring Boot service, a Tomcat application, an old-school Java daemon — and you do not explicitly override the cache TTL, the JVM may pin a resolved address for the full lifetime of the process.
The fix is one line in
java.security or two lines of code at startup:java.security.Security.setProperty("networkaddress.cache.ttl", "30");
java.security.Security.setProperty("networkaddress.cache.negative.ttl", "5");
Set these explicitly. Do not assume the platform default is what you want, because the default has changed over the JDK's history and varies by distribution.
4.5 Browser and HTTP Connection Pinning
Browsers and HTTP clients add another layer. Even after DNS re-resolves, an existing TLS connection to the old IP will keep being used until the connection naturally closes or the server sends aConnection: close. Modern browsers also do connection coalescing — multiple hostnames that share a certificate may share a single connection, and that single connection is pinned to a single IP regardless of DNS.Practical implication: failover is not finished when DNS is finished. It is finished when existing connections drain. For interactive workloads this happens quickly because users naturally close and reopen tabs. For long-lived API connections (gRPC, WebSocket, server-sent events), failover is only complete after the connection's keepalive expires or the server forcibly drops it.
The mitigation is server-side: after a failover, the now-secondary region (the old primary) should aggressively drop existing connections by sending close frames or simply terminating sessions, forcing clients to reconnect through DNS. If you cannot do that, plan for a long tail of traffic on the old endpoint.
4.6 Verifying TTL Behavior
The two commands I run during every failover drill:# Authoritative answer (skips resolver cache, asks Route 53 directly)
dig +short example.com A @ns-1234.awsdns-12.org
# Resolver answer (what real clients will see)
dig +noall +answer example.com @8.8.8.8
dig +noall +answer example.com @1.1.1.1
dig +noall +answer example.com @resolver.local
The authoritative answer should flip immediately when the health check verdict flips. The resolver answer flips on its own schedule. The gap between the two is the part of failover time that is not under your control.
A typical before-and-after looks like this:
$ dig +short example.com A @ns-1234.awsdns-12.org
192.0.2.10                        # primary IP, before failover

# ... (incident starts, primary becomes unhealthy)

$ dig +short example.com A @ns-1234.awsdns-12.org
198.51.100.10                     # secondary IP, immediately after authoritative flip

$ dig +noall +answer example.com @8.8.8.8
example.com.    37    IN    A    192.0.2.10   # resolver still has 37 s of TTL left

# ... (37 s later)

$ dig +noall +answer example.com @8.8.8.8
example.com.    60    IN    A    198.51.100.10  # resolver has now refreshed
That
37 in the second-to-last line is the part of failover that takes longer than your dashboard says it does. Watch for it during drills.5. Pitfall 3: Calculated Health Check Composition
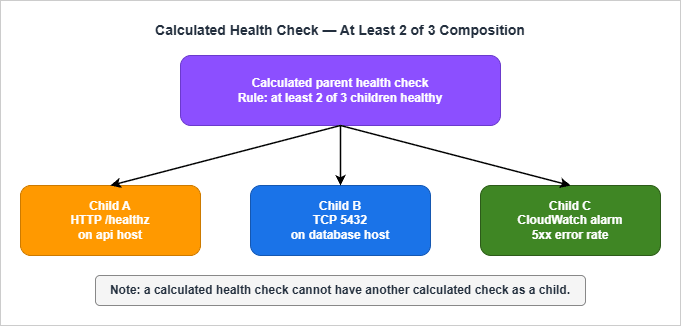
5.1 What a Calculated Health Check Is
A calculated health check is a parent check whose state is derived from the states of up to 255 child health checks. Three composition rules are available:- AND: Healthy only when every child is healthy.
- OR: Healthy when at least one child is healthy.
- At least N of M: Healthy when at least N of the configured children are healthy.
The Developer Guide is explicit that calculated checks cannot monitor other calculated checks — the tree is one level deep. There is also a well-defined edge case for the at-least-N rule: if N is greater than the number of children, the calculated check is always unhealthy. If N is zero, it is always healthy.
5.2 The Moving-Denominator Problem
The most common calculated-check pitfall is setting an at-least-N-of-M rule against a fleet whose size changes. Suppose you have three primary endpoints and you write a parent rule of "at least 2 of 3 healthy." That rule is sound until you add a fourth endpoint. You now have at-least-2-of-4, which sounds reasonable but means the parent stays healthy with half the fleet down, which is probably not what you want.The opposite mistake is just as bad: you write at-least-3-of-3 for an AND-equivalent, then scale up to four members. The parent will go unhealthy if any member is unhealthy and if any of the new members is unhealthy. There is no automatic adjustment. The N is fixed at the value you set when you created the rule.
I recommend two patterns to avoid this:
- For fleets where capacity is the goal (any one of the workers can serve traffic), use the OR rule. The parent stays healthy as long as at least one child is. This composes well with active-active behind a load balancer.
- For quorum-style health (at least a majority is required for the system to function), use the at-least-N rule but manage the rule from infrastructure code. Treat N as a property of the deployment and update the calculated check whenever the fleet size changes. Do not hand-edit it from the console.
5.3 What Children Should Be
A calculated check is not a way to combine application logic. It is a way to combine independent observations into a higher-level verdict. The clearest mental model is:- Children are simple endpoint or CloudWatch checks that each answer a single question.
- The parent is the business-level question ("is this region able to serve traffic at all?").
- Failover routing references the parent, not the children.
A pattern I use for region-level health: one calculated check per region whose children are (1) a TCP check on the database primary, (2) a CloudWatch alarm on the load balancer's
HTTPCode_Target_5XX_Count, and (3) an HTTP check on a synthetic transaction endpoint. The composition rule is "at least 2 of 3" — one signal flapping should not flip the region, but two correlated signals should.5.4 Inverted Health Checks for "Should Stop"
A useful but easy-to-miss feature is the inverted health check: a check whose state is the boolean negation of the underlying state. This is what you reach for when you want a routing decision to fire when something is true, not when something is false.Two examples:
- A maintenance-window kill switch. Configure a CloudWatch alarm that fires when a parameter
app/in-maintenanceis set, then create an inverted alarm-based health check that turns unhealthy during maintenance. Attach this to your primary failover record and Route 53 will route to the secondary on demand. This is a poor man's substitute for ARC routing controls — for serious shops, ARC is the better tool, but inverted alarms work without the additional dependency. - A "should not be receiving traffic" canary. If you deploy a new region in a holding state, attach an inverted check that returns unhealthy until you flip the underlying signal. The region will stay out of rotation by default and join only when you choose.
Inverted checks are also where the new-check-default behavior matters: a brand-new inverted check is treated as unhealthy until enough data is collected, the opposite of an uninverted check. This means an inverted check defaults to "active" (forces failover) until it has enough probes to disagree, which is exactly what you want for a kill-switch pattern but not what you want for an inverted dependency probe.
5.5 Disabled Versus Inverted
One more nuance worth knowing. A calculated check has a Disabled option that stops Route 53 from running the underlying checks. The Developer Guide is direct about what this means for the parent:If you disable a health check that a calculated health check is monitoring, Route 53 considers the disabled health check to be healthy as it calculates whether the calculated health check is healthy. If you want the disabled health check to be considered unhealthy, choose the Invert health check status check box.
So disabled = treated as healthy by the parent's aggregation. This is not what most operators expect when they "disable" a child. If you want a disabled child to drag the parent unhealthy (for instance, to take a region out of rotation by disabling its child checks), you must invert the child first or use a different pattern.
6. Pitfall 4: CloudWatch Alarm Integration
6.1 What Route 53 Actually Watches
A CloudWatch alarm-based health check is the path most teams reach for when they want to gate failover on something more sophisticated than an HTTP probe — for example, the 99th-percentile latency of an ALB, or the error rate of a synthetic Canary, or the lag of a Kinesis stream. The Developer Guide spells out a critical detail in the first paragraph of the relevant page:When you create a health check that is based on a CloudWatch alarm, Route 53 monitors the data stream for the corresponding alarm instead of monitoring the alarm state.
The distinction matters. If you use the CloudWatch
SetAlarmState API to manually push an alarm into the ALARM state, the Route 53 health check does not change, because Route 53 is not watching the alarm state — it is watching the metric data and re-applying the alarm's threshold logic on its own. This is a deliberate design choice to make the path more resilient (Route 53 does not need the alarm to be deployed and evaluating in CloudWatch for the check to work), but it produces a counter-intuitive failure mode: you cannot test your alarm-based health check by toggling alarm state.6.2 Insufficient Data: The Three-Way Switch
The most consequential setting on a CloudWatch alarm-backed health check isInsufficientDataHealthStatus. It controls what state the health check reports when CloudWatch does not have enough data points to evaluate the alarm. The three options:- Healthy — During a metric outage, the health check reports healthy. Failover does not fire.
- Unhealthy — During a metric outage, the health check reports unhealthy. Failover fires.
- Last Known Status — During a metric outage, the health check holds whatever state it had before the outage. New checks default to healthy if there is no last known status.
The right answer depends on what the metric represents.
- If the metric is a positive presence indicator ("requests per second is greater than zero"), then "no data" means traffic has stopped, which probably means failover should fire. Use Unhealthy.
- If the metric is a negative absence indicator ("error rate is below 1%"), then "no data" usually just means the metric pipeline is having trouble. Failing over because CloudWatch hiccupped is far worse than the underlying problem. Use Healthy or Last Known Status.
- If the metric is derived from a Synthetic Canary, "no data" probably means the Canary has not reported yet. Last Known Status is usually the right call here.
The default in the console is healthy when insufficient data for new health checks. This is fine for most cases but it is worth setting explicitly in IaC, both because you should document the choice and because the default has shifted historically.
6.3 Restrictions Worth Memorizing
Route 53 alarm-backed health checks have a list of restrictions that the docs mention only in passing:- Same account only. The alarm must live in the same AWS account as the health check. Cross-account alarms are not supported.
- Standard-resolution metrics only. High-resolution metrics (1-second granularity) cannot back a Route 53 health check.
- Statistics: Average, Minimum, Maximum, Sum, SampleCount only. Extended statistics are not supported.
- No metric math. An alarm that uses metric math expressions cannot be used.
- No M-out-of-N alarms. Route 53 does not support the CloudWatch alarm pattern that fires when M out of the last N data points breach the threshold. The alarm must use the simple "every data point in the period" evaluation.
These restrictions are why I usually do not put my fanciest dashboards behind a Route 53 alarm. The math-heavy alarms live in CloudWatch where they belong; the alarm-backed Route 53 health checks use simple statistics on a single metric.
6.4 Cross-Region Alarms Need Cross-Region Health Checks
Route 53 health checks themselves are managed in a single region — and the SNS topic for alarm notifications, when you create one through the Route 53 console, is created in us-east-1 by default. The Developer Guide says it plainly:Route 53 will create the topic in the US East (N. Virginia) Region.
This couples your alarming for Route 53 to us-east-1 availability. For a service whose entire job is to survive regional events, this is worth scrutinizing. My approach is to manage Route 53 health-check alarms through CloudWatch Alarms directly (not through the Route 53 console), targeting an SNS topic in a region of my choice. The Route 53 health check's
HealthCheckStatus metric is published in us-east-1 regardless, so I cannot fully escape that coupling — but I can at least pick where the notification path runs.6.5 When Not to Use a Calculated Alarm Health Check at All
A pattern I have seen go wrong: combining a CloudWatch alarm health check with a deep-application probe in a calculated parent, with the goal of "failover when either signal says we're broken."The problem is that the application probe and the alarm signal are correlated. If the application is genuinely degraded, the alarm will fire and the probe will fail at roughly the same time. You will not get a more sensitive signal — you will just get a flappier one, because two independent flap sources can each push the parent into a different state.
If you want defense in depth, prefer two independent signals: one synthetic transaction (the alarm) and one infrastructure check (a TCP probe on the database, for example). Compose them with at-least-1-of-2 if you want sensitivity, or at-least-2-of-2 if you want certainty. Do not compose two signals that measure the same thing through different lenses.
7. Pitfall 5: Cross-Region Endpoint Caching by Resolvers
7.1 Why This Pitfall Is Different from Pitfall 2
Pitfall 2 was about TTLs and how resolvers can extend them. Pitfall 5 is about something more specific: the choice of which Route 53 record gets returned can interact with resolver-side caching in ways that defeat your routing policy. The pitfall surfaces most often with latency-based routing, geolocation routing, and ALB/NLB DNS aliases.7.2 Latency Routing and Sticky Resolvers
Latency-based routing returns the record for the AWS region that is lowest-latency from the perspective of the resolver that is asking, not from the perspective of the end client. Most of the time the resolver's location is a reasonable proxy for the client's location. But:- A user on a corporate VPN may have their DNS forwarded to a resolver in a remote office, leading the latency policy to send them to the wrong region.
- A user behind a public DNS resolver (1.1.1.1, 8.8.8.8, 9.9.9.9) is geolocated by the resolver's IP, not the client's. EDNS Client Subnet (ECS) helps here for some resolvers (Google Public DNS, OpenDNS) but not all (Cloudflare 1.1.1.1 deliberately does not propagate ECS for privacy).
- A user with a long-lived DNS cache (browser, JVM, OS) gets the answer that was true when they first resolved, not the answer for their current network position.
The result is that a latency-routed record can pin a client to a non-optimal region for the duration of their cache lifetime, and re-resolution happens at the cadence the resolver chooses.
For workloads where this matters, the workaround is usually to not use latency routing for the failover decision — use a geolocation policy with explicit subnet rules, or use multi-value answer with ALB-level routing logic on the application side.
7.3 The ALB/NLB DNS Alias Special Case
Route 53 alias records that target an ALB or NLB have a specific behavior worth understanding. When the load balancer scales out, AWS may issue new IP addresses for the load balancer's DNS name. The alias record always returns the current set of IPs from the load balancer's DNS, which is usually what you want. But the resolvers in front of your clients are caching the DNS answer they received, not the alias relationship.This means that a client with a stale cache of the load balancer's DNS name can be sending traffic to an IP that the load balancer no longer owns. AWS handles this gracefully — the IPs are reused — but in the failover case, where you have flipped to a different region's load balancer entirely, the stale cache of the old load balancer's IPs is not useful at all.
The remediation is the same as in section 4.5: the formerly-primary region should aggressively close existing connections to force re-resolution. Application Load Balancers do not provide a single button for this, but you can achieve it by setting deregistration delay aggressively and by removing target groups during a controlled failover. NLBs are even more sensitive because their IPs are static per-AZ — a true regional failover means traffic that was pinned to an NLB IP is going to nothing.
7.4 Browser-Side Pinning
Browsers are the most aggressive resolver caches. Chrome and Firefox both maintain their own DNS caches in addition to the OS cache, with their own expiry rules. They also do "happy eyeballs" connection coalescing: if two hostnames share a certificate, the browser may keep using a single connection for both even if their DNS answers diverge.There is little you can do server-side to flush a browser cache. The workable mitigations:
- Keep the same domain name across primary and secondary regions, and let DNS handle the swap. Do not redirect users to a different hostname mid-failover.
- Ship
Connection: closeheaders from the formerly-primary region during graceful drain. This will not flush the DNS cache, but it will force the browser to open a new connection, and the new connection will resolve again. - Set short HTTP keep-alive on the load balancer. This is a tradeoff with latency but it limits the worst-case stale-connection lifetime.
7.5 Verifying Resolver Behavior
There is no perfect tool for "tell me what every resolver between me and the client is caching," but a few commands give you a reasonable signal:# Linux: clear local resolver cache
sudo systemd-resolve --flush-caches # systemd-resolved
sudo /etc/init.d/nscd restart # nscd
# macOS: clear DNS cache
sudo dscacheutil -flushcache
sudo killall -HUP mDNSResponder
# Java: print the current cache TTL the JVM is using
jrunscript -e 'print(java.security.Security.getProperty("networkaddress.cache.ttl"))'
# From multiple resolvers
for r in 8.8.8.8 1.1.1.1 9.9.9.9; do
echo "@ $r:"
dig +noall +answer +stats example.com A @$r
done
The last command, run from a few different machines after a failover, gives you a reasonable picture of how long the public resolvers are holding the old answer. The outliers (resolvers still showing the old answer fifteen minutes after the authoritative flip) are the ones to design for.
8. Verification and Chaos Testing
8.1 The Three Flavors of Verification
There are three things you might want to verify, and they need different tools:- Health-check verdict — Is Route 53 currently considering the endpoint healthy? Use
aws route53 get-health-check-statusand theHealthCheckStatusCloudWatch metric. - DNS authoritative state — What answer is Route 53 publishing right now, before resolver caches? Use
digagainst the authoritative name servers in the hosted zone. - DNS resolver state — What answer are public resolvers serving? Use
digagainst8.8.8.8,1.1.1.1, and any resolvers your clients actually use.
A failover drill that only checks the first one is testing the easy part. Add the second to confirm the routing decision propagated. Add the third to confirm the answer is reaching clients.
8.2 Forcing a Health Check Unhealthy on Demand
You cannot make a Route 53 health check go unhealthy by toggling a CloudWatch alarm viaSetAlarmState, because Route 53 watches the data stream, not the alarm state (section 6.1). The reliable ways to flip a check are:- Inverted check on a known signal. Have an inverted CloudWatch alarm-based check tied to a metric you control (
route53/test-inversion). Push values that breach the alarm threshold to flip the inverted check from healthy to unhealthy. - Block traffic at the security group or NACL. For an HTTP/HTTPS/TCP check against an EC2 instance or load balancer, deny traffic from Route 53's published health-checker IP ranges. This will fail probes within Failure Threshold × Request Interval seconds.
- Disable the resource itself. Stop the instance, drain the target group, or set the health check protocol to a port nothing is listening on.
- AWS Fault Injection Service. FIS has actions for stopping EC2 instances, throttling EBS volumes, and injecting API errors. None of them directly control a Route 53 health check, but they can produce the underlying conditions a health check is meant to catch.
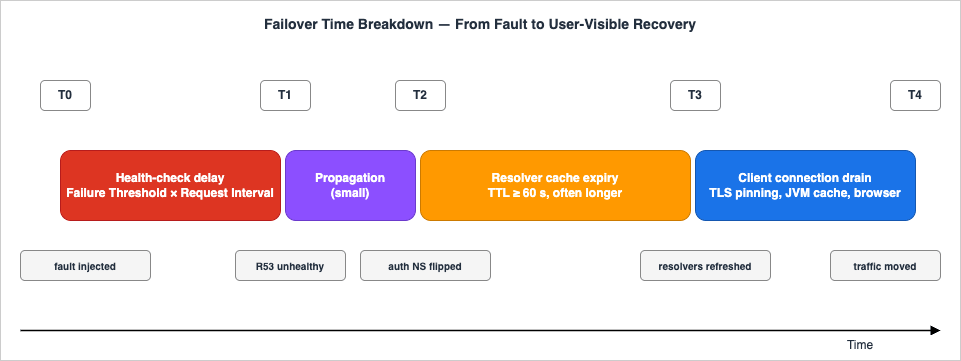
8.3 What a Drill Log Should Contain
When I run a Route 53 failover drill, the writeup needs five timestamps:- T0 — Fault injected.
- T1 — Route 53 health check first reports unhealthy (
HealthCheckStatus = 0). - T2 — Authoritative DNS returns the secondary record (
dig @ns-... +short). - T3 — Public resolver
8.8.8.8returns the secondary record. - T4 — Application metrics confirm traffic is flowing to the secondary region.
The deltas tell you which layer is your bottleneck. T1−T0 is the health-check layer (mostly Failure Threshold × Request Interval). T2−T1 is the propagation layer (small). T3−T2 is the public resolver cache. T4−T3 is the client-side cache and connection pinning.
In one of the drills I ran on a Standard 30s, threshold 3 health check, the typical numbers came out close to:
- T1−T0: ~95 seconds
- T2−T1: ~3 seconds
- T3−T2: between ~10 seconds and several minutes, depending on resolver
- T4−T3: another 10–60 seconds
The total user-visible failover ranged from about two minutes to about four minutes, depending on which resolvers their network used. The published "TTL is 60 seconds" claim was correct at the authoritative layer but misleading as a user-facing SLO.
8.4 Synthetic Monitoring as the Real Health Check
For workloads where the application's job is more complex than "respond 200 OK," a CloudWatch Synthetics Canary running a real transaction is often a better signal than a/healthz probe. The Canary runs a scripted browser or HTTP request, asserts on response content, and emits a CloudWatch metric. Wire that metric into a CloudWatch alarm, point a Route 53 health check at the alarm, and you get a failover decision based on whether the application's user-facing behavior is working — not on whether the web server is running.The tradeoff is the additional moving parts (the Canary itself, the alarm pipeline, the metric data stream) and the loss of the simple "Route 53 probes my endpoint directly" mental model. For applications with stringent SLOs and a willingness to invest in monitoring, the Canary-based path is more accurate. For simpler applications, an HTTP endpoint probe with a properly-designed
/healthz (section 3.3) is enough.9. Decision Patterns by Workload
9.1 Pattern A — Active-Passive, Single-Region Failover with S3 Holding Page
This is the simplest failover pattern, and the right answer for many internal applications and B2B portals. One application region is primary; the secondary is an S3 static website hosting a "we'll be back soon" page.PrimaryAlias:
Type: AWS::Route53::RecordSet
Properties:
HostedZoneId: !Ref HostedZoneId
Name: !Ref AppDomainName
Type: A
SetIdentifier: primary
Failover: PRIMARY
AliasTarget:
DNSName: !GetAtt PrimaryAlb.DNSName
HostedZoneId: !GetAtt PrimaryAlb.CanonicalHostedZoneID
EvaluateTargetHealth: true
HoldingPageAlias:
Type: AWS::Route53::RecordSet
Properties:
HostedZoneId: !Ref HostedZoneId
Name: !Ref AppDomainName
Type: A
SetIdentifier: holding
Failover: SECONDARY
AliasTarget:
DNSName: !Sub "s3-website-${HoldingPageRegion}.amazonaws.com"
HostedZoneId: Z3AQBSTGFYJSTF # us-east-1 S3 website hosted zone
EvaluateTargetHealth: false
The secondary deliberately has
EvaluateTargetHealth: false because the S3 website is the "always-on" fallback. Pairing this with HTTP cache headers on the holding page that direct browsers to retry quickly gives you a reasonable user experience during the incident.This pattern has the advantage that its complexity is bounded. The disadvantage is that "failover" only delivers a static page — there is no continuity of service. For tier-0 workloads you need Pattern B or C.
9.2 Pattern B — Active-Passive, Two Regions
The full active-passive failover between two AWS regions. Each region runs the application. The primary region serves traffic. The secondary region runs hot (or warm) and takes over on failure.PrimaryAlias:
Type: AWS::Route53::RecordSet
Properties:
HostedZoneId: !Ref HostedZoneId
Name: !Ref AppDomainName
Type: A
SetIdentifier: primary
Failover: PRIMARY
AliasTarget:
DNSName: !GetAtt PrimaryAlb.DNSName
HostedZoneId: !GetAtt PrimaryAlb.CanonicalHostedZoneID
EvaluateTargetHealth: true
SecondaryAlias:
Type: AWS::Route53::RecordSet
Properties:
HostedZoneId: !Ref HostedZoneId
Name: !Ref AppDomainName
Type: A
SetIdentifier: secondary
Failover: SECONDARY
AliasTarget:
DNSName: !GetAtt SecondaryAlb.DNSName
HostedZoneId: !GetAtt SecondaryAlb.CanonicalHostedZoneID
EvaluateTargetHealth: true
Recommended health-check parameters: Standard 30 seconds, Failure Threshold 3. The 90-second floor is short enough for most SLOs and long enough to ride out brief flaps. The data layer is the harder problem (Aurora Global Database, DynamoDB Global Tables, asynchronous replication with explicit recovery point objectives), but the routing layer is the easy part once you have set
EvaluateTargetHealth: true on both aliases.The trap to avoid: do not turn on string matching to verify a complex application response unless you really need to. The string-match adds cost, adds the 5,120-byte response window constraint, and ties failover to the format of a specific response. A simple 200 OK on a well-designed
/healthz is almost always better.9.3 Pattern C — Multi-Region Active-Active with Latency Routing
For globally distributed workloads where you want all regions taking traffic and only failing over the affected region, latency routing with health checks is the standard pattern.UsEast1Alias:
Type: AWS::Route53::RecordSet
Properties:
HostedZoneId: !Ref HostedZoneId
Name: !Ref AppDomainName
Type: A
SetIdentifier: us-east-1
Region: us-east-1
AliasTarget:
DNSName: !GetAtt UsEast1Alb.DNSName
HostedZoneId: !GetAtt UsEast1Alb.CanonicalHostedZoneID
EvaluateTargetHealth: true
EuWest1Alias:
Type: AWS::Route53::RecordSet
Properties:
HostedZoneId: !Ref HostedZoneId
Name: !Ref AppDomainName
Type: A
SetIdentifier: eu-west-1
Region: eu-west-1
AliasTarget:
DNSName: !GetAtt EuWest1Alb.DNSName
HostedZoneId: !GetAtt EuWest1Alb.CanonicalHostedZoneID
EvaluateTargetHealth: true
ApNortheast1Alias:
Type: AWS::Route53::RecordSet
Properties:
HostedZoneId: !Ref HostedZoneId
Name: !Ref AppDomainName
Type: A
SetIdentifier: ap-northeast-1
Region: ap-northeast-1
AliasTarget:
DNSName: !GetAtt ApNortheast1Alb.DNSName
HostedZoneId: !GetAtt ApNortheast1Alb.CanonicalHostedZoneID
EvaluateTargetHealth: true
Each record uses latency routing. Each is an alias with
EvaluateTargetHealth: true, which means the regional ALB's own health propagates up. When one region's ALB stops reporting healthy targets, that record drops out of the latency pool, and Route 53 routes those queries to the next-best region.Two cautions for this pattern. First, latency routing's geolocation is based on the resolver, not the client (section 7.2). For applications where a client should be pinned to a region for compliance reasons (data residency, regional licensing), use geolocation routing instead. Second, the "if no record is healthy, all records are healthy" rule (section 2.2) means a global failure can produce queries that go to broken regions. Plan capacity so that a single region can absorb at least the expected per-region load during a multi-region degradation, and design clients to fail gracefully when the answer they got is broken.
9.4 Choosing Between Patterns
A short decision matrix:| Workload requirement | Pattern |
|---|---|
| Internal app, short outages tolerable, simple architecture | A (S3 holding page) |
| Tier-0 service, two regions, failover required | B (active-passive) |
| Global service, always-on in many regions | C (active-active latency) |
| Compliance requires per-region pinning | C with geolocation policy instead of latency |
| Human-in-the-loop failover required | B or C with ARC routing controls |
The patterns are not exclusive — large systems use all three for different domains. A SaaS provider might use Pattern C for the public marketing site, Pattern B for the application API, and Pattern A for the customer support portal. The choice for each surface depends on what failure modes are tolerable for that surface, not on a one-size-fits-all rule.
For more on the broader design context — Route 53's own evolution, the introduction of routing policies, and the addition of ARC and Multi-Region Access Points — I traced the timeline in AWS History and Timeline of Amazon Route 53. Reading the feature history alongside the pitfalls in this article makes the design choices clearer.
10. Summary and Pre-Launch Checklist
Route 53 health checks and failover routing look simple on a diagram and behave subtly in production. The five pitfalls in this article — health-check logic misalignment, TTL caching, calculated-check composition, CloudWatch alarm integration, and resolver caching — are not edge cases. Each one is the default outcome of doing the obvious thing and not the careful thing. The fixes are individually small but they only work if you have applied all of them.A pre-launch checklist I run through before pushing any new failover configuration to production:
- Health endpoint is at the local-health layer, not the dependency layer. Background-refreshed state, no synchronous dependency calls in the request handler, fast response (well under the 4 s TCP / 2 s response budget).
- TLS certificate expiry is monitored separately, because HTTPS health checks do not validate certificates.
- Alias records use
EvaluateTargetHealth: truewhen targeting AWS load balancers. No double health checks. - Failure Threshold and Request Interval are set deliberately. 30 s × 3 (= 90 s detection) for most cases; 10 s × 1 only when the higher cost and false-positive rate are justified.
- TTL is consistent with claimed failover SLO. Aliases use the underlying resource's TTL (~60 s for ELB/CloudFront aliases). Non-aliases are set with awareness that downstream resolver caches may extend the effective TTL by a factor of two to ten.
- Java clients explicitly set
networkaddress.cache.ttl. Default behavior depends on JDK version and security manager configuration and is not safe to assume. - Calculated health checks have a fixed denominator or are managed from infrastructure code that updates the at-least-N rule when the fleet size changes.
- CloudWatch alarm-backed checks have
InsufficientDataHealthStatusset explicitly, with the choice documented (Healthy / Unhealthy / Last Known) based on whether the metric is a presence or absence indicator. - Failover drills measure all four T-deltas: T1−T0 (health check), T2−T1 (propagation), T3−T2 (public resolver cache), T4−T3 (client connection pinning).
- The runbook does not assume DNS will go silent. Route 53 returns something even when nothing is healthy ("if no record is healthy, all records are healthy"), and the failover routing policy returns the primary record when both primary and secondary are unhealthy.
If you can defend each of those ten points without flinching, your failover will probably do roughly what you think it does. If you cannot, you have found your next backlog items.
11. References
- Amazon Route 53 Developer Guide — How Amazon Route 53 determines whether a health check is healthy
- Amazon Route 53 Developer Guide — Types of Amazon Route 53 health checks
- Amazon Route 53 Developer Guide — Values that you specify when you create or update health checks
- Amazon Route 53 Developer Guide — Active-active and active-passive failover
- Amazon Route 53 Developer Guide — Failover routing
- Amazon Route 53 Developer Guide — How Amazon Route 53 chooses records when health checking is configured
- Amazon Route 53 Developer Guide — Best practices for Amazon Route 53 health checks
- AWS Builders' Library — Implementing health checks
- AWS Postmortem Case Studies — Design Lessons from AWS Public RCAs
- AWS History and Timeline of Amazon Route 53
- Adding CloudFront, WAF Edge, and ACM to a Custom Origin Like AWS Amplify Hosting
References:
Tech Blog with curated related content
Written by Hidekazu Konishi