AWS History and Timeline regarding Amazon CloudWatch - Overview, Functions, Features, Summary of Updates, and Introduction
First Published:
Last Updated:
This article gathers the major milestones of Amazon CloudWatch into a single chronological reference, so that SREs, operations engineers, observability practitioners, and solutions architects can see how the service evolved without digging through years of release notes. This article focuses on the major service-level releases and capability launches — the ones that changed what CloudWatch fundamentally is — rather than every minor console tweak, regional expansion, or SDK revision. Pricing figures are deliberately omitted because they change frequently; consult the official AWS pricing pages for current numbers.
The diagram below shows the shape of the platform that this history built up to: telemetry is ingested from many sources, stored as metrics, logs, and traces, then visualized and analyzed, and finally turned into alarms and automated actions.
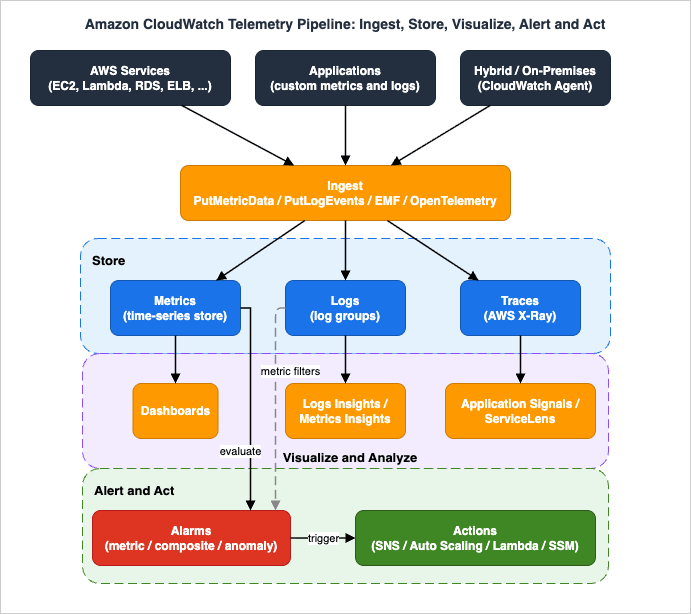
Background and Method of Creating Amazon CloudWatch Historical Timeline
The purpose of this timeline is twofold:- Tracking the history of Amazon CloudWatch and organizing the transition of its updates over time.
- Summarizing the current feature list and characteristics of Amazon CloudWatch so the service can be understood as a whole.
- What's New with AWS?
- AWS News Blog
- Amazon CloudWatch Documentation (Document history)
- Amazon CloudWatch Logs Documentation (Document history)
Note: Please note that the items on this timeline are not all updates to Amazon CloudWatch features, but are representative updates that I have picked out. Each entry links to its primary AWS source (a What's New announcement, an AWS News Blog post, or the official documentation history) so that the original context can be verified.
Amazon CloudWatch was first announced on May 17, 2009, launched together with Auto Scaling and Elastic Load Balancing as part of a single release that gave Amazon EC2 its first native operations toolkit.
Amazon CloudWatch Historical Timeline (Updates from May 17, 2009)
The table below lists the milestones in ascending order (oldest first, newest last). Use the year index to jump to a specific period.2009 | 2010 | 2011 | 2012 | 2013 | 2014 | 2015 | 2016 | 2017 | 2018 | 2019 | 2020 | 2021 | 2022 | 2023 | 2024 | 2025 | 2026
| Date | Summary |
|---|---|
| 2009-05-17 | Amazon CloudWatch is announced and launched together with Auto Scaling and Elastic Load Balancing. It initially provides basic Amazon EC2 instance metrics (CPU utilization, disk, and network) at five-minute intervals with two weeks of retention, plus alarms with Amazon SNS notifications and Auto Scaling actions. [Source] |
| 2010-06-14 | Amazon CloudWatch adds monitoring for Amazon EBS volumes. Performance metrics for bandwidth, throughput, latency, and queue depth become available through the CloudWatch API and the AWS Management Console. [Source] |
| 2010-12-03 | Amazon CloudWatch Basic Monitoring for Amazon EC2 becomes free of charge for all instances. Five-minute-interval metrics with two weeks of retention are provided at no cost in all regions, while one-minute Detailed Monitoring remains a paid option. [Source] |
| 2011-05-10 | Amazon CloudWatch introduces Custom Metrics via the PutMetricData API. Customers can publish arbitrary application and business metrics with up to ten dimensions, and metrics for Amazon EBS, Amazon RDS, and Elastic Load Balancing are provided at no charge. [Source] |
| 2012-05-10 | Amazon CloudWatch launches billing alerts for estimated AWS charges. Customers can enable estimated-charge monitoring and receive Amazon SNS notifications when total or per-service charges cross a defined threshold. [Source] |
| 2012-07-18 | Amazon CloudWatch adds metrics for Amazon EC2 status checks. System and instance reachability checks are tracked automatically for all instances, enabling alarms on instance health. [Source] |
| 2013-01-08 | Amazon CloudWatch Alarms gain Amazon EC2 stop and terminate actions. Alarms can now automatically stop or terminate idle or underutilized instances, for example after CPU utilization stays low for a sustained period. [Source] |
| 2013-05-14 | AWS OpsWorks adds a built-in Amazon CloudWatch metrics view. Thirteen one-minute CloudWatch metrics for CPU, memory, and load are collected per instance and grouped by stack, layer, and instance, ready for alarms. [Source] |
| 2013-10-28 | Elastic Load Balancing adds new Amazon CloudWatch metrics for backend health. The BackendConnectionErrors, SurgeQueueLength, and SpilloverCount metrics help operators assess backend capacity and detect rejected requests. [Source] |
| 2014-07-10 | Amazon CloudWatch Logs is introduced. A new installable agent enables near-real-time collection, durable storage, and search of system, application, and custom log files, with metric filters that turn log patterns into CloudWatch metrics and alarms. [Source] |
| 2014-09-30 | Amazon CloudWatch Logs expands to the US West (Oregon) and EU (Ireland) regions. The first regional expansion beyond US East followed the July 2014 launch, with the Logs agent supported on Amazon Linux, CentOS, RHEL, and Ubuntu. [Source] |
| 2014-11-10 | Amazon CloudWatch Logs adds support for monitoring AWS CloudTrail events. Metric filters on CloudTrail event streams let customers alarm on specific API activity, such as detecting unauthorized calls. [Source] |
| 2014-12-18 | Amazon CloudWatch Logs expands to the Tokyo, Singapore, Sydney, and Frankfurt regions. The rollout brought CloudWatch Logs to major Asia Pacific and European markets within its first year. [Source] |
| 2015-01-12 | Amazon EC2 Auto Recovery via a CloudWatch alarm becomes available. An alarm on the system status-check metric can automatically recover an impaired instance onto new hardware while preserving its ID, IP addresses, and configuration, starting in the US East (N. Virginia) Region. [Source] |
| 2015-01-20 | Amazon CloudWatch Logs adds metric filters for JSON-formatted log events. Filter patterns can match JSON field names and values to extract metrics, graph time series, and set alarms on structured logs. [Source] |
| 2015-07-23 | Amazon CloudWatch Alarms add a reboot action for Amazon EC2 instances. Reboot joins stop, terminate, and recover as alarm-triggered EC2 actions and works on all instance types in all public regions. [Source] |
| 2015-08-02 | AWS publishes the CloudWatch Logs Subscription Consumer for streaming logs to Elasticsearch and Amazon S3. The Amazon Kinesis-based reader ships with connectors and prebuilt Kibana dashboards for VPC Flow Logs, Lambda, and CloudTrail data. [Source] |
| 2015-09-30 | Amazon CloudWatch Logs adds near-real-time processing with AWS Lambda. A Lambda function can be set as the destination of a subscription filter to process, analyze, or forward log events as they arrive. [Source] |
| 2015-10-08 | Amazon CloudWatch Dashboards is launched. Customers can build reusable, shareable views that combine metrics from multiple services and custom metrics, with cross-region data and linked zooming, initially in eight regions. [Source] |
| 2015-10-28 | Amazon CloudWatch Logs becomes available in the AWS GovCloud (US) region with VPC Flow Logs support. US government customers gain near-real-time log monitoring and durable storage, including delivery of VPC Flow Log records. [Source] |
| 2015-11-03 | Amazon CloudWatch Logs subscription filters add Amazon Kinesis Data Firehose as a destination. Log events can be delivered to Firehose-supported targets including Amazon S3 and Amazon Redshift. [Source] |
| 2015-12-07 | Amazon CloudWatch Logs adds export of log data to Amazon S3. Stored log data can be exported for long-term archiving and offline analysis. [Source] |
| 2015-12-18 | Amazon RDS launches Enhanced Monitoring, streaming over 50 OS-level metrics to Amazon CloudWatch Logs. CPU, memory, file-system, and disk-I/O metrics are delivered at up to one-second granularity for MySQL, MariaDB, and Amazon Aurora. [Source] |
| 2016-01-14 | Amazon CloudWatch Events is launched. A near-real-time stream of resource-change events, plus scheduled (cron and rate) rules, routes events to targets such as AWS Lambda, Amazon Kinesis, and Amazon SNS. This service later became the foundation for Amazon EventBridge. [Source] |
| 2016-03-10 | Amazon CloudWatch Logs adds AWS CloudTrail support and native CloudWatch metrics for log activity. CloudTrail tracks changes to Logs resources while CloudWatch publishes metrics for log event counts and data volumes per log group. [Source] |
| 2016-03-30 | Amazon CloudWatch Events adds Amazon SQS queues as an event target. Rules can route matched events directly to SQS queues, providing a persistent, decoupled destination alongside AWS Lambda and Amazon SNS. [Source] |
| 2016-04-06 | Amazon CloudWatch Logs becomes available in the AWS China (Beijing) region. Customers in the Beijing region gain near-real-time log monitoring, metric extraction, and durable storage. [Source] |
| 2016-11-01 | Amazon CloudWatch extends metric retention to 15 months and updates the console. Metrics are stored at tiered granularity (1-minute for 15 days, 5-minute for 63 days, 1-hour for 455 days), with a refreshed graphing experience. [Source] |
| 2016-11-07 | Amazon CloudWatch adds the ability to pivot from a metric graph to the underlying log events. Metrics created by Logs metric filters gain a View Logs option that jumps from a point on a graph to the associated log group and events. [Source] |
| 2016-11-17 | Amazon CloudWatch adds percentile statistics and new dashboard widgets. Percentiles such as p90, p95, and p99 become available for alarms and graphs, alongside Number and Stacked Area dashboard widgets. [Source] |
| 2017-02-20 | Amazon CloudWatch adds alarm status widgets to dashboards. Alarm widgets can be combined with Number, Line, and Stacked Area visualizations so that metrics and their thresholds appear together in a single view. [Source] |
| 2017-07-05 | Amazon CloudWatch Dashboards adds a programmatic API and AWS CloudFormation support. The PutDashboard, GetDashboard, DeleteDashboards, and ListDashboards APIs let dashboards be defined as infrastructure as code. [Source] |
| 2017-07-26 | Amazon CloudWatch introduces high-resolution custom metrics and alarms. Custom metrics can be published at 1-second resolution and alarms can evaluate periods as short as 10 seconds for faster detection. [Source] |
| 2017-12-08 | Amazon CloudWatch Logs adds AWS KMS encryption for log groups. Log groups can be associated with a customer managed key so that ingested data is encrypted throughout its retention period. [Source] |
| 2017-12-08 | Amazon CloudWatch Alarms add M-out-of-N datapoint evaluation. The DatapointsToAlarm parameter triggers an alarm when any M of N consecutive datapoints breach the threshold, reducing false positives from transient spikes. [Source] |
| 2017-12-14 | Amazon CloudWatch introduces the unified CloudWatch agent. A single agent collects system metrics and logs from Amazon EC2 and on-premises servers on Linux and Windows, deployable at scale through AWS Systems Manager. [Source] |
| 2018-04-04 | Amazon CloudWatch launches Metric Math. Arithmetic and statistical expressions across metrics produce new time series for dashboards and alarms, retrieved efficiently through the new GetMetricData API. [Source] |
| 2018-06-14 | Amazon CloudWatch Metric Math adds bulk array transformations and rate functions. A single expression can be applied across an array of metrics, and the RATE function computes rate of change over time. [Source] |
| 2018-09-24 | Amazon CloudWatch adds the GetMetricWidgetImage API. The API returns a PNG snapshot of any metrics chart so that live graphs can be embedded in wikis, chat tools, and ticketing systems outside the console. [Source] |
| 2018-09-28 | The unified CloudWatch agent adds StatsD and collectd custom-metric ingestion. The agent can receive StatsD datagrams or collectd payloads and forward them as CloudWatch custom metrics from any application stack. [Source] |
| 2018-11-20 | Amazon CloudWatch introduces Automatic Dashboards and alarms on Metric Math expressions. Prebuilt dashboards follow AWS best practices with no setup, and alarms can be defined directly on metric math expressions. [Source] |
| 2018-11-27 | Amazon CloudWatch Logs Insights becomes generally available. A purpose-built query language delivers fast, interactive analytics that scale to hundreds of terabytes per day, with results exportable to dashboards. [Source] |
| 2019-01-24 | The CloudWatch agent adds the procstat plugin for per-process monitoring. procstat tracks CPU, memory, file-descriptor, and thread metrics for individual processes, and the agent gains support for multiple configuration files. [Source] |
| 2019-06-25 | Amazon CloudWatch Application Insights launches for .NET and SQL Server workloads. It scans resource groups to recommend metrics and log patterns, applies machine learning to detect anomalies, and builds automatic dashboards for root-cause analysis. [Source] |
| 2019-07-09 | Amazon CloudWatch Container Insights enters preview for Amazon ECS and AWS Fargate. Curated metrics and logs summarize performance at the task, container, and service level, with Amazon EKS and Kubernetes support added during the preview. [Source] |
| 2019-07-09 | Amazon CloudWatch Anomaly Detection enters preview. Machine-learning models learn hourly, daily, and weekly patterns to build expected-value bands for metrics and dynamic alarms. [Source] |
| 2019-07-26 | Amazon CloudWatch Logs Insights adds cross-log-group querying. A single query can span up to 20 log groups in an account, making it easier to correlate errors across microservices and multi-tier applications. [Source] |
| 2019-08-30 | Amazon CloudWatch Container Insights becomes generally available. GA extends curated dashboards to Amazon ECS, Amazon EKS, AWS Fargate, and self-managed Kubernetes across cluster, node, pod, and service levels. [Source] |
| 2019-10-17 | Amazon CloudWatch Anomaly Detection becomes generally available. Anomaly-based alarm thresholds adjust dynamically and are accessible via the console, API, CLI, and AWS CloudFormation in all commercial regions. [Source] |
| 2019-11-08 | Amazon CloudWatch launches cross-account, cross-region dashboards. A single dashboard can aggregate metrics, logs, and alarms from multiple accounts and regions, with one-click drill-down. [Source] |
| 2019-11-18 | Amazon CloudWatch launches the Embedded Metric Format (EMF). Custom metrics can be embedded directly in structured log events and extracted automatically, which is especially useful for AWS Lambda functions and containers. [Source] |
| 2019-11-19 | Amazon CloudWatch adds usage metrics integrated with AWS Service Quotas. A SERVICE_QUOTA Metric Math function lets customers alarm before account-level quotas are reached for services such as Amazon EC2, DynamoDB, and AWS KMS. [Source] |
| 2019-11-21 | Amazon CloudWatch ServiceLens becomes generally available. A service map correlates CloudWatch metrics and logs with AWS X-Ray traces so engineers can drill from an unhealthy node to relevant logs and traces. [Source] |
| 2019-11-25 | Amazon CloudWatch Synthetics enters preview. Lightweight canary scripts run on a schedule to monitor endpoints, APIs, and user workflows, catching broken links and latency before customers do. [Source] |
| 2019-11-25 | Amazon CloudWatch Contributor Insights enters preview. Rules analyze structured logs in real time to surface top-N contributors and unique-contributor counts for graphs and alarms. [Source] |
| 2020-03-04 | Amazon CloudWatch Composite Alarms become generally available. Boolean logic (AND, OR, NOT) combines many alarms into a single higher-level alarm to reduce noise, monitoring up to 100 underlying alarms. [Source] |
| 2020-04-02 | Amazon CloudWatch Contributor Insights becomes generally available. Top-contributor analysis from CloudWatch Logs is now available in all regions, with sample rules for Amazon API Gateway, Amazon Route 53, VPC Flow Logs, and Kubernetes. [Source] |
| 2020-04-02 | Amazon CloudWatch Contributor Insights for Amazon DynamoDB becomes generally available. Table owners can see the most-accessed and most-throttled partition keys in real time to identify hot-key patterns. [Source] |
| 2020-04-16 | Amazon CloudWatch Synthetics adds monitoring of private endpoints inside a VPC. Canaries can run within a customer VPC to monitor internal microservices and private APIs that are not publicly reachable. [Source] |
| 2020-04-23 | Amazon CloudWatch Synthetics becomes generally available. Canaries run as often as once per minute and capture screenshots, HTTP archive files, and logs for each run, launching in 16 regions. [Source] |
| 2020-05-05 | Amazon CloudWatch begins collecting Prometheus metrics in beta for Amazon EKS and Kubernetes. The agent auto-discovers Prometheus scrape targets and surfaces their metrics in CloudWatch and Container Insights. [Source] |
| 2020-09-08 | Amazon CloudWatch Prometheus metrics support becomes generally available, adding Amazon ECS and AWS Fargate. Container Prometheus scraping extends across ECS, Fargate, EKS, and self-managed Kubernetes with single-command setup. [Source] |
| 2020-09-14 | Amazon CloudWatch Dashboards add sharing with people outside an AWS account. Dashboards can be shared publicly, with specific credentialed users, or through a third-party SSO provider integrated with Amazon Cognito. [Source] |
| 2020-09-18 | The CloudWatch agent becomes open source and is bundled with Amazon Linux 2. The agent source is published on GitHub and included as a standard package, simplifying deployment on Linux and hybrid servers. [Source] |
| 2020-10-08 | Amazon CloudWatch Lambda Insights enters preview. Automated dashboards summarize system-level performance (CPU, memory, network) and diagnostics such as cold starts for AWS Lambda functions. [Source] |
| 2020-11-04 | Amazon CloudWatch launches Metrics Explorer. A tag-based exploration tool filters and aggregates metrics by resource tags and properties, automatically including new matching resources as they are provisioned. [Source] |
| 2020-12-03 | Amazon CloudWatch Lambda Insights becomes generally available. GA brings multi-function and single-function dashboards to all standard regions with one-click enablement from the Lambda console, CLI, or AWS CloudFormation. [Source] |
| 2021-03-31 | Amazon CloudWatch Metric Streams becomes generally available. Metrics stream continuously to partner tools or to data lakes through Amazon Data Firehose, with OpenTelemetry and JSON output formats. [Source] |
| 2021-05-28 | Amazon CloudWatch Logs adds dimension support for metric filters. Metric filters can extract up to three dimensions from JSON or space-delimited logs, turning log fields into metric dimensions for fine-grained alarming. [Source] |
| 2021-08-05 | Amazon CloudWatch launches cross-account alarms. A monitoring account can create standard and composite alarms on metrics from other accounts, combining Metric Math across accounts with cross-account dashboards. [Source] |
| 2021-08-27 | Amazon CloudWatch Dashboards introduce custom widgets. Custom widgets call any AWS Lambda function and render its HTML or JSON output, enabling bespoke visualizations and action buttons on dashboards. [Source] |
| 2021-11-19 | Amazon CloudWatch Anomaly Detection extends to metric math expressions. Anomaly bands and dynamic alarms can be applied to derived signals such as error rate, not just raw vended metrics. [Source] |
| 2021-11-29 | Amazon CloudWatch Metrics Insights enters preview. A fast SQL-based query engine identifies trends across millions of metrics in real time, with a visual builder and Amazon Managed Grafana integration. [Source] |
| 2021-11-29 | Amazon CloudWatch RUM becomes generally available. Real User Monitoring collects client-side performance, Core Web Vitals, and error data from actual browser sessions, integrated with ServiceLens and AWS X-Ray. [Source] |
| 2021-11-29 | Amazon CloudWatch Evidently becomes generally available. Evidently enables feature flags and A/B experimentation with a statistical engine. AWS later closed Evidently to new customers on October 17, 2024 and ended support on October 16, 2025, recommending AWS AppConfig feature flags as the replacement. [Source] |
| 2022-04-06 | Amazon CloudWatch Metrics Insights becomes generally available. SQL-based metric querying with a visual builder and editor reaches all commercial regions, enabling dynamic fleet-wide aggregations. [Source] |
| 2022-11-27 | Amazon CloudWatch Logs launches data protection. Pattern matching and machine learning detect and mask sensitive data in transit, with policies applied per log group across Logs Insights, metric filters, and subscriptions. [Source] |
| 2022-11-27 | Amazon CloudWatch Internet Monitor enters preview. Internet Monitor uses AWS global network data to give continuous visibility into internet availability and performance between applications and end users. [Source] |
| 2022-11-27 | Amazon CloudWatch cross-account observability is launched. A central monitoring account can search and visualize metrics, logs, and traces from many source accounts in a region, integrated with AWS Organizations. [Source] |
| 2022-12-14 | Amazon CloudWatch launches Metrics Insights alarms. A single SQL-query-backed alarm can monitor an entire fleet, automatically covering new resources as they are provisioned. [Source] |
| 2023-02-27 | Amazon CloudWatch Internet Monitor becomes generally available. GA reduces time to diagnose internet issues from days to minutes, publishing measurements to CloudWatch Logs, CloudWatch metrics, and optionally Amazon S3. [Source] |
| 2023-04-28 | Amazon CloudWatch adds new console visualizations including gauge widgets and time-range comparison graphs. Gauge widgets with color-coded thresholds, side-by-side time-range plotting, and alarm drill-downs to correlated logs and canaries are introduced. [Source] |
| 2023-06-06 | Amazon CloudWatch Logs Live Tail is launched. Live Tail streams log events in real time with filtering and highlighting, useful for validating deployments and diagnosing anomalies. [Source] |
| 2023-06-08 | Amazon CloudWatch Logs adds account-level data protection policies. A single account-level policy masks sensitive data across all existing and future log groups, additive to per-log-group policies. [Source] |
| 2023-10-16 | Amazon CloudWatch launches out-of-the-box alarm recommendations. Best-practice alarm suggestions are shown inline for an initial set of AWS services, with infrastructure-as-code templates available for bulk download. [Source] |
| 2023-11-06 | Amazon CloudWatch Container Insights with enhanced observability for Amazon EKS becomes generally available. It collects container, Kube-state, and EKS control-plane metrics with drill-down across cluster, node, workload, and container layers. [Source] |
| 2023-11-26 | Amazon CloudWatch introduces AI-powered natural language query generation in preview. Generative AI turns plain-English questions into Logs Insights and Metrics Insights queries and explains them line by line. [Source] |
| 2023-11-26 | Amazon CloudWatch Logs anomaly detection and pattern analysis becomes generally available. Machine-learning detectors surface unusual log patterns and frequency changes, and Logs Insights gains Patterns and Compare views. [Source] |
| 2023-11-26 | Amazon CloudWatch Logs introduces the Infrequent Access log class. A lower-cost ingestion tier supports managed ingestion, Logs Insights queries, and cross-account analytics for ad-hoc and forensic logs. [Source] |
| 2023-11-30 | Amazon CloudWatch Application Signals enters preview. Auto-instrumentation (initially Java on Amazon EKS) produces standardized golden metrics, service maps, and SLOs without manual code changes. [Source] |
| 2023-12-22 | Amazon CloudWatch Network Monitor becomes generally available. Agentless synthetic probes measure round-trip time and packet loss for hybrid connectivity over AWS Direct Connect and Site-to-Site VPN. [Source] |
| 2024-01-11 | Amazon CloudWatch Logs launches account-level subscription filters. A single policy can stream all existing and future log groups to Amazon Kinesis, Amazon Data Firehose, or AWS Lambda. [Source] |
| 2024-04-03 | Amazon CloudWatch extends Anomaly Detection across accounts via cross-account observability. A central monitoring account can track anomalous metric behavior across all linked source accounts without switching consoles. [Source] |
| 2024-04-23 | Amazon CloudWatch Container Insights adds accelerated-compute observability for Amazon EKS. Curated dashboards auto-discover health metrics for AWS Trainium, AWS Inferentia, and NVIDIA GPUs to help optimize AI and ML workloads. [Source] |
| 2024-06-10 | Amazon CloudWatch Application Signals becomes generally available. OpenTelemetry-compatible application monitoring for Java, Python, Node.js, and .NET on Amazon EKS, Amazon ECS, and Amazon EC2 surfaces golden signals, correlated traces and logs, and SLO tracking. [Source] |
| 2024-06-10 | Amazon CloudWatch AI-powered natural language query generation becomes generally available. Plain-English query generation for Logs Insights and Metrics Insights reaches general availability. [Source] |
| 2024-09-06 | Amazon CloudWatch Application Signals adds request-based Service Level Objectives. Request-based SLOs measure the fraction of good or bad requests, giving finer error-budget tracking for services with highly variable traffic. [Source] |
| 2024-11-21 | Amazon CloudWatch Application Signals adds application monitoring for AWS Lambda. ADOT Lambda layers auto-instrument Python and Node.js functions to show throughput, availability, latency, faults, and errors. [Source] |
| 2024-11-21 | Amazon CloudWatch Logs adds field indexes and enhanced multi-account log-group selection. Field indexes accelerate filter queries automatically, and Logs Insights queries can span thousands of log groups across accounts. [Source] |
| 2024-11-21 | Amazon CloudWatch Logs adds log transformation and enrichment. Log transformers convert heterogeneous formats into consistent JSON using prebuilt templates or custom Grok parsers at the log-group level. [Source] |
| 2024-11-22 | Amazon CloudWatch Application Signals enables OpenTelemetry trace ingestion via the AWS X-Ray OTLP endpoint. Applications using OpenTelemetry SDKs can send traces directly to unlock Application Signals dashboards and correlated spans. [Source] |
| 2024-12-01 | Amazon CloudWatch Container Insights with enhanced observability for Amazon ECS becomes generally available. Detailed metrics from cluster to container level cover Amazon ECS on EC2 and AWS Fargate, with cross-account support and Application Signals integration. [Source] |
| 2024-12-01 | Amazon CloudWatch Database Insights becomes generally available. A unified database observability experience covers Amazon Aurora and Amazon RDS fleets with prebuilt dashboards, recommended alarms, and guided root-cause analysis. [Source] |
| 2024-12-01 | Amazon CloudWatch launches Network Flow Monitor. eBPF-based agents capture TCP round-trip time, retransmissions, and throughput between Amazon EC2 and Amazon EKS workloads and AWS services, with a Network Health Indicator. [Source] |
| 2024-12-01 | Amazon CloudWatch and Amazon OpenSearch Service launch a zero-ETL integrated analytics experience for logs. CloudWatch Logs can be analyzed in place with PPL and OpenSearch SQL, with curated dashboards for VPC Flow Logs, AWS CloudTrail, and AWS WAF. [Source] |
| 2024-12-03 | Amazon Q Developer operational investigations enters preview, later becoming Amazon CloudWatch investigations. An AI assistant scans CloudWatch telemetry, AWS CloudTrail, and configuration changes to surface anomalies, root-cause hypotheses, and remediation suggestions. [Source] |
| 2025-02-14 | AWS Lambda adds application monitoring for Java and .NET runtimes via CloudWatch Application Signals. One-click enablement extends serverless application monitoring to Java and .NET managed runtimes. [Source] |
| 2025-02-24 | Amazon CloudWatch Database Insights adds support for Amazon RDS databases. Coverage expands from Amazon Aurora to Amazon RDS for MySQL, MariaDB, PostgreSQL, SQL Server, and Oracle, with unified dashboards and recommended alarms. [Source] |
| 2025-02-27 | Amazon CloudWatch Application Signals adds multi-account monitoring. Using CloudWatch Observability Access Manager, teams can view services and Service Level Objectives across linked accounts from one monitoring account. [Source] |
| 2025-06-24 | Amazon CloudWatch investigations becomes generally available. The AI-powered investigation assistant, integrated into CloudWatch and into Slack and Microsoft Teams, identifies anomalies, related signals, and remediation steps. [Source] |
| 2025-07-16 | Amazon CloudWatch adds generative AI observability in preview. End-to-end prompt tracing, curated metrics and logs, and agent-fleet dashboards help diagnose generative-AI applications, including Amazon Bedrock AgentCore, with LangChain and LangGraph support. [Source] |
| 2025-09-17 | Amazon CloudWatch launches cross-account and cross-region log centralization. Log data from many accounts and regions can be copied into a single destination account through a configuration-based approach integrated with AWS Organizations. [Source] |
| 2025-10-13 | Amazon CloudWatch generative AI observability becomes generally available. GA expands coverage across Amazon Bedrock AgentCore components, with out-of-the-box views of latency, token usage, and errors for AI workloads. [Source] |
| 2025-11-19 | Amazon CloudWatch RUM adds support for iOS and Android mobile applications. Using OpenTelemetry, RUM captures screen load times, crashes, app-hang events, and API latencies, integrated with Application Signals for end-to-end tracing. [Source] |
| 2025-11-19 | Amazon CloudWatch Logs Insights adds scheduled queries. Logs Insights queries can run automatically on a defined schedule, with results delivered for recurring reporting and monitoring without manual execution. [Source] |
| 2025-11-20 | Amazon CloudWatch Application Signals adds un-instrumented service discovery to the application map. The application map can automatically surface dependencies that have not been instrumented, giving a more complete topology of a distributed application. [Source] |
| 2025-11-21 | Amazon CloudWatch Database Insights adds cross-account and cross-Region monitoring. Database fleets spanning multiple accounts and Regions can be monitored from a single monitoring account. [Source] |
| 2025-11-21 | Amazon CloudWatch Container Insights adds sub-minute GPU metrics for Amazon EKS. High-resolution GPU utilization metrics help optimize AI and ML training and inference workloads running on Amazon EKS. [Source] |
| 2025-11-21 | Amazon CloudWatch introduces in-console CloudWatch agent management for Amazon EC2. The CloudWatch agent can be installed, configured, and managed directly from the console, simplifying telemetry setup on EC2 instances. [Source] |
| 2025-11-26 | Amazon CloudWatch Logs adds deletion protection for log groups. Deletion protection prevents accidental or unauthorized deletion of log groups, helping preserve audit and operational data. [Source] |
| 2025-11-30 | Amazon CloudWatch investigations adds Five Whys analysis to incident reports. At the end of an investigation, CloudWatch automatically generates a structured incident report documenting the timeline, findings, and a Five Whys analysis that traces an issue from its symptoms to its root cause. [Source] |
| 2025-12-02 | Amazon CloudWatch launches unified management and analytics for operational, security, and compliance data. CloudWatch telemetry pipelines collect, transform, enrich, and route logs across accounts and Regions with built-in support for open standards such as OCSF and Apache Iceberg, centralizing logs into managed Amazon S3 tables that can be queried in place. [Source] |
| 2025-12-02 | Amazon CloudWatch generative AI observability adds support for Amazon Bedrock AgentCore Evaluations. Automated quality scoring with pre-built evaluators assesses AI agent behavior across dimensions such as helpfulness, tool selection, and goal completion, with results surfaced in CloudWatch dashboards. [Source] |
| 2025-12-05 | Amazon CloudWatch simplifies enablement of AWS CloudTrail events. A streamlined workflow using service-linked channels collects CloudTrail management events into CloudWatch without configuring a separate trail or Amazon S3 bucket. [Source] |
| 2025-12-30 | Amazon CloudWatch adds simplified import of AWS CloudTrail Lake data. Historical event data from CloudTrail Lake can be imported into CloudWatch in a few steps via the console, CLI, or SDK, consolidating historical audit and operational data for analysis. [Source] |
| 2026-02-10 | Amazon CloudWatch launches Alarm Mute Rules. One-time or recurring mute schedules can suppress notifications and actions for up to 100 alarms each during planned maintenance, deployments, or known issues, while preserving alarm state and history. [Source] |
| 2026-02-26 | Amazon CloudWatch Database Insights adds lock contention diagnostics for Amazon RDS for PostgreSQL. Blocking and blocked sessions are visualized with up to 15 months of history, so both ongoing and historical lock contention can be analyzed without reproducing the issue. [Source] |
| 2026-02-26 | Amazon CloudWatch Application Signals becomes enabled by default in the CloudWatch Observability EKS add-on. Starting with version 5.0.0 of the add-on, application performance monitoring is turned on automatically when the add-on is installed or updated, with no manual configuration. [Source] |
| 2026-03-09 | Amazon CloudWatch Logs increases Logs Insights query concurrency and API limits. The concurrent query limit rises from 30 to 100, and StartQuery and GetQueryResults rate limits increase, enabling larger teams and more dashboards to run log analytics simultaneously. [Source] |
| 2026-03-13 | Amazon CloudWatch Application Signals adds new Service Level Objective capabilities. SLO recommendations analyze historical latency and availability to suggest targets, service-level SLOs aggregate reliability across all operations of a service, and an SLO performance report provides calendar-aligned historical analysis. [Source] |
| 2026-03-16 | Amazon CloudWatch Logs adds HTTP-based log ingestion endpoints, including an OpenTelemetry (OTLP/HTTP) endpoint. Logs can be sent directly over HTTP — through the HTTP Log Collector (HLC), newline-delimited JSON, structured JSON, or the OpenTelemetry OTLP endpoint — without custom agents or SDKs, using SigV4 or bearer-token authentication. [Source] |
| 2026-03-16 | Amazon CloudWatch introduces organization-wide enablement of Amazon EC2 detailed monitoring. Enablement rules can turn on one-minute EC2 metrics by organizational unit, account, or tag, and automatically apply to newly launched instances. [Source] |
| 2026-03-27 | Amazon CloudWatch Logs adds data protection and OpenSearch PPL and SQL to the Infrequent Access log class. Sensitive-data masking and the OpenSearch PPL and SQL query languages extend the lower-cost Infrequent Access class with capabilities previously limited to the Standard class. [Source] |
| 2026-03-30 | Amazon CloudWatch adds multi-account and multi-Region log centralization based on data source. Centralization rules can target logs by data source type, such as VPC Flow Logs, Amazon EKS audit logs, or AWS CloudTrail, gathering them from across an AWS Organization into a central account without listing individual log groups. [Source] |
| 2026-03-31 | Amazon CloudWatch Logs Insights introduces the lookup query command. The lookup command enriches query results by joining them with reference data from a CSV file at query time, mapping values such as account IDs or error codes to human-readable context without preprocessing logs. [Source] |
| 2026-03-31 | Amazon CloudWatch adds ingestion of AWS Security Hub CSPM findings with organization-wide enablement. Cloud Security Posture Management findings can be collected in OCSF format through CloudWatch telemetry pipelines and routed across accounts for unified security analysis alongside operational data. [Source] |
| 2026-04-02 | Amazon CloudWatch supports OpenTelemetry metrics in public preview. Metrics can be sent directly using the OTLP protocol without custom conversion, preserving dimensions and metadata, and queried alongside existing CloudWatch metrics. [Source] |
| 2026-04-02 | Amazon CloudWatch launches OpenTelemetry Container Insights for Amazon EKS in preview. Curated container metrics are collected through OpenTelemetry and enriched with descriptive metadata labels for Kubernetes resources, enabling richer filtering and analysis of cluster performance. [Source] |
| 2026-04-03 | Amazon CloudWatch introduces PromQL querying with Query Studio in preview. Query Studio provides an interactive, guided workspace for authoring and visualizing PromQL queries against CloudWatch metrics. [Source] |
| 2026-04-10 | Amazon CloudWatch telemetry pipelines add conditional processing and a drop-events processor. Processors can be applied conditionally based on log content, and unwanted events can be dropped during ingestion, giving finer control over how logs are transformed and which events are retained. [Source] |
| 2026-04-16 | Amazon CloudWatch adds cross-Region telemetry auditing and enablement rules. A central account can audit telemetry configurations across Regions, identify resources missing required telemetry, and apply enablement rules consistently across Regions and accounts. [Source] |
| 2026-04-20 | Amazon CloudWatch Logs Insights introduces JOIN and sub-query commands. Results from multiple queries can be joined and sub-queries used to correlate data across log groups within a single query, enabling more sophisticated analytics. [Source] |
| 2026-04-21 | Amazon CloudWatch telemetry pipelines add AI-assisted processor configuration. A transformation described in natural language is turned into a processor configuration along with a sample event for verification before deployment. [Source] |
| 2026-04-29 | Amazon CloudWatch adds a visual agent configuration experience to the Amazon EC2 console. CloudWatch agent metrics and log collection can be configured visually without editing JSON, then deployed to instances or fleets using tags. [Source] |
| 2026-05-01 | Amazon CloudWatch RUM adds Session Replay for web applications. Session Replay provides a video-like reconstruction of real user sessions to diagnose frontend issues, with support for masking sensitive content during capture. [Source] |
| 2026-05-04 | Amazon CloudWatch Logs Insights supports querying by log group tags. A query can be scoped to log groups that share tag key-value pairs, and the selection updates automatically as tags change, removing the need to list log groups individually. [Source] |
| 2026-05-15 | Amazon CloudWatch Logs increases the Logs Insights query result limit to 100,000 rows. The maximum result limit rises from 10,000 to 100,000 rows, and the GetQueryResults API supports pagination to retrieve large result sets. [Source] |
| 2026-05-21 | Amazon CloudWatch Logs Insights adds new query commands and functions. New commands and string, mathematical, and conditional functions expand the ability to transform and analyze log data within Logs Insights queries. [Source] |
| 2026-06-08 | Amazon CloudWatch Logs Insights adds 23 query commands and functions and supports limit any N. The additions include hash, string, conditional, conversion, IP, analytics, and parse functions, and queries can use up to 10 stats commands and limit any N, which the announcement describes as a way "to fetch the first N results" (the user guide says the returned events may come from any portion of the time range). [Source] |
| 2026-06-15 | Amazon CloudWatch introduces Log Analytics. Log Analytics is a console experience that brings Logs Insights, Live Tail, and Contributor Insights together in one place and lets you run multiple queries in different tabs. It is the default experience, and customers who opt out see Logs Insights, Live Tail, and Contributor Insights alongside Log Analytics. [Source] |
| 2026-09-23 | Amazon CloudWatch Omni becomes generally available. The user guide describes Omni as an interface and set of workflows built on Amazon CloudWatch and states that it is not a replacement: existing console pages, metrics, alarms, dashboards, Logs Insights queries, and APIs keep working unchanged, and telemetry from multiple accounts reaches Omni through CloudWatch centralization rules rather than through Omni itself. What creating a space turns on in CloudWatch, and what Omni adds with domains, spaces, and grants, are covered in Amazon CloudWatch Omni and CloudWatch. [Source] |
| 2026-09-29 | Amazon CloudWatch Logs automatically indexes frequently queried fields. CloudWatch Logs identifies the fields used for filtering with the = and IN operations and indexes them automatically. Automatically indexed fields do not count toward the 20-field-per-log-group limit and are retained for 30 days, and a field can be promoted to a field index policy to keep it indexed permanently. What decides how much a query scans, which shortcuts can change the result, and where the scan shows up are covered in What Decides How Much a CloudWatch Logs Insights Query Scans - What You Choose, What CloudWatch Logs Indexes for You, What Can Change the Result, and Where Each Shows Up. [Source] |
| 2026-09-29 | Amazon CloudWatch Logs Insights can estimate bytes scanned before a query runs. The estimate command estimates the volume of log data, in bytes, that a query would scan over the selected log groups and time range without running the query. In the console the estimate appears automatically in the query editor; with the AWS CLI or API, you append the estimate command to the query. [Source] |
Current Overview, Functions, Features of Amazon CloudWatch
Amazon CloudWatch is a unified monitoring and observability service for AWS, hybrid, and on-premises environments. It collects three primary kinds of telemetry — metrics, logs, and (through its integration with AWS X-Ray) traces — and turns them into dashboards, alarms, automated actions, and increasingly AI-assisted insights. The sections below summarize what CloudWatch offers as of this writing.Amazon CloudWatch Use Cases
- Infrastructure and resource monitoring — Track CPU, memory, disk, network, and status-check metrics for Amazon EC2 instances, containers, databases, load balancers, and dozens of other AWS resources from a single pane of glass.
- Application performance monitoring — Use Application Signals to automatically discover services, measure golden signals (latency, traffic, errors, faults), and track Service Level Objectives (SLOs) without manual instrumentation.
- Centralized logging and log analytics — Aggregate logs from many sources into log groups, then search and analyze them interactively with Logs Insights or in real time with Live Tail.
- Alerting and automated remediation — Define alarms (including composite and metric-math alarms) that notify teams through Amazon SNS or trigger automated actions such as Auto Scaling, Amazon EC2 recovery, or AWS Systems Manager runbooks.
- Proactive and synthetic monitoring — Run synthetic canaries against endpoints and user workflows, and measure real user experience in browsers and mobile apps before customers report problems.
- Cross-account, fleet-wide observability — Centralize metrics, logs, and traces from many accounts into a single monitoring account that is integrated with AWS Organizations.
- Cost and capacity visibility for operations — Visualize utilization trends to right-size resources and plan capacity (cost figures are managed through AWS Billing and the official pricing pages, not in this article).
Specific Examples of Use Cases
- Automatically stopping or recovering an Amazon EC2 instance when a status check fails or utilization stays low for a sustained period.
- Counting error patterns in application logs with metric filters and alarming when the rate spikes.
- Building a single dashboard that overlays application latency, error rate, and infrastructure metrics, then sharing it with stakeholders who do not have AWS accounts.
- Running a canary every minute that signs in to a web application and verifies a checkout flow, capturing a screenshot and HAR file whenever it fails.
- Detecting anomalous metric behavior with machine-learning baselines instead of static thresholds.
- Querying terabytes of logs in seconds to investigate an incident, then asking a natural-language question to have CloudWatch generate the query.
- Diagnosing whether a network slowdown originates inside the AWS network or in a hybrid link by using Internet Monitor, Network Monitor, and Network Flow Monitor.
Amazon CloudWatch Key Functions and Features
Monitoring (Metrics):- Standard and custom metrics — Built-in metrics from AWS services, plus custom metrics published via the PutMetricData API. High-resolution metrics support 1-second granularity.
- Detailed monitoring — 1-minute (or finer) metric resolution as an upgrade from the free 5-minute basic monitoring.
- Metric Math and Metrics Insights — Compose new time series from arithmetic and statistical expressions, and run SQL-style queries across millions of metrics in real time.
- Anomaly Detection — Machine-learning models build expected-value bands and power dynamic alarms.
- Metric Streams — Continuously stream metrics to partners or data lakes via Amazon Data Firehose, with OpenTelemetry and JSON formats.
- OpenTelemetry metrics and PromQL — Ingest metrics directly over the OpenTelemetry (OTLP) protocol and query metrics with PromQL through Query Studio (generally available since 2026-06-15).
- Log groups and log streams — Durable, searchable storage of system, application, and AWS service logs, with configurable retention and AWS KMS encryption.
- Logs Insights — A purpose-built query language for fast, interactive log analytics, with Patterns and Compare views and AI-assisted query generation.
- Live Tail — Real-time, interactive viewing of log events as they are ingested.
- Metric filters and subscription filters — Turn log patterns into metrics, or stream logs to AWS Lambda, Amazon Kinesis, and Amazon Data Firehose, including account-level policies.
- Data protection and log classes — Automatically detect and mask sensitive data, and choose the Standard or Infrequent Access log class per log group.
- Telemetry pipelines and unified log management — Collect, transform, enrich, and route logs across accounts and Regions, normalize to open standards such as OCSF, and centralize into managed Amazon S3 tables (Apache Iceberg) for query-in-place analytics.
- Metric, composite, and Metrics Insights alarms — Threshold, anomaly-detection, math-expression, Boolean-combined, and SQL-query-backed alarms.
- Alarm actions — Notify via Amazon SNS, or trigger Auto Scaling, Amazon EC2 stop/terminate/reboot/recover, and AWS Systems Manager actions.
- Alarm Mute Rules — Temporarily suppress alarm notifications and actions on a one-time or recurring schedule during maintenance or deployments, while preserving alarm state.
- Container Insights — Curated metrics, logs, and dashboards for Amazon ECS, Amazon EKS, AWS Fargate, and Kubernetes, with an enhanced-observability mode.
- Lambda Insights — System-level performance and diagnostics for AWS Lambda functions.
- Contributor Insights — Real-time top-N contributor analysis from structured logs.
- Database Insights — Unified observability for Amazon Aurora and Amazon RDS fleets.
- Application Signals — OpenTelemetry-compatible application monitoring that auto-instruments applications on Amazon EKS, Amazon ECS, Amazon EC2, and AWS Lambda, with service maps and SLOs.
- Synthetics — Canary scripts that proactively probe endpoints and user journeys.
- RUM (Real User Monitoring) — Client-side performance and error data from real web and mobile sessions.
- Internet Monitor, Network Monitor, and Network Flow Monitor — Visibility into internet, hybrid, and workload network performance.
- Investigations — AI-assisted operational investigations that correlate telemetry to surface root-cause hypotheses and remediation steps.
- Amazon EventBridge evolved from Amazon CloudWatch Events, which launched in January 2016 to route resource-change and scheduled events to targets. AWS rebranded and extended it as Amazon EventBridge in July 2019. For the full event-bus story, see the Amazon EventBridge timeline.
- AWS X-Ray provides distributed tracing. CloudWatch integrates X-Ray traces through ServiceLens and Application Signals, so metrics, logs, and traces can be correlated in one place. The boundaries between these services, plus OpenTelemetry concepts, are explained in the AWS Observability Glossary.
Tech Blog with curated related content
AWS Documentation (Amazon CloudWatch User Guide)
AWS Documentation (Amazon CloudWatch Logs User Guide)
AWS Documentation (Amazon CloudWatch Application Signals)
Frequently Asked Questions about Amazon CloudWatch History
When did Amazon CloudWatch launch?Amazon CloudWatch was announced on May 17, 2009, alongside Auto Scaling and Elastic Load Balancing, initially providing basic Amazon EC2 instance metrics.
When did CloudWatch get custom metrics and alarms?
Alarms with Amazon SNS notifications and Auto Scaling actions were part of the original 2009 release, and custom metrics (the PutMetricData API) arrived on May 10, 2011. Basic monitoring became free for all Amazon EC2 instances on December 3, 2010.
When did CloudWatch Logs launch?
Amazon CloudWatch Logs was introduced on July 10, 2014, enabling near-real-time collection, storage, and search of log files.
When did CloudWatch Dashboards launch?
Custom CloudWatch Dashboards launched on October 8, 2015; a programmatic API and AWS CloudFormation support followed on July 5, 2017.
When did CloudWatch Logs Insights launch?
Amazon CloudWatch Logs Insights became generally available on November 27, 2018, at AWS re:Invent.
When did Container Insights and Lambda Insights launch?
Container Insights entered preview on July 9, 2019, and reached general availability on August 30, 2019. Lambda Insights entered preview on October 8, 2020, and reached GA on December 3, 2020.
When did CloudWatch Synthetics and RUM launch?
Synthetics entered preview on November 25, 2019, and reached GA on April 23, 2020. CloudWatch RUM became generally available on November 29, 2021, and added iOS and Android mobile support on November 19, 2025.
When did CloudWatch cross-account observability launch?
Amazon CloudWatch cross-account observability launched on November 27, 2022.
When did Application Signals launch?
Application Signals entered preview on November 30, 2023, and became generally available on June 10, 2024.
How does CloudWatch relate to Amazon EventBridge and AWS X-Ray?
EventBridge began as Amazon CloudWatch Events (launched January 2016) before being rebranded in July 2019. AWS X-Ray provides distributed tracing that CloudWatch surfaces through ServiceLens and Application Signals, allowing metrics, logs, and traces to be correlated together.
Summary
Amazon CloudWatch has grown from a single-purpose Amazon EC2 monitoring feature in 2009 into AWS's central observability platform, layering on logs (2014), dashboards (2015), event routing (2016, later spun out as Amazon EventBridge), Logs Insights (2018), container and Lambda insights (2019–2020), synthetic and real user monitoring (2019–2021), cross-account observability (2022), Application Signals (2023–2024), AI-assisted investigations (2024–2025), and unified telemetry pipelines with OpenTelemetry ingestion and PromQL querying (2025–2026). Read end to end, the timeline shows a clear arc: from measuring infrastructure toward understanding applications and user experience, and from static thresholds toward machine-learning and generative-AI–assisted operations.For the broader context of how CloudWatch fits among all AWS services, see the master AWS History and Timeline overview. Related individual timelines include Amazon EC2 (whose instances were CloudWatch's very first monitoring target) and Amazon EventBridge (which originated as CloudWatch Events). To go deeper on terminology and queries, see the AWS Observability Glossary and the CloudWatch Logs Insights Query Cookbook. For the industry-side lineage of the instrumentation standard CloudWatch now ingests — two competing vendor-neutral specifications, the foundation merger that ended the split, and the AWS X-Ray SDK and daemon moving to maintenance while the X-Ray service itself stayed fully supported — see Observability and OpenTelemetry History and Timeline.
This timeline will be updated as Amazon CloudWatch continues to evolve.
References:
AWS Documentation (Amazon CloudWatch Documentation)
AWS Documentation (Document history for the Amazon CloudWatch User Guide)
AWS Documentation (Document history for the Amazon CloudWatch Logs User Guide)
What's New with AWS?
AWS News Blog
References:
Tech Blog with curated related content
Written by Hidekazu Konishi