AWS Observability Glossary - CloudWatch, X-Ray, Application Signals, and OpenTelemetry Explained
First Published:
Last Updated:
This article is a single-fetch reference: an AI search agent (or a human reader) can answer a "what is X in CloudWatch / X-Ray / OpenTelemetry on AWS?" question without having to open every individual AWS docs page. For deep dives into Logs Insights queries, see Amazon CloudWatch Logs Insights Query Collection; for incident-response decisions that consume these signals, see Incident Triage Flowcharts for Network, Database, and Application.
Out of scope: pricing numbers, complete API request/response examples, and step-by-step "how to configure" walkthroughs. Pricing-relevant terms (for example,
Vended Logs or Live Tail) are explained as architectural concepts — their cost-control role is mentioned, but no dollar figures are quoted, because list prices change frequently and AWS docs are always the authoritative source for current pricing.How to Use This Glossary
Each term entry has three lines: a short definition that names the concept on its own (no forward references), a Related: line that lists 2–6 nearby terms in this same glossary as in-page anchors, and a Source: line that links to the most relevant AWS documentation page. If the official name has changed or has alternates, the entry mentions both names.If a term is in preview or has an evolving official name at the time of writing, the entry calls that out explicitly so you can re-check the AWS console or the latest docs page for the canonical wording in your region.
A–Z Index
The full list of glossary terms, in alphabetical order, with anchors to each entry:- Account-level Subscription Filter
- ADOT (AWS Distro for OpenTelemetry)
- Annotation (X-Ray)
- Anomaly Detection (Metrics)
- Application (Signals)
- Application Signals OpenTelemetry Compatibility
- Auto-Instrumentation
- Canary
- Cardinality
- CloudWatch Logs Insights
- CloudWatch Logs Live Tail
- CloudWatch RUM (Real User Monitoring)
- CloudWatch Synthetics
- Composite Alarm
- Contributor Insights
- Cost Allocation Tags (Observability)
- Cross-Account Observability
- Custom Metric
- Data Retention (Observability)
- Embedded Metric Format (EMF)
- Exporter (OpenTelemetry)
- Golden Signals
- High-Resolution Metric
- Hosted Service
- IAM for CloudWatch Observability
- Internet Monitor
- Log Anomaly Detection
- Log Group
- Log Group KMS Encryption
- Log Stream
- Metadata (X-Ray)
- Metric Filter
- Metric Math
- Metric Stream
- Network Synthetic Monitor
- OpenTelemetry Collector
- OpenTelemetry SDK
- Operation (Signals)
- Pillars of Observability
- Processor (OpenTelemetry)
- Receiver (OpenTelemetry)
- Resource (OpenTelemetry)
- Retention Policy
- Sampling (X-Ray)
- Sampling Rule
- Segment
- Service (Signals)
- Service Map
- SLI (Service Level Indicator)
- SLO (Service Level Objective)
- SLO Burn Rate
- Span (and Span Event)
- Standard Metric
- Subscription Filter
- Subsegment
- Trace
- Transaction Search
- Vended Logs
- W3C Trace Context
- X-Ray Trace ID
AWS Observability Stack (Visual Reference)
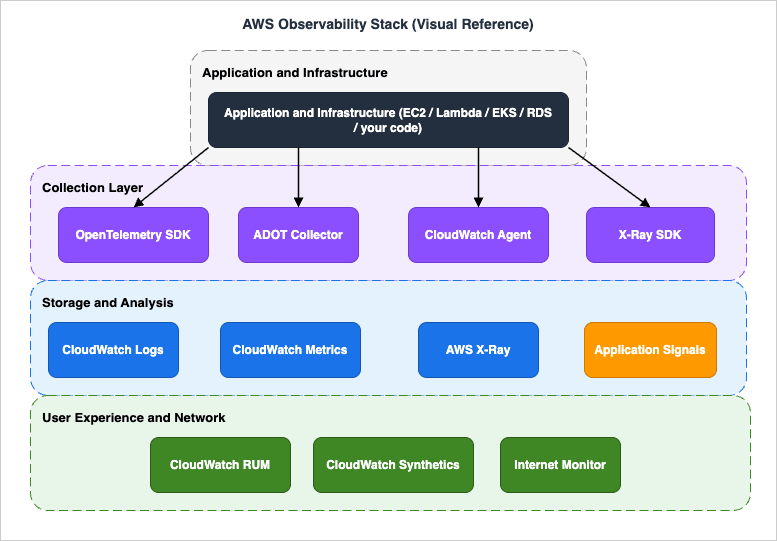
The diagram is a one-page reference for how the terms in this glossary fit together: the Application and Infrastructure layer at the top is the source of telemetry; the Collection Layer in the middle (OpenTelemetry SDK, ADOT Collector, CloudWatch Agent, X-Ray SDK) receives, processes, and forwards that telemetry; the Storage and Analysis layer (CloudWatch Logs, CloudWatch Metrics, AWS X-Ray, Application Signals) is the queryable destination; and User Experience and Network (RUM, Synthetics, Internet Monitor) sits at the bottom as the user-facing complement to server-side telemetry.
A. Metrics (CloudWatch)
Standard Metric
A Standard Metric is a CloudWatch metric sampled at the default resolution of one minute, suitable for most service-level monitoring. CloudWatch publishes standard metrics from supported AWS services (Lambda, EC2, ELB, RDS, etc.) automatically, and you can also publish them from your own application via thePutMetricData API.Related: Custom Metric · High-Resolution Metric · Metric Math · Metric Stream
Source: Using Amazon CloudWatch metrics — AWS Docs
Custom Metric
A Custom Metric is a CloudWatch metric that your application emits viaPutMetricData (or via Embedded Metric Format, StatsD, or the CloudWatch Agent), as opposed to a metric that AWS publishes for you. Custom metrics are the standard way to expose application-level KPIs (queue depth, business events, model inference latency) alongside infrastructure metrics.Related: Standard Metric · Embedded Metric Format (EMF) · Metric Math · High-Resolution Metric
Source: Publishing custom metrics — AWS Docs
High-Resolution Metric
A High-Resolution Metric is a CloudWatch custom metric with sub-minute granularity (down to one second). It is requested atPutMetricData time by setting StorageResolution=1, and is the right choice when you need to alarm on bursty signals shorter than one minute.Related: Standard Metric · Custom Metric · Anomaly Detection (Metrics) · Composite Alarm
Source: High-resolution metrics — AWS Docs
Metric Math
Metric Math is the CloudWatch expression language for deriving new time series from existing metrics — for example,SUM(m1,m2), RATE(m1), SEARCH(...), or anomaly-detection bands. Metric Math expressions can drive dashboards and alarms without writing custom code to pre-aggregate.Related: Anomaly Detection (Metrics) · Composite Alarm · Custom Metric · Standard Metric
Source: Using metric math — AWS Docs
Metric Stream
A Metric Stream is a near-real-time push of CloudWatch metrics to a destination (Amazon Data Firehose to S3, OpenSearch, or third-party SaaS) in either theopentelemetry1.0 format or the json format. It is the supported way to mirror metrics into an external observability backend without polling GetMetricData.Related: Standard Metric · Embedded Metric Format (EMF) · Vended Logs
Source: CloudWatch Metric Streams — AWS Docs
Embedded Metric Format (EMF)
Embedded Metric Format is a structured JSON log format that lets your application emit metrics and log lines together in a single payload — CloudWatch Logs extracts the metric values automatically into CloudWatch Metrics without an additionalPutMetricData call. EMF is the canonical pattern for Lambda metric emission because it requires no extra network round trip.Related: Custom Metric · Metric Filter · CloudWatch Logs Insights · Vended Logs
Source: CloudWatch Embedded Metric Format — AWS Docs
Anomaly Detection (Metrics)
Anomaly Detection is a CloudWatch feature that builds a statistical model of a metric's expected behavior and exposes upper and lower expected bands as Metric Math functions, which you can alarm on. It replaces hand-tuned thresholds for seasonal or trending metrics where a fixed value would either alert too often or miss real regressions.Related: Metric Math · Composite Alarm · Standard Metric · Log Anomaly Detection
Source: CloudWatch Anomaly Detection — AWS Docs
Composite Alarm
A Composite Alarm is a CloudWatch alarm whose state is computed from a Boolean expression over other alarms (for example,ALARM("a") AND NOT OK("b")). It is the standard way to suppress noisy alarms during planned maintenance and to combine related signals into a single page.Related: Anomaly Detection (Metrics) · Metric Math · Metric Filter
Source: Creating a composite alarm — AWS Docs
Metric Filter
A Metric Filter is a CloudWatch Logs feature that scans log events as they arrive in a Log Group and emits a CloudWatch metric (typically a count or sum extracted by a regex or JSON pattern). Metric Filters are the simplest way to turn an existing log line into an alarmable metric without modifying the application.Related: Log Group · Embedded Metric Format (EMF) · Custom Metric · Subscription Filter
Source: Creating metric filters — AWS Docs
B. Logs (CloudWatch Logs)
Log Group
A Log Group is the top-level container in CloudWatch Logs for log events that share the same retention, KMS encryption, metric-filter, and subscription-filter configuration. Most AWS services that emit logs (Lambda, API Gateway, VPC Flow Logs, etc.) create or expect a dedicated Log Group per resource or per scope.Related: Log Stream · Retention Policy · Log Group KMS Encryption · Subscription Filter
Source: Working with log groups and log streams — AWS Docs
Log Stream
A Log Stream is a sequence of log events from a single source (a Lambda execution environment, an EC2 instance, a Fargate task) inside a Log Group. Each event has a timestamp and a message; the stream is the unit at which sequence tokens and write ordering apply.Related: Log Group · CloudWatch Logs Live Tail · CloudWatch Logs Insights
Source: Working with log groups and log streams — AWS Docs
Subscription Filter
A Subscription Filter is a CloudWatch Logs configuration that streams matching log events out of a Log Group in real time to a destination — typically Amazon Data Firehose, Lambda, or another account's Kinesis stream. It is the standard mechanism for shipping logs to a SIEM or a data lake without batch export.Related: Account-level Subscription Filter · Log Group · Vended Logs · Metric Filter
Source: Real-time processing of log data with subscriptions — AWS Docs
Account-level Subscription Filter
An Account-level Subscription Filter applies a single Subscription Filter to every Log Group in the account (with include/exclude patterns), instead of attaching one filter per Log Group. Each account can have one such filter per Region, and it is the recommended way to centralize log shipping when new Log Groups can appear at any time.Related: Subscription Filter · Log Group · Cross-Account Observability
Source: Account-level subscription filters — AWS Docs
CloudWatch Logs Insights
CloudWatch Logs Insights is the CloudWatch Logs query language and console for ad-hoc analysis across one or more Log Groups using a fields/filter/stats/sort/limit pipeline. It is the primary tool for incident triage on AWS-native logs, and queries can be saved, parameterized, and embedded in dashboards. For ready-to-use queries see Amazon CloudWatch Logs Insights Query Collection.Related: Log Group · CloudWatch Logs Live Tail · Subscription Filter · Metric Filter
Source: Analyzing log data with CloudWatch Logs Insights — AWS Docs
Vended Logs
Vended Logs are CloudWatch Logs that AWS services publish on your behalf into Log Groups owned by you (for example, VPC Flow Logs, Route 53 query logs, Bedrock model-invocation logs, and AgentCore observability logs). They are billed under a separate vended-logs price dimension and are the canonical channel for service-emitted, customer-readable telemetry. For an example of how a vended-log channel feeds an agent observability pipeline, see Amazon Bedrock AgentCore Implementation Guide — Part 3: Infrastructure.Related: Log Group · Subscription Filter · Transaction Search
Source: Logs sent by AWS services to CloudWatch Logs — AWS Docs
CloudWatch Logs Live Tail
Live Tail is a CloudWatch Logs feature that streams new log events as they arrive in a Log Group (optionally filtered by pattern) to the console or to a CLI subscriber. It is intended for short-duration debugging sessions — billed by session-minute — and complements Logs Insights for offline analysis.Related: Log Group · Log Stream · CloudWatch Logs Insights
Source: Use Live Tail to view logs in near real time — AWS Docs
Log Anomaly Detection
Log Anomaly Detection is a CloudWatch Logs feature that learns a Log Group's normal log patterns and surfaces unusual events (new error templates, sudden rate changes) as anomalies you can inspect or alarm on. It is the log-side counterpart to Anomaly Detection on metrics.Related: Anomaly Detection (Metrics) · Log Group · CloudWatch Logs Insights
Source: CloudWatch Logs Anomaly Detection — AWS Docs
Retention Policy
A Retention Policy is the per-Log-Group setting that controls how long CloudWatch Logs keeps log events before automatic deletion (one day to ten years, or "Never expire"). It is a cost-control lever because storage is billed per ingested GB-month, and retention is the only built-in mechanism to bound that growth.Related: Log Group · Data Retention (Observability) · Vended Logs · Log Group KMS Encryption
Source: Change log data retention in CloudWatch Logs — AWS Docs
Log Group KMS Encryption
Log Group KMS Encryption is the per-Log-Group setting that encrypts log events at rest with a customer-managed KMS key, on top of CloudWatch's default service-managed encryption. It is required by many compliance frameworks and is the only supported way to gate log decryption with a customer-controlled key policy.Related: Log Group · Data Retention (Observability) · IAM for CloudWatch Observability
Source: Encrypt log data in CloudWatch Logs using AWS KMS — AWS Docs
C. Traces (AWS X-Ray)
Trace
A Trace in AWS X-Ray is the complete tree of work performed for a single request as it crosses services — for example, an API Gateway invocation that fans out to Lambda, DynamoDB, and a downstream HTTP service. A trace is identified by a unique X-Ray Trace ID and is composed of one or more Segments and Subsegments.Related: Segment · Subsegment · X-Ray Trace ID · Service Map · W3C Trace Context
Source: AWS X-Ray concepts — AWS Docs
Segment
A Segment is the X-Ray record for the work done by a single service (or instrumented process) within a trace — for example, the Lambda handler's contribution. It carries the service name, start/end times, status, HTTP request info, and any Annotations, Metadata, and Subsegments emitted while it was active.Related: Trace · Subsegment · Annotation (X-Ray) · Metadata (X-Ray)
Source: AWS X-Ray concepts — AWS Docs
Subsegment
A Subsegment is a finer-grained record nested inside a Segment that captures a unit of work the segment performs — typically an outbound AWS API call, an HTTP request, or a user-defined block of code. Subsegments are how you see "the segment took 800 ms, of which 720 ms was the DynamoDB call" on the Service Map and timeline view.Related: Segment · Trace · Service Map
Source: X-Ray segment documents — AWS Docs
Sampling (X-Ray)
Sampling in X-Ray is the decision, made at the start of a request, about whether to record a trace at all — full instrumentation of every request is prohibitively expensive at scale, so X-Ray records a representative subset. The decision is driven by Sampling Rules.Related: Sampling Rule · Trace · Segment · X-Ray Trace ID
Source: Configuring sampling, groups, and encryption settings — AWS Docs
Sampling Rule
A Sampling Rule is a customer-configurable rule that controls X-Ray's per-second reservoir and per-request fixed-rate sampling for matching services, URLs, methods, and hosts. Rules are evaluated in priority order; the first match wins, and a default rule catches anything unmatched.Related: Sampling (X-Ray) · Trace · Service Map
Source: Configuring sampling rules — AWS Docs
X-Ray Trace ID
An X-Ray Trace ID is a 35-character identifier of the form1-<8-hex-epoch>-<24-hex-random> that uniquely names a Trace. It is propagated across services in the HTTP header X-Amzn-Trace-Id (and can be derived from a W3C traceparent when the X-Ray SDK is configured for W3C propagation).Related: Trace · Segment · W3C Trace Context · Sampling (X-Ray)
Source: Tracing header and trace ID format — AWS Docs
W3C Trace Context
W3C Trace Context is the open standard for propagating a 32-hex-chartrace-id and 16-hex-char span-id between services via the traceparent HTTP header. X-Ray and Application Signals support W3C Trace Context so traces can flow between OpenTelemetry-instrumented services and AWS-native services without losing parentage.Related: X-Ray Trace ID · Trace · OpenTelemetry Collector · Application Signals OpenTelemetry Compatibility
Source: W3C Trace Context support in AWS X-Ray — AWS Docs
Service Map
The Service Map is the X-Ray console view that draws a graph of services that emitted segments — each node shows latency, error rate, and throughput aggregated from sampled traces in the selected window. It is the canonical "what depends on what, and where is the latency right now" diagram and is also surfaced inside Application Signals.Related: Trace · Segment · Application (Signals) · Service (Signals)
Source: Viewing the service map — AWS Docs
Annotation (X-Ray)
An Annotation is a key/value pair (string, number, or boolean) attached to a Segment or Subsegment that X-Ray indexes for trace search. Use Annotations for the dimensions you will filter on (user ID, tenant, request type); other attributes belong in Metadata.Related: Metadata (X-Ray) · Segment · Subsegment · Transaction Search
Source: Annotations and metadata in X-Ray — AWS Docs
Metadata (X-Ray)
Metadata is a structured JSON payload attached to a Segment or Subsegment that X-Ray stores but does not index for search. Use Metadata for verbose payload-style context (request bodies, decision rationales, intermediate calculations) that you want available in the trace detail but not in filters.Related: Annotation (X-Ray) · Segment · Subsegment
Source: Annotations and metadata in X-Ray — AWS Docs
Transaction Search
Transaction Search is the X-Ray feature that indexes 100% of the spans you opt in for, so you can query traces by attribute (user ID, error code, custom annotation) without being limited to the sampled subset. It complements regular sampled tracing for incident investigation and is opt-in per indexed attribute.Related: Trace · Sampling (X-Ray) · Annotation (X-Ray) · Vended Logs
Source: X-Ray transaction search — AWS Docs
D. Application Signals
SLO (Service Level Objective)
An SLO is a target for a Service Level Indicator over a defined evaluation window — for example, "p99 checkout latency under 300 ms, measured over a rolling 30 days, target 99%". In CloudWatch Application Signals, an SLO is a first-class resource attached to an Operation or a Service, with a configurable goal, attainment window, and burn-rate alarm hooks.Related: SLI (Service Level Indicator) · SLO Burn Rate · Operation (Signals) · Service (Signals)
Source: Service level objectives in CloudWatch — AWS Docs
SLI (Service Level Indicator)
An SLI is the underlying measurement that an SLO compares against the goal — typically a ratio (good events / valid events) or a latency percentile. In Application Signals, an SLI is automatically computed from Application Signals' standard latency and error metrics, or it can be defined from an arbitrary CloudWatch metric or Metric Math expression.Related: SLO (Service Level Objective) · Operation (Signals) · Standard Metric · Metric Math
Source: Service level indicators in CloudWatch — AWS Docs
Application (Signals)
An Application in Application Signals is the top-level scope (typically a business app or a microservice fleet) that groups one or more Services. It is the unit at which Application Signals' built-in dashboard summarizes "is this app healthy right now?" using latency, error, and availability rollups.Related: Service (Signals) · Operation (Signals) · Hosted Service · Service Map
Source: CloudWatch Application Signals — AWS Docs
Service (Signals)
A Service in Application Signals is an individually deployable component (a Lambda function, an ECS service, an EKS workload) that emits OpenTelemetry-compatible traces and metrics. Application Signals automatically discovers Services and binds their telemetry to a stable Service identity so dashboards and SLOs survive deployments.Related: Application (Signals) · Operation (Signals) · Hosted Service · Auto-Instrumentation
Source: Services in Application Signals — AWS Docs
Operation (Signals)
An Operation in Application Signals is a named unit of work that a Service performs — typically a route, an RPC method, or a span name. Operations are the finest granularity at which Application Signals computes latency and error metrics, and they are the natural object to attach an SLO to.Related: Service (Signals) · SLO (Service Level Objective) · SLI (Service Level Indicator) · Span (and Span Event)
Source: Operations in Application Signals — AWS Docs
Hosted Service
A Hosted Service in Application Signals is the runtime environment that hosts a Service — for example, "Lambda functionfoo", "ECS service bar on Fargate", or "EKS deployment baz in cluster qux". The Hosted Service binds the logical Service identity to the physical resource so you can pivot from an SLO breach to the right console.Related: Service (Signals) · Application (Signals) · Auto-Instrumentation
Source: Hosted Services in Application Signals — AWS Docs
E. OpenTelemetry on AWS
OpenTelemetry Collector
The OpenTelemetry Collector is a vendor-neutral process that receives telemetry from instrumented applications, processes it (batch, filter, attribute, sampler), and exports it to one or more backends. AWS supports the Collector as the recommended ingestion path for traces and metrics into X-Ray, CloudWatch, and Application Signals.Related: Receiver (OpenTelemetry) · Processor (OpenTelemetry) · Exporter (OpenTelemetry) · ADOT (AWS Distro for OpenTelemetry)
Source: Getting started with the AWS Distro for OpenTelemetry Collector
Receiver (OpenTelemetry)
A Receiver is the Collector component that ingests telemetry from a source — for example,otlp (OTLP/gRPC), prometheus, awsxray, awscontainerinsightreceiver. Receivers are configured in the Collector's receivers: block and bound to pipelines in service.pipelines.Related: OpenTelemetry Collector · Processor (OpenTelemetry) · Exporter (OpenTelemetry) · OpenTelemetry SDK
Source: ADOT Collector receivers — AWS Observability
Processor (OpenTelemetry)
A Processor is the Collector component that transforms telemetry between Receivers and Exporters — for example,batch (group spans/metrics), attributes (add/redact fields), tail_sampling (decide retention after the span tree is complete), filter (drop based on conditions). Processors are how you redact PII, sample expensively, or enrich with AWS resource attributes.Related: OpenTelemetry Collector · Receiver (OpenTelemetry) · Exporter (OpenTelemetry) · Sampling (X-Ray)
Source: ADOT Collector processors — AWS Observability
Exporter (OpenTelemetry)
An Exporter is the Collector component that emits processed telemetry to a backend — for example,awsxray (X-Ray), awsemf (CloudWatch via EMF), awscloudwatchlogs, prometheusremotewrite, otlp. A single Collector commonly fans out to multiple Exporters so traces go to X-Ray while metrics go to CloudWatch.Related: OpenTelemetry Collector · Receiver (OpenTelemetry) · Processor (OpenTelemetry) · ADOT (AWS Distro for OpenTelemetry)
Source: ADOT Collector exporters — AWS Observability
Resource (OpenTelemetry)
A Resource in OpenTelemetry is the set of attributes that identify the entity producing telemetry —service.name, service.version, cloud.provider, cloud.region, host.id, aws.ecs.task.arn, etc. AWS Resource Detectors (in the ADOT distribution) populate Resource attributes automatically so traces and metrics carry consistent identity across Lambda, ECS, EKS, and EC2.Related: OpenTelemetry SDK · Auto-Instrumentation · ADOT (AWS Distro for OpenTelemetry) · Span (and Span Event)
Source: ADOT resource detectors — AWS Observability
OpenTelemetry SDK
The OpenTelemetry SDK is the per-language library (Java, Python, Node.js, Go, .NET, etc.) that produces spans, metrics, and log records from your application code. The SDK is configured with a Resource, a sampler, and one or more exporters (typically OTLP to the Collector), and is the layer you call from code paths that need manual instrumentation.Related: OpenTelemetry Collector · Auto-Instrumentation · Resource (OpenTelemetry) · ADOT (AWS Distro for OpenTelemetry)
Source: AWS Distro for OpenTelemetry SDKs — AWS Observability
Auto-Instrumentation
Auto-Instrumentation is the OpenTelemetry technique of patching well-known libraries (HTTP clients, AWS SDK, DB drivers, web frameworks) at startup so spans and metrics are emitted without changing application code. ADOT ships language-specific auto-instrumentation distributions for Java, Python, Node.js, and others, including an agent packaging for Lambda and ECS.Related: OpenTelemetry SDK · ADOT (AWS Distro for OpenTelemetry) · Application Signals OpenTelemetry Compatibility · Span (and Span Event)
Source: ADOT auto-instrumentation getting started — AWS Observability
ADOT (AWS Distro for OpenTelemetry)
ADOT is the AWS-supported distribution of the OpenTelemetry Collector and language SDKs, with AWS-specific exporters, Resource detectors, and security defaults pre-bundled. Using ADOT instead of upstream OpenTelemetry gives you AWS-tested versions and the right wire formats for X-Ray, CloudWatch, and Application Signals out of the box.Related: OpenTelemetry Collector · Exporter (OpenTelemetry) · Auto-Instrumentation · Application Signals OpenTelemetry Compatibility
Source: AWS Distro for OpenTelemetry — AWS Observability
Application Signals OpenTelemetry Compatibility
Application Signals' OpenTelemetry compatibility is the supported configuration that lets ADOT-instrumented spans and metrics populate the Application Signals data model (Service, Operation, latency, error, availability) — turned on by environment variables such as OTEL_AWS_APPLICATION_SIGNALS_ENABLED=true and OTEL_AWS_APPLICATION_SIGNALS_EXPORTER_ENDPOINT. AWS ships ADOT auto-instrumentation for Java, Python, Node.js, and .NET; for runtimes without an ADOT auto-instrumentation distribution (including Go, PHP, and Ruby) the supported path is manual instrumentation with the upstream OpenTelemetry SDKs, and the resulting spans can also be queried via Transaction Search. On Amazon EC2 the CloudWatch agent exposes port 4316 as the local OTLP receiver, so applications point the exporter endpoint at http://localhost:4316/v1/metrics.Related: Application (Signals) · Service (Signals) · ADOT (AWS Distro for OpenTelemetry) · Auto-Instrumentation · Transaction Search
Source: OpenTelemetry compatibility for CloudWatch Application Signals — AWS Docs
Span (and Span Event)
A Span is the OpenTelemetry record of one unit of work (an HTTP request, a function call, a database query), with start/end time, attributes, status, and links to a parent span. A Span Event is a timestamped record attached to a span (for example, "cache miss at t=0.123s"), used for in-span annotations without creating child spans.Related: Trace · Segment · Subsegment · W3C Trace Context · OpenTelemetry SDK
Source: Traces — OpenTelemetry concepts
F. User Experience and Network (RUM / Synthetics / Internet Monitor / Network Synthetic Monitor)
CloudWatch RUM (Real User Monitoring)
CloudWatch RUM is the AWS-managed Real User Monitoring service that collects performance, error, and journey data from a JavaScript snippet running in the end-user's browser. It tells you what real users experience (page load time, JavaScript errors, route transitions) — complementary to server-side metrics and traces.Related: CloudWatch Synthetics · Canary · Internet Monitor · Application (Signals)
Source: CloudWatch RUM — AWS Docs
CloudWatch Synthetics
CloudWatch Synthetics runs scheduled scripted probes (Canaries) against your endpoints from AWS-managed runners, producing latency and success/failure metrics independent of real user traffic. It is the standard way to monitor a critical user flow (sign-in, checkout) end-to-end even when traffic is low.Related: Canary · CloudWatch RUM (Real User Monitoring) · Network Synthetic Monitor · SLO (Service Level Objective)
Source: CloudWatch Synthetics Canaries — AWS Docs
Canary
A Canary is a single Synthetics script (Node.js or Python) that runs on a schedule, executes a user journey (a heartbeat ping, an API call, a recorded Selenium flow), and emits metrics, screenshots, and HAR files into CloudWatch. Each Canary is a separately versioned resource with its own IAM execution role.Related: CloudWatch Synthetics · CloudWatch RUM (Real User Monitoring) · Hosted Service · Network Synthetic Monitor
Source: Creating Canaries — AWS Docs
Internet Monitor
Amazon CloudWatch Internet Monitor measures and surfaces the impact of Internet-side events (ISP outages, peering issues) on your application's availability and latency, using AWS's global network observability data. It tells you "users in this city via this ISP are seeing a 3x latency increase right now" — information not visible from server-side telemetry alone.Related: CloudWatch RUM (Real User Monitoring) · CloudWatch Synthetics · Network Synthetic Monitor
Source: Using Amazon CloudWatch Internet Monitor — AWS Docs
Network Synthetic Monitor
Amazon CloudWatch Network Synthetic Monitor (formerly Network Monitor) is a fully managed service that measures packet loss and latency between an AWS network source (a VPC subnet) and your on-premises destinations using agent-less probes — no software is installed on monitored resources. When the AWS source connects via AWS Direct Connect, the Network Health Indicator (NHI) metric tells you whether degradation is inside the AWS network or outside, and per-probe latency and packet-loss metrics flow into CloudWatch Metrics for dashboards and alarms. It is distinct from CloudWatch Synthetics, which runs application-level Canaries against HTTP/API endpoints.Related: CloudWatch Synthetics · Internet Monitor · Canary · Standard Metric
Source: Using Network Synthetic Monitor — AWS Docs
G. Cross-Cutting Concepts
Golden Signals
The Golden Signals are the four signals popularized by Google SRE for monitoring user-facing services — Latency, Traffic, Errors, and Saturation. They are the recommended starting checklist when you instrument a Service in Application Signals, and they map directly to Application Signals' built-in metrics. For incident-time decision trees that consume these signals, see Incident Triage Flowcharts for Network, Database, and Application.Related: Pillars of Observability · SLI (Service Level Indicator) · SLO (Service Level Objective) · Service (Signals)
Source: Reliability Pillar — AWS Well-Architected Framework
Pillars of Observability
The Pillars of Observability are the three signal types — Logs, Metrics, and Traces — that together let you answer arbitrary questions about a running system. On AWS, the canonical implementations are CloudWatch Logs, CloudWatch Metrics, and AWS X-Ray; OpenTelemetry generalizes all three under a single data model.Related: Golden Signals · Log Group · Standard Metric · Trace · Span (and Span Event)
Source: Amazon CloudWatch concepts — AWS Docs
SLO Burn Rate
SLO Burn Rate is the ratio of the current error rate to the rate that would exactly exhaust the SLO error budget over the attainment window — a burn rate of 1.0 maintained over the full window exactly consumes the budget; a burn rate of 14.4 sustained for one hour consumes 2% of a 30-day budget (14.4 × 1h / 720h), the canonical fast-burn threshold from the Google SRE workbook. Application Signals exposes burn-rate alarms over short and long evaluation windows so you can page on fast burns and ticket on slow burns.Related: SLO (Service Level Objective) · SLI (Service Level Indicator) · Composite Alarm · Anomaly Detection (Metrics)
Source: SLO burn-rate alarms — AWS Docs
Cardinality
Cardinality is the number of distinct label or dimension combinations a metric can take —request_count{customer=...,route=...,status=...} over 10k customers times 100 routes times 5 statuses has cardinality 5 million. High-cardinality metrics are expensive to store and slow to query, so CloudWatch's dimension limits and Contributor Insights' rank-not-store design exist specifically to manage this trade-off.Related: Custom Metric · Contributor Insights · Annotation (X-Ray) · Standard Metric
Source: Dimensions and cardinality in CloudWatch — AWS Docs
Contributor Insights
Contributor Insights is a CloudWatch feature that ranks the top contributors to a metric (top callers, top error sources, top hot keys) by analyzing structured logs or metric streams. It is the standard way to answer "which client is causing this throttle spike?" without writing a custom query each time, and it pairs naturally with high-cardinality data where storing every dimension combination would be prohibitive.Related: Cardinality · CloudWatch Logs Insights · Metric Filter · Custom Metric
Source: CloudWatch Contributor Insights — AWS Docs
Data Retention (Observability)
Data Retention is the policy that controls how long each observability data type is stored before being deleted — CloudWatch Logs retention (per Log Group), CloudWatch Metrics retention (fixed AWS-defined tiers from 1 minute up to 15 months), X-Ray (about 30 days), and Application Signals (per-SLO history). It is the dominant cost-control lever for log-heavy workloads.Related: Retention Policy · Log Group · Vended Logs · Cost Allocation Tags (Observability)
Source: CloudWatch service quotas and retention — AWS Docs
Cross-Account Observability
Cross-Account Observability (CloudWatch's monitoring-account feature) lets a designated monitoring account view metrics, logs, and traces from many source accounts in a single console without the source data being copied. It is the recommended pattern for multi-account AWS organizations — both for ops dashboards and for SOC log review.Related: Account-level Subscription Filter · IAM for CloudWatch Observability · Log Group
Source: CloudWatch Cross-Account Observability — AWS Docs
IAM for CloudWatch Observability
IAM for CloudWatch Observability is the set of IAM identity policies, resource policies, and service-linked roles required for an account or role to (a) emit telemetry (PutMetricData, PutLogEvents, PutTraceSegments) and (b) read it (GetMetricData, FilterLogEvents, GetTraceSummaries). Wiring the right least-privilege policies is the typical first failure mode when a new service "doesn't show up in CloudWatch".Related: Cross-Account Observability · Log Group · Log Group KMS Encryption · Vended Logs
Source: Identity and access management for Amazon CloudWatch — AWS Docs
Cost Allocation Tags (Observability)
Cost Allocation Tags on observability resources (Log Groups, dashboards, alarms, Synthetics canaries) propagate to AWS Cost Explorer and AWS Budgets so observability spend can be attributed by team, environment, or business unit. Tagging Log Groups in particular is the most reliable way to find which team's logs are dominating the bill.Related: Retention Policy · Log Group · Data Retention (Observability) · Cross-Account Observability
Source: Using cost allocation tags — AWS Docs
Frequently Asked Questions
How do Metric Filters and Embedded Metric Format (EMF) differ?
Metric Filters scan existing log events arriving in a Log Group and emit a CloudWatch metric by pattern, without changing the application. EMF requires the application to emit a structured JSON log payload that already declares the metric — CloudWatch Logs extracts it on ingestion. EMF is the better choice when you control the emitter (no extraPutMetricData call, no parse-cost risk); Metric Filters are the better choice for legacy or third-party log formats.When should I use Application Signals versus raw X-Ray?
Use Application Signals when you want SLO-grade summarized health (latency p99, error rate, availability) attached to logicalService / Operation / Application objects with built-in dashboards. Use raw X-Ray when you need full per-request trace detail — Service Map plus segment timelines — for incident debugging. The two share the same underlying spans; Application Signals is the aggregation layer on top.Do I need ADOT, or is the X-Ray SDK enough?
Use the X-Ray SDK if your runtime is a single AWS-supported language and you only need to trace into X-Ray. Use ADOT when you (a) want a single instrumentation that also sends metrics to CloudWatch and external backends, (b) need vendor-neutral OpenTelemetry semantics for portability, or (c) want auto-instrumentation for HTTP / DB libraries without code changes. ADOT is the recommended default for new projects.How does Transaction Search differ from regular X-Ray sampling?
Regular X-Ray sampling records a representative subset of traces — perfect for trend dashboards but lossy for "find the one failed checkout for user 42".Transaction Search indexes 100% of opted-in spans by selected attributes so attribute-based lookup works on every request, in exchange for higher ingestion cost. You typically combine the two: sampling for the Service Map view, Transaction Search for incident forensics.How does the CloudWatch Logs Retention Policy relate to the cost of vended logs?
ARetention Policy controls how long log events remain after ingestion — it does not change the ingestion cost (which is the dominant cost for vended logs like VPC Flow Logs and Bedrock invocation logs). To reduce vended-log cost you typically (a) lower the retention, (b) use a Subscription Filter to ship to S3 for cheaper long-term storage, or (c) reduce the upstream service's logging verbosity at the source.Related Articles on hidekazu-konishi.com
- AWS History and Timeline regarding Amazon CloudWatch — the chronological history of Amazon CloudWatch features referenced throughout this glossary
- Amazon CloudWatch Logs Insights Query Collection — ready-to-use Logs Insights queries that complement the
Logssection above - Incident Triage Flowcharts for Network, Database, and Application — operational decision trees that consume CloudWatch and X-Ray signals
- Amazon Bedrock AgentCore Implementation Guide — Part 3: Infrastructure — context on AgentCore's Vended Logs and Transaction Search integration
- AI and Machine Learning Glossary for AWS — companion Reference Aggregation Page covering AI/ML services on AWS
- Amazon Bedrock Glossary — companion glossary covering Amazon Bedrock terminology
References
- What Is Amazon CloudWatch? - Amazon CloudWatch User Guide
- What Is Amazon CloudWatch Logs? - Amazon CloudWatch Logs User Guide
- CloudWatch Logs Insights Query Syntax
- What Is AWS X-Ray? - AWS X-Ray Developer Guide
- Amazon CloudWatch Application Signals
- AWS Distro for OpenTelemetry (ADOT)
- OpenTelemetry Specification
- Amazon CloudWatch RUM
- Amazon CloudWatch Synthetics
- Amazon CloudWatch Internet Monitor
- Amazon CloudWatch Network Synthetic Monitor
- AWS Cloud Operations Blog
- Google SRE Book - Service Level Objectives (SLI / SLO / Error Budget)
References:
Tech Blog with curated related content
Written by Hidekazu Konishi