CloudWatch Logs Insights Query Cookbook: Practical Recipes for Incident Investigation, Cost Analysis, and Security Audits
First Published:
Last Updated:
filter clauses, and hope the right line appears.This article is a curated collection of fifty CloudWatch Logs Insights queries that I keep in my own snippets file. Each one is shaped around a real-world question — "which Lambda function is timing out?", "who logged in to the root account last week?", "how much data is leaving the VPC through the NAT Gateway?" — and is written to be copy-paste-ready against the standard log groups produced by AWS Lambda, Amazon API Gateway, Amazon VPC Flow Logs, AWS CloudTrail, and the AWS WAF / Application Load Balancer log formats.
I have grouped the queries into five categories of ten queries each: incident investigation, cost and usage analysis, security audit, performance and latency, and cross-service / cross-account analytics. Before the catalog, there is a compressed syntax reference that summarizes the six commands you will use 95% of the time. After the catalog, a short pitfalls section captures the optimization habits that separate "the query ran in three seconds" from "the query scanned eighty gigabytes and cost more than the bug it was investigating."
*The queries and configuration in this article were written as part of independent research and operational notes, and are provided as-is with no warranty. Verify them against your own log groups, field names, and AWS region before relying on them in production. Some details — particularly Logs Insights quotas, scanned-byte pricing, and field-name conventions for newer log formats — change over time, so re-check the official documentation before you depend on a number.
*For this article, AWS services were used on personal AWS accounts. Field names shown reflect the default formats produced by Lambda, API Gateway, VPC Flow Logs, ALB, WAF, and CloudTrail at the time of writing.
Why Logs Insights, and How to Read This Article
CloudWatch Logs Insights sits between two extremes. On one side you have CloudWatch Logs Live Tail and the metric filter — fast, narrow tools for "what is happening right now" and "alarm me if pattern X happens." On the other side you have Amazon Athena, Amazon OpenSearch Service, and full data-lake exports — powerful, but with a setup tax.Logs Insights occupies the middle: ad-hoc analytical queries over the last hours, days, or weeks of a log group, with no infrastructure to provision and no schema to declare in advance. It auto-discovers fields from JSON-structured logs and supports lightweight regex extraction from unstructured text. The tradeoff is the per-query scan cost and the per-query data limits, which is why writing efficient queries — narrow time ranges, narrow
filter clauses, the smallest fields list that answers the question — actually matters.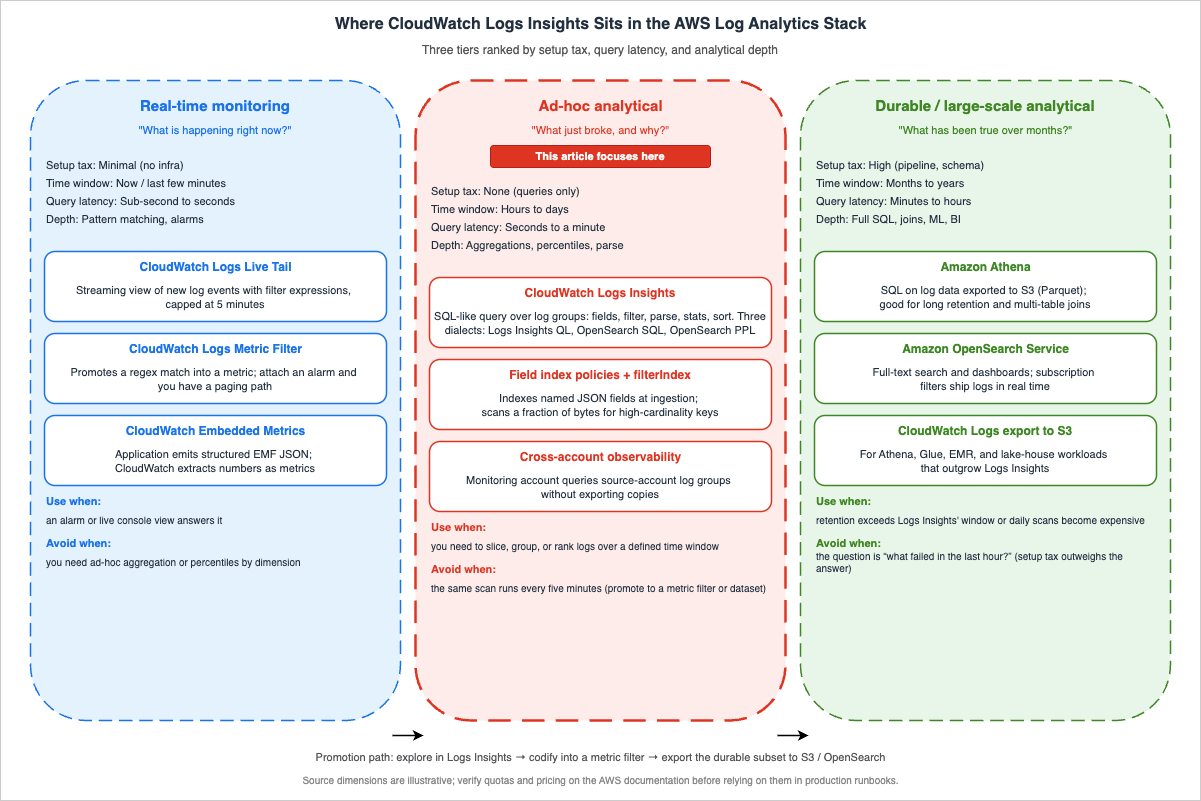
Each query block in this article follows the same structure: a one-line description of what the query answers, the query body itself in a code block, an example of the kind of output you should expect, and a short variation note that nudges you toward adjacent investigations. If you want context on how Lambda, API Gateway, S3, and the rest of the observability stack arrived at their current shape, the AWS History and Timeline series on this site walks through the announcements year by year.
Table of Contents:
Query Syntax Quick Reference
Since December 2024, CloudWatch Logs Insights supports three query languages in the same console: the original Logs Insights Query Language (Logs Insights QL), OpenSearch SQL, and OpenSearch Piped Processing Language (PPL). Every query in this article is written in Logs Insights QL because it is the most widely deployed dialect, the only one that runs unchanged against existing dashboards and saved queries, and the dialect that all the commands listed below were originally designed for. The same investigative shapes translate directly to SQL (with familiarSELECT / JOIN / subquery syntax) and to PPL (pipe-and-search style) once you opt into them via the language selector at the top of the Logs Insights editor.The Logs Insights QL has fewer than ten commands you will reach for daily. The cheat sheet below is the one I would have wanted on day one.
fieldsdeclares the columns to project. Auto-discovered JSON fields appear as@-prefixed system fields plus the dotted JSON path. The most common system fields are@timestamp,@message,@logStream,@log, and@requestId(Lambda).filternarrows rows. Boolean composition usesand,or,not. String matching:=,!=,like /regex/, and the case-insensitive variants.ispresent(field)tests for null.parseextracts named fields from unstructured strings using a glob-style pattern (*) or a regex. Use it when your logs are not JSON, or when you want a sub-field from a JSON value.statsaggregates. Supportscount(),count_distinct(),sum(),avg(),min(),max(),pct(field, p),stddev(), plusbygrouping and time bucketing viabin().sortorders rows.ascis the default;descis what you want most of the time. You can sort by multiple fields.limitcaps the number of rows returned. Without it, Logs Insights returns up to 10,000 log events, and you can request up to 100,000 with an explicitlimit; any time you need more rows than that, switch to an aggregation or export the result.dedupremoves duplicates by one or more fields. Useful for "distinct request IDs" without aggregating.displayrestricts the visible columns in the result without affecting the underlying projection.
A representative skeleton query looks like this:
fields @timestamp, @message, @requestId
| filter @message like /ERROR/
| stats count() as error_count by bin(5m)
| sort @timestamp desc
| limit 100
A few language gotchas worth internalizing before you write your hundredth query:
- The pipe character separates commands; line breaks are decorative.
- String literals are enclosed in single or double quotes; regex literals are slash-delimited.
bin(N<unit>)acceptss,m,h,d—bin(5m),bin(1h). Always usebin()when you want a time-series chart from astatsquery.- JSON fields with dots in the path must be quoted:
`requestContext.identity.sourceIp`. - Logs Insights returns up to 10,000 log events when no
limitis specified, and you can request up to 100,000 with an explicitlimit; for larger result sets, run an aggregation or export the result viaaws logs start-query+ S3.
There are three idioms you will reach for again and again across the categories below; it is worth seeing them in isolation before they appear inside larger queries.
The first is conditional aggregation — the equivalent of SQL's
SUM(CASE WHEN ... THEN 1 ELSE 0 END). Logs Insights supports the same construction inside stats:stats sum(case when status >= 500 then 1 else 0 end) as errors,
sum(case when status >= 200 and status < 300 then 1 else 0 end) as successes,
count() as total
by path
The second is cohort filtering with
parse + filter. Extract a numeric field from an unstructured log line, then filter on it as if it were a first-class column:parse @message /response_size=(?<size>\d+)/
| filter ispresent(size) and size > 1048576
| stats count() as large_responses by bin(5m)
The third is top-N with frequency ratio, useful for telling apart "the top item dominates" from "the top item is one of many":
stats count() as occurrences by err
| sort occurrences desc
| limit 10
Once these three shapes are in your hands, the fifty queries below mostly become parameterized variations on them.
Category 1: Incident Investigation
The ten queries below are the ones I run during an active incident. They assume the log group already contains JSON-structured Lambda or API Gateway logs in the default format. If your application emits unstructured text instead of JSON, most of the queries still work but the field references change: substituteparse stages where I use direct field access, and expect every query to scan more data than the JSON equivalent because the engine cannot push field-level filters down as aggressively.1. Surface every error-level message in the last hour
When the alarm fires and you have no idea what broke, start here. This query lists every error-marked entry across the selected log group, sorted newest first.fields @timestamp, @logStream, @message
| filter @message like /(?i)error|exception|fatal/
| sort @timestamp desc
| limit 200
Example output:
| @timestamp | @logStream | @message |
|---|---|---|
| 2026-04-26T03:14:02 | 2026/04/26/[$LATEST]a1b2c3 | ERROR: DynamoDB ConditionalCheckFailedException ... |
| 2026-04-26T03:13:58 | 2026/04/26/[$LATEST]a1b2c3 | ERROR: AccessDenied: kms:Decrypt on key arn:aws:kms ... |
Variation: replace the regex with
/CRITICAL|FATAL/ for narrower triage, or add a filter @logStream like /production/ clause when one log group fans out to multiple environments.2. List Lambda invocations that ran out of time
Lambda emits a deterministic line —Task timed out after N seconds — in the function's own log group when the configured timeout is reached. This query collects every timeout occurrence and groups them by function and stream.fields @timestamp, @logStream, @message
| filter @message like /Task timed out after/
| parse @message "Task timed out after * seconds" as timeout_seconds
| stats count() as timeout_count by @log, timeout_seconds
| sort timeout_count desc
Example output:
| @log | timeout_seconds | timeout_count |
|---|---|---|
| /aws/lambda/order-processor | 30.03 | 47 |
| /aws/lambda/image-resizer | 60.05 | 12 |
Variation: drop the
stats line and keep @requestId from @message to get the per-invocation list — handy when correlating with API Gateway 504 errors.3. Capture unhandled exceptions with stack traces
Python and Node.js Lambda handlers log multi-line stack traces under a single CloudWatch log event. The Logs Insights query language treats the full event as@message, which is exactly what you want when you need to see the failure cause and the call site at once.fields @timestamp, @requestId, @message
| filter @message like /Traceback|Unhandled exception|UnhandledPromiseRejection/
| sort @timestamp desc
| limit 100
Example output excerpt:
2026-04-26T03:10:11Z  req-abc123  Traceback (most recent call last):
  File "/var/task/handler.py", line 42, in lambda_handler
    response = client.put_item(...)
botocore.exceptions.ClientError: An error occurred (ValidationException) ...
Variation: pivot the same data into a frequency view by appending
| stats count() by bin(5m) to confirm whether the spike is contained or still growing.4. Distribution of error categories
Knowing the shape of the error set is the difference between "we had ten errors" and "we had ten errors of the same kind, and one is a 5xx feedback loop." This query buckets errors by an extracted prefix.fields @timestamp, @message
| filter @message like /(?i)error|exception/
| parse @message /(?<error_class>[A-Z][A-Za-z]+(?:Error|Exception))/
| stats count() as occurrences by error_class
| sort occurrences desc
| limit 25
Example output:
| error_class | occurrences |
|---|---|
| ValidationException | 312 |
| ProvisionedThroughputExceededException | 88 |
| TimeoutError | 21 |
Variation: add
, bin(15m) as window to the by clause to see which error class is currently accelerating.5. Pull every 5xx response from API Gateway access logs
API Gateway access logging emits one JSON line per request when access logging is enabled on the stage. This query isolates server-side failures and orders by response time so the slow-and-broken requests surface first.Note: The field names below assume the recommended JSON access log format that emits
$context.requestId, $context.status, $context.integrationStatus, $context.responseLatency, $context.path, and $context.httpMethod as flat keys. If your stage uses the CLF/XML format or a custom JSON template that omits any of these variables, adjust the field references accordingly. Query 32 contains the same caveat for latency-oriented queries.fields @timestamp, requestId, status, integrationStatus, responseLatency, path, httpMethod
| filter status >= 500
| sort responseLatency desc
| limit 200
Example output:
| @timestamp | requestId | status | integrationStatus | responseLatency | path | httpMethod |
|---|---|---|---|---|---|---|
| 2026-04-26T03:09:11Z | abc-123 | 504 | 504 | 30012 | /v1/orders | POST |
| 2026-04-26T03:09:08Z | abc-122 | 502 | 502 | 412 | /v1/orders | POST |
Variation: when running multi-region, add
| stats count() by status, integrationStatus to confirm whether the failure mode is upstream (Lambda integration) or at the API Gateway layer.6. Find Lambda init-phase failures
Init-phase errors (failed import, missing layer, IAM read failure on a Secrets Manager call in module scope) show up asINIT_REPORT log entries followed by an exception. They are easy to miss because they occur before your handler runs.fields @timestamp, @logStream, @message
| filter @message like /INIT_REPORT|Runtime.ImportModuleError|Runtime.HandlerNotFound/
| sort @timestamp desc
| limit 100
Example output excerpt:
INIT_REPORT Init Duration: 4123.45 ms  Phase: init  Status: error  Error Type: Runtime.ImportModuleError
Runtime.ImportModuleError: Error: Cannot find module 'aws-sdk' ...
Variation: aggregate by
@log to identify which functions are failing init repeatedly across deployments.7. Cold-start spike detection
Cold-start latency tail shows up as outlierInit Duration values. This query flags initializations that exceeded a chosen threshold and counts them per function.fields @timestamp, @log, @message
| filter @type = "REPORT"
| parse @message /Init Duration: (?<init_ms>\d+\.\d+) ms/
| filter ispresent(init_ms) and init_ms > 1000
| stats count() as cold_starts, avg(init_ms) as avg_init_ms, max(init_ms) as max_init_ms by @log
| sort max_init_ms desc
Example output:
| @log | cold_starts | avg_init_ms | max_init_ms |
|---|---|---|---|
| /aws/lambda/payment-svc | 142 | 1850.21 | 5012.34 |
| /aws/lambda/profile-api | 31 | 1320.05 | 2105.88 |
Variation: replace the threshold with
> 3000 to focus on the worst performers, or remove the threshold and add bin(1h) to draw a cold-start trend chart.8. Trace a single request end to end
When a customer reports a problem with a specific request ID, you want every log line associated with that ID — across the Lambda execution and any downstream invocations that propagated the same correlation header.Note:
@requestId is a Lambda-only system field; for non-Lambda log sources, rely on the second filter clause (@message like /.../) using whatever request identifier your application logs.fields @timestamp, @logStream, @message
| filter @requestId = "abc-123-def-456" or @message like /abc-123-def-456/
| sort @timestamp asc
Example output: the full event timeline for that request, with downstream log groups sorted in chronological order.
Variation: switch
@requestId to xrayTraceId if you propagate the X-Ray trace ID; the same pattern works for Step Functions execution ARNs.9. Errors per minute for an incident timeline
Post-incident reviews need a timeline. This query produces the per-minute error count you can paste straight into the incident document.fields @timestamp, @message
| filter @message like /(?i)error|exception/
| stats count() as errors by bin(1m)
| sort @timestamp asc
Example output:
| bin(1m) | errors |
|---|---|
| 2026-04-26T02:55 | 0 |
| 2026-04-26T02:56 | 3 |
| 2026-04-26T02:57 | 41 |
| 2026-04-26T02:58 | 87 |
| 2026-04-26T02:59 | 12 |
Variation: increase the bucket to
bin(5m) for a longer window, or add a second stats field for count_distinct(@requestId) to see whether the spike is one customer or many.10. Top error messages by frequency
When you have a hundred error variants, the long tail is rarely interesting. The top five usually account for ninety percent of the volume.fields @message
| filter @message like /(?i)error|exception/
| parse @message /"errorMessage":"(?<err>[^"]+)"/
| stats count() as occurrences by err
| sort occurrences desc
| limit 10
Example output:
| err | occurrences |
|---|---|
| Could not assume role: AccessDenied | 412 |
| ConditionalCheckFailedException | 188 |
| Connection reset by peer | 91 |
Variation: when your logs are not JSON, replace the
parse regex with one that matches the leading prefix of your standard error format.Walkthrough: Chaining Queries During an Active Incident
The queries above are most useful in combination. Here is the sequence I usually run during a real incident, with the queries from Category 1 explicitly named so the chain is reproducible.Minute zero: the alarm fires — "API Gateway 5xx rate above threshold." I open Logs Insights against the API Gateway access log group and run query 5 ("Pull every 5xx response from API Gateway access logs"). The first scan, over the last fifteen minutes, returns a list of failing requests. The pattern is immediately visible: every failure is on
POST /v1/orders, and every integrationStatus is 504. That tells me the request is reaching API Gateway but the integration — in this case a Lambda function — is timing out before responding.Minute two: I switch to the Lambda function's log group and run query 2 ("List Lambda invocations that ran out of time"). Sure enough,
/aws/lambda/order-processor shows a sharp climb in Task timed out after 30.03 seconds entries. The histogram from query 9 ("Errors per minute for an incident timeline") confirms the timeline: zero failures at 02:55, three at 02:56, forty-one at 02:57, and so on. The rate is still climbing.Minute four: I want to see why the function is timing out. Query 3 ("Capture unhandled exceptions with stack traces") returns nothing — no Python tracebacks. That rules out an exception in the handler. Query 11 ("Lambda invocations grouped by function") confirms the order-processor function is invoking at its usual rate; it is not a sudden traffic spike. So the function is taking the request, getting stuck, and returning never. The most common cause for that profile is a downstream call: a database query that has lost an index, a third-party API that has slowed down, or a network path that is dropping packets.
Minute six: the Lambda function logs include a
SLOW_QUERY emit from the application's database wrapper. Query 33 ("Slow database queries from application logs") returns the dominant pattern: SELECT * FROM orders WHERE customer_id = ? is averaging four seconds, peaking at eighteen. That is the cause. A few minutes earlier someone shipped a deploy that dropped an index on the customer_id column. Roll back the deploy; the timeout traffic clears within ninety seconds.The point of writing the walkthrough out is not the diagnosis — you would have arrived there with any toolset. The point is the sequencing: the queries chained from "what is failing at the surface" to "what is the cause" without leaving Logs Insights, and each query took five seconds to run because the time range stayed narrow and the filters stayed selective. That habit is what makes Logs Insights worth keeping in the on-call toolbox even after you have a full APM solution wired up.
Category 2: Cost and Usage Analysis
The ten queries below help answer "what is consuming budget?" — not by calling the Cost Explorer API, but by reading the operational signal directly from the logs. The Cost Explorer API is the right place to look for "what is the bill?"; Logs Insights is the right place to look for "which workload is driving the bill?", because the dimensions you want (function name, route, source IP, target group) are richer in the logs than in the cost data. The queries below assume a one-week time range; the longer the range, the more confident you can be that a top-N ranking reflects steady-state behavior rather than a single anomalous hour.11. Lambda invocations grouped by function
Lambda is billed on invocations and duration. The first cost question is always "which functions are running, and how often?"fields @log
| filter @type = "REPORT"
| stats count() as invocations by @log
| sort invocations desc
Example output:
| @log | invocations |
|---|---|
| /aws/lambda/order-processor | 412318 |
| /aws/lambda/image-resizer | 89211 |
| /aws/lambda/profile-api | 18044 |
Variation: add
bin(1d) to project a per-day call rate and detect quietly-growing background workloads.12. Sum of Lambda billed duration per function
Billed duration approximates the duration component of Lambda cost. Combine it with the configured memory size to estimate dollars.fields @log, @billedDuration, @memorySize
| filter @type = "REPORT"
| stats sum(@billedDuration) as billed_ms_total,
avg(@billedDuration) as billed_ms_avg,
count() as invocations,
max(@memorySize) as memory_mb
by @log
| sort billed_ms_total desc
Example output:
| @log | billed_ms_total | billed_ms_avg | invocations | memory_mb |
|---|---|---|---|---|
| /aws/lambda/order-processor | 312445000 | 758.21 | 412318 | 1024 |
Variation: multiply
billed_ms_total / 1000 * memory_mb / 1024 against the current Lambda GB-second price (which differs between x86 and ARM/Graviton2 — see the official AWS Lambda pricing) to convert to dollars.13. Memory utilization waste
Lambda emitsMax Memory Used in every REPORT line. If your average peak is 128 MB and the function is configured at 1024 MB, you are paying eight times what you need to.fields @log, @memorySize, @maxMemoryUsed
| filter @type = "REPORT"
| stats avg(@maxMemoryUsed) as avg_used_mb,
max(@maxMemoryUsed) as peak_used_mb,
max(@memorySize) as configured_mb,
count() as invocations
by @log
| sort avg_used_mb asc
Example output:
| @log | avg_used_mb | peak_used_mb | configured_mb | invocations |
|---|---|---|---|---|
| /aws/lambda/profile-api | 64 | 89 | 1024 | 18044 |
Variation: filter out warm-up traffic by adding
| filter invocations > 1000 after the stats stage, or compute the headroom ratio with peak_used_mb * 100 / configured_mb.14. API Gateway requests by route
This query buckets every API Gateway request by HTTP method and path so you can see which routes drive load.Note: Same prerequisite as query 5 — the
httpMethod and path field names assume an API Gateway access log JSON template that emits $context.httpMethod and $context.path as flat keys. Adjust the references if your stage uses a custom format.fields httpMethod, path
| stats count() as requests by httpMethod, path
| sort requests desc
| limit 25
Example output:
| httpMethod | path | requests |
|---|---|---|
| POST | /v1/orders | 142318 |
| GET | /v1/health | 89231 |
| GET | /v1/profile/{id} | 51022 |
Variation: combine with status to find expensive failure paths:
| stats count() by httpMethod, path, status.15. WAF rule hits
AWS WAF logging produces JSON entries with aterminatingRuleId field. Counting the top rules tells you which detections are doing the work — and which are noise.fields @timestamp, action, terminatingRuleId, httpRequest.uri
| filter ispresent(terminatingRuleId)
| stats count() as hits by terminatingRuleId, action
| sort hits desc
| limit 25
Example output:
| terminatingRuleId | action | hits |
|---|---|---|
| AWS-AWSManagedRulesCommonRuleSet | BLOCK | 12048 |
| AWS-AWSManagedRulesKnownBadInputsRuleSet | BLOCK | 4421 |
| GeoBlock-Custom-CN | BLOCK | 1923 |
Variation: pivot to the source country with
httpRequest.country to confirm whether geo-rules are firing where you intended.16. VPC Flow Logs traffic by source IP
VPC Flow Logs charge by ingestion volume. The same data also tells you who is sending you traffic.fields srcAddr, dstAddr, bytes
| stats sum(bytes) as total_bytes by srcAddr
| sort total_bytes desc
| limit 25
Example output:
| srcAddr | total_bytes |
|---|---|
| 10.0.4.32 | 9821345982 |
| 10.0.4.51 | 5024132111 |
| 203.0.113.7 | 4123445 |
Variation: replace
srcAddr with dstAddr to see top destinations, or add srcPort / dstPort for per-application breakdown.17. NAT Gateway egress estimation
NAT Gateway data processing charges accumulate quickly. If outbound bytes from private subnets are not what you expect, this query helps narrow the suspect workload.fields srcAddr, dstAddr, bytes, action
| filter action = "ACCEPT" and srcAddr like /^10\./ and not (dstAddr like /^10\./)
| stats sum(bytes) as egress_bytes by srcAddr
| sort egress_bytes desc
| limit 25
Example output:
| srcAddr | egress_bytes |
|---|---|
| 10.0.5.21 | 18024132111 |
| 10.0.5.34 | 4012345982 |
Variation: convert bytes to gigabytes with
egress_bytes / 1024 / 1024 / 1024 as egress_gb and multiply by the NAT Gateway data-processing rate (see the official Amazon VPC pricing).18. ALB unhealthy host events
Application Load Balancer access logs exposetarget_status_code and elb_status_code fields. A divergence between the two — for example, 502 from the ELB while the target is - — usually indicates the target was unhealthy when the request landed.Note: ALB access logs are natively delivered only to Amazon S3 as gzipped space-separated text files; native vended-logs delivery to CloudWatch Logs is GA today only for Network Load Balancer access logs (Nov 2025), not yet for ALB. To run this query you typically ship ALB logs into CloudWatch Logs via a downstream pipeline (S3 event notification → Lambda →
PutLogEvents, or Firehose → CloudWatch Logs subscription) and parse the line into JSON in the shipper. If you keep the original space-separated payload, prepend a parse @message stage that extracts each field by position.fields @timestamp, target_ip, target_status_code, elb_status_code, request_url
| filter elb_status_code >= 500 and (target_status_code = "-" or target_status_code >= 500)
| stats count() as failures by target_ip, elb_status_code
| sort failures desc
Example output:
| target_ip | elb_status_code | failures |
|---|---|---|
| 10.0.6.21 | 502 | 412 |
| 10.0.6.21 | 504 | 88 |
Variation: cross-reference the
target_ip with the ECS task ARN or EC2 instance metadata to identify the misbehaving node.19. CloudFront cache miss rate by URI
CloudFront real-time logs includex-edge-result-type. A high Miss rate by URI signals a caching policy that needs tightening.Note: CloudFront real-time logs are delivered to Amazon Kinesis Data Streams by default, and CloudFront standard logs are delivered to Amazon S3 (or, on the v2 standard logs option, to S3 / CloudWatch Logs / Data Firehose). To run this query against CloudWatch Logs, ship the real-time logs through Amazon Data Firehose to a CloudWatch log group (or use v2 standard logs with the CloudWatch Logs destination), and ensure the field names
cs-uri-stem and x-edge-result-type are part of the configured field set.fields `cs-uri-stem`, `x-edge-result-type`
| stats count() as requests,
count_distinct(`x-edge-result-type`) as type_count,
sum(case when `x-edge-result-type` = "Miss" then 1 else 0 end) as miss_count
by `cs-uri-stem`
| filter requests > 100
| sort miss_count desc
| limit 25
Example output:
| cs-uri-stem | requests | type_count | miss_count |
|---|---|---|---|
| /api/v1/recommendations | 18241 | 3 | 18098 |
| /assets/banner.png | 51223 | 2 | 412 |
Variation: replace
Miss with Error to focus on origin failures, or add cs-host to break down by domain when one distribution serves multiple sites.20. Provisioned concurrency utilization
Provisioned concurrency is paid per configured unit per hour. When it is over-provisioned, the spend is silent.fields @timestamp, @log, @message
| filter @message like /Init Duration/
| parse @message /Init Duration: (?<pc_ms>[\d.]+) ms/
| stats avg(pc_ms) as avg_pc_init_ms by @log
| sort avg_pc_init_ms desc
Note: For on-demand cold starts, Lambda emits
Init Duration on the same REPORT line as the invocation report. For functions configured with Provisioned Concurrency or SnapStart, Lambda additionally emits an INIT_REPORT platform event on every initialization (not only on failure). The @message like /Init Duration/ filter therefore matches both shapes — REPORT lines from on-demand cold starts and INIT_REPORT lines from PC / SnapStart initializations. To narrow strictly to PC / SnapStart inits, add | filter @message like /INIT_REPORT/ after the first filter.Example output:
| @log | avg_pc_init_ms |
|---|---|
| /aws/lambda/checkout-api | 247.3 |
| /aws/lambda/auth-svc | 189.1 |
Variation: combine with the invocations count from query 11 to compute utilization (invocations / (provisioned * hours_in_window)) and trim the configuration where the ratio is low.
Category 3: Security Audit
The ten queries below operate on AWS CloudTrail and VPC Flow Logs, the two log sources that show up in nearly every security review. CloudTrail logs are most powerful when you have a CloudTrail trail or an EventBridge integration delivering events to a CloudWatch log group; VPC Flow Logs work directly out of the default format. A note on scope: these queries are first-pass triage tools, not a substitute for AWS Config rules, GuardDuty, or Security Hub findings. Their value is the speed at which you can answer "is anything weird right now?" without leaving the operations console — especially during the early minutes of an incident, when the question is whether the failure has a security dimension at all.21. Console logins from CloudTrail
ConsoleLogin events live in the signin.amazonaws.com event source. The list of who logged in, from where, and using what role is the security team's first read.fields @timestamp, userIdentity.arn, sourceIPAddress, userAgent, responseElements.ConsoleLogin
| filter eventName = "ConsoleLogin"
| sort @timestamp desc
| limit 200
Example output:
| @timestamp | userIdentity.arn | sourceIPAddress | userAgent | responseElements.ConsoleLogin |
|---|---|---|---|---|
| 2026-04-26T01:14:08Z | arn:aws:iam::111111111111:user/alice | 203.0.113.7 | Mozilla/5.0 ... | Success |
| 2026-04-26T01:09:55Z | arn:aws:sts::111111111111:assumed-role/Admin/bob | 198.51.100.42 | aws-sdk-go/1.50 | Success |
Variation: filter further with
responseElements.ConsoleLogin = "Failure" to surface unsuccessful sign-ins.22. Failed authentication attempts
When investigating credential-stuffing or brute-force patterns, count failures by source IP.fields @timestamp, sourceIPAddress, userIdentity.userName, errorCode
| filter eventName = "ConsoleLogin" and responseElements.ConsoleLogin = "Failure"
| stats count() as failures by sourceIPAddress, userIdentity.userName
| sort failures desc
| limit 25
Example output:
| sourceIPAddress | userIdentity.userName | failures |
|---|---|---|
| 203.0.113.99 | alice | 412 |
| 198.51.100.221 | (unknown) | 88 |
Variation: bucket by
bin(15m) to see whether the failures cluster, or pivot to errorCode (for example InvalidUserID.NotFound vs Failed authentication).23. Root account usage
Use of the AWS account root user should be rare. AnyuserIdentity.type = "Root" event deserves manual review.fields @timestamp, eventName, sourceIPAddress, userAgent
| filter userIdentity.type = "Root" and eventName != "ConsoleLogin"
| sort @timestamp desc
| limit 100
Example output:
| @timestamp | eventName | sourceIPAddress | userAgent |
|---|---|---|---|
| 2026-04-26T00:42:07Z | UpdateAccountPasswordPolicy | 203.0.113.7 | aws-cli/2.15 |
| 2026-04-25T22:11:11Z | CreateAccessKey | 203.0.113.7 | aws-internal/3 |
Variation: extend to
eventName = "ConsoleLogin" for full root activity, or add awsRegion to spot off-region usage that suggests a stolen credential.24. IAM policy changes
A surprising number of incidents start with someone widening an IAM policy. Logs Insights makes the change history searchable.fields @timestamp, userIdentity.arn, eventName, requestParameters.policyArn, requestParameters.policyDocument
| filter eventSource = "iam.amazonaws.com" and eventName like /PutUserPolicy|PutGroupPolicy|PutRolePolicy|AttachUserPolicy|AttachRolePolicy|CreatePolicy|CreatePolicyVersion/
| sort @timestamp desc
| limit 100
Example output:
| @timestamp | userIdentity.arn | eventName | requestParameters.policyArn |
|---|---|---|---|
| 2026-04-26T03:12:11Z | arn:aws:iam::111111111111:user/alice | AttachRolePolicy | arn:aws:iam::aws:policy/AdministratorAccess |
Variation: count by actor with
| stats count() by userIdentity.arn to identify who makes the most policy changes — useful for reviewing a privileged access boundary.25. Unusual API calls from external IPs
Concentrate on calls coming from outside your known CIDR ranges; the goal is "what did this IP do" rather than "who is this IP."fields @timestamp, eventName, eventSource, sourceIPAddress, userIdentity.arn
| filter not (sourceIPAddress like /^10\./ or sourceIPAddress like /^172\.(1[6-9]|2[0-9]|3[01])\./ or sourceIPAddress like /^192\.168\./ or sourceIPAddress like /amazonaws.com$/)
| stats count() as calls by sourceIPAddress, eventSource
| sort calls desc
| limit 50
Example output:
| sourceIPAddress | eventSource | calls |
|---|---|---|
| 203.0.113.7 | s3.amazonaws.com | 412 |
| 198.51.100.42 | ec2.amazonaws.com | 88 |
Variation: invert the filter to see only internal-VPC calls when triaging a confirmed lateral-movement scenario.
26. S3 access denied errors
S3AccessDenied events catch both legitimate misconfiguration and active probing. Either way, you want to see them.fields @timestamp, userIdentity.arn, eventName, requestParameters.bucketName, requestParameters.key, errorCode, errorMessage, sourceIPAddress
| filter eventSource = "s3.amazonaws.com" and errorCode = "AccessDenied"
| sort @timestamp desc
| limit 100
Example output:
| @timestamp | userIdentity.arn | eventName | requestParameters.bucketName | errorCode |
|---|---|---|---|---|
| 2026-04-26T03:08:11Z | arn:aws:iam::111111111111:role/AppRole | GetObject | sensitive-data-prod | AccessDenied |
Variation: pivot to
| stats count() by requestParameters.bucketName, userIdentity.arn to find chronic mismatches between code and policy.27. KMS key usage
Knowing which IAM principal is decrypting which KMS key is the foundation of any data-protection audit.fields @timestamp, userIdentity.arn, eventName, resources.0.ARN, requestParameters.encryptionContext
| filter eventSource = "kms.amazonaws.com" and (eventName = "Decrypt" or eventName = "GenerateDataKey")
| stats count() as uses by userIdentity.arn, resources.0.ARN, eventName
| sort uses desc
| limit 50
Example output:
| userIdentity.arn | resources.0.ARN | eventName | uses |
|---|---|---|---|
| arn:aws:iam::111111111111:role/AppRole | arn:aws:kms:us-east-1:111111111111:key/abc-123 | Decrypt | 412318 |
Variation: filter by
requestParameters.encryptionContext.aws:s3:arn to scope to S3-bucket-specific usage, or limit by awsRegion to verify cross-region usage matches your design.28. VPC Flow Logs REJECT records
Rejected flows are the network-layer equivalent ofAccessDenied — sometimes legitimate firewall noise, sometimes a probe or a misrouted internal call.fields srcAddr, dstAddr, srcPort, dstPort, protocol, action
| filter action = "REJECT"
| stats count() as rejects by srcAddr, dstAddr, dstPort, protocol
| sort rejects desc
| limit 50
Example output:
| srcAddr | dstAddr | dstPort | protocol | rejects |
|---|---|---|---|---|
| 203.0.113.99 | 10.0.5.10 | 22 | 6 | 412 |
| 198.51.100.7 | 10.0.5.10 | 3389 | 6 | 88 |
Variation: add the network interface ID with
interfaceId to attribute the reject to a specific ENI when you have multi-AZ routing.29. WAF blocked requests by IP
When WAF is doing its job you want to know whether the same set of attackers keep coming back.fields httpRequest.clientIp, action, terminatingRuleId, httpRequest.country, httpRequest.uri
| filter action = "BLOCK"
| stats count() as blocks by httpRequest.clientIp, terminatingRuleId
| sort blocks desc
| limit 50
Example output:
| httpRequest.clientIp | terminatingRuleId | blocks |
|---|---|---|
| 203.0.113.99 | AWS-AWSManagedRulesCommonRuleSet | 412 |
Variation: add
httpRequest.country to the by clause to feed a geo-pattern dashboard, or invert to action = "COUNT" when validating a new rule before flipping it to BLOCK.30. Assumed-role usage
AssumeRole and AssumeRoleWithWebIdentity track who is acting as which role. A surprising actor or a surprising role is a fast way to spot privilege escalation.fields @timestamp, userIdentity.arn, requestParameters.roleArn, sourceIPAddress
| filter eventSource = "sts.amazonaws.com" and (eventName = "AssumeRole" or eventName = "AssumeRoleWithWebIdentity" or eventName = "AssumeRoleWithSAML")
| stats count() as assumes by userIdentity.arn, requestParameters.roleArn
| sort assumes desc
| limit 50
Example output:
| userIdentity.arn | requestParameters.roleArn | assumes |
|---|---|---|
| arn:aws:iam::111111111111:user/ci-runner | arn:aws:iam::222222222222:role/DeployRole | 1820 |
Variation: filter on
requestParameters.roleArn like /Admin/ to focus on high-privilege role usage, or pivot to sourceIPAddress to validate that automation-only roles are only assumed from CI ranges.Category 4: Performance and Latency
Performance investigations live in the same logs as incidents, but the questions are different: "what is the p99?", "is this getting worse?", "which path is slow?" The metrics that ship with Lambda, API Gateway, and ALB give you the headline percentile values for free; what they do not give you is the ability to slice by application-specific dimensions like customer tier, route segment, or trace ID. The queries below are how you get those slices without standing up a separate metrics pipeline.31. Lambda p99 duration by function
Lambda'sREPORT line carries Duration: N.NN ms. Logs Insights percentile aggregation does the rest.fields @log, @duration
| filter @type = "REPORT"
| stats avg(@duration) as avg_ms,
pct(@duration, 50) as p50_ms,
pct(@duration, 95) as p95_ms,
pct(@duration, 99) as p99_ms,
max(@duration) as max_ms
by @log
| sort p99_ms desc
| limit 25
Example output:
| @log | avg_ms | p50_ms | p95_ms | p99_ms | max_ms |
|---|---|---|---|---|---|
| /aws/lambda/order-processor | 412.21 | 312.05 | 1850.14 | 5012.34 | 28010.21 |
Variation: bucket by
bin(15m) and use as a recurring panel; the slope of the p99 line is more diagnostic than the absolute value.32. API Gateway latency percentiles
API Gateway access logs includeresponseLatency — the total time the request spent in API Gateway, including integration latency.Note: Access logging on an API Gateway stage is opt-in, and the field names available to Logs Insights are exactly the
$context variables you choose for the access log format. The query below assumes a JSON format that emits $context.path, $context.responseLatency, and $context.integrationLatency as their flat names. If you use the recommended JSON template provided in the API Gateway console these fields are already present; if you wrote a custom format, confirm the variables are named.fields path, responseLatency
| stats avg(responseLatency) as avg_ms,
pct(responseLatency, 50) as p50_ms,
pct(responseLatency, 95) as p95_ms,
pct(responseLatency, 99) as p99_ms,
count() as requests
by path
| sort p99_ms desc
| limit 25
Example output:
| path | avg_ms | p50_ms | p95_ms | p99_ms | requests |
|---|---|---|---|---|---|
| /v1/orders | 412.21 | 312.05 | 1850.14 | 5012.34 | 142318 |
| /v1/profile/{id} | 88.05 | 65.12 | 412.05 | 1102.14 | 51022 |
Variation: split
responseLatency from integrationLatency in two stats blocks to attribute time between API Gateway and the integration — a common needle to find.33. Slow database queries from application logs
If your application emitsSLOW_QUERY: <ms> <statement> lines, this query surfaces the worst offenders.fields @timestamp, @message
| filter @message like /SLOW_QUERY/
| parse @message /SLOW_QUERY:\s+(?<ms>\d+)\s+(?<sql>.+)/
| stats avg(ms) as avg_ms, max(ms) as max_ms, count() as occurrences by sql
| sort avg_ms desc
| limit 25
Example output:
| sql | avg_ms | max_ms | occurrences |
|---|---|---|---|
| SELECT * FROM orders WHERE customer_id = ? | 4120 | 18021 | 412 |
Variation: when your logs include the bound parameter values, mask them out with
parse before grouping so the same query shape collapses correctly.34. ALB target response time distribution
ALB access logs includetarget_processing_time. The percentile distribution by target group is a quick health check.Note: Same caveat as query 18 — ALB access logs are not natively delivered to CloudWatch Logs; this query assumes a JSON-shipped copy in CloudWatch Logs. For the default space-separated text payload, add a
parse @message stage to extract target_processing_time and target_group_arn first.fields target_group_arn, target_processing_time
| filter target_processing_time != -1
| stats avg(target_processing_time) as avg_s,
pct(target_processing_time, 95) as p95_s,
pct(target_processing_time, 99) as p99_s,
count() as requests
by target_group_arn
| sort p99_s desc
Example output:
| target_group_arn | avg_s | p95_s | p99_s | requests |
|---|---|---|---|---|
| arn:aws:.../tg/web | 0.21 | 1.05 | 4.12 | 142318 |
Variation: pivot by
client:port to confirm whether one client is exposing tail latency that does not affect others.35. Cold-start latency vs warm-start latency
Compare init duration vs duration to understand the cold-start penalty in your function.fields @log, @initDuration, @duration
| filter @type = "REPORT"
| stats avg(@initDuration) as avg_init_ms,
avg(@duration) as avg_exec_ms,
count() as invocations,
sum(case when @initDuration > 0 then 1 else 0 end) as cold_starts
by @log
| sort cold_starts desc
| limit 25
Example output:
| @log | avg_init_ms | avg_exec_ms | invocations | cold_starts |
|---|---|---|---|---|
| /aws/lambda/profile-api | 1320 | 88 | 18044 | 1212 |
Variation: filter
@initDuration > 0 to look only at the cold ones and compare their @duration against warms; large gaps point to module-scope I/O that should move into the handler.36. SQS redelivery proxy via ApproximateReceiveCount
When SQS is the event source for a Lambda function, every message in the event payload carries anApproximateReceiveCount attribute that increments each time the message is delivered without being deleted. Logging the SQS event from your handler exposes this counter; values greater than 1 mean the message is being redelivered, which usually points to a poison-pill payload or a downstream call that timed out before the consumer could finish. Pair this with a separate query against SentTimestamp in the same payload if you also want a true message-age signal (for example, for visibility-timeout tuning).fields @timestamp, @log, @message
| filter @message like /ApproximateReceiveCount/
| parse @message /"ApproximateReceiveCount":"(?<receive_count>\d+)"/
| stats avg(receive_count) as avg_receive, max(receive_count) as max_receive, count() as messages by @log
| sort max_receive desc
Example output:
| @log | avg_receive | max_receive | messages |
|---|---|---|---|
| /aws/lambda/order-consumer | 1.4 | 12 | 412318 |
Variation: filter
receive_count > 1 to focus on retries, which often indicate a poison pill or a downstream timeout.37. Step Functions execution time
Step Functions logs (CloudWatch Logs destination configured on the state machine) include events withtype = "ExecutionStarted" and type = "ExecutionSucceeded" per execution. The duration is the difference between the two timestamps.fields @timestamp, type, executionArn
| filter type = "ExecutionStarted" or type = "ExecutionSucceeded" or type = "ExecutionFailed"
| stats min(@timestamp) as started, max(@timestamp) as ended by executionArn
| sort started desc
| limit 100
Example output:
| executionArn | started | ended |
|---|---|---|
| arn:aws:states:...:OrderFlow:abc-123 | 2026-04-26T03:00:00Z | 2026-04-26T03:00:11Z |
Variation: extract the duration with a separate stage that subtracts the timestamps; combine with the state machine name to group across executions.
38. AppSync resolver latency
AWS AppSync logs includeresolverArn and latency per resolver. The slow resolver is usually the suspect.fields resolverArn, latency
| filter ispresent(resolverArn)
| stats avg(latency) as avg_ms, pct(latency, 95) as p95_ms, count() as invocations by resolverArn
| sort p95_ms desc
| limit 25
Example output:
| resolverArn | avg_ms | p95_ms | invocations |
|---|---|---|---|
| arn:aws:appsync:.../resolvers/Query.getOrder | 412 | 1850 | 18044 |
Variation: filter on a
requestId to follow one client query through every resolver in a nested selection.39. Lambda concurrent execution estimation
Lambda does not emit concurrent-execution counts directly in logs, but you can estimate by counting active invocations per minute.fields @timestamp, @duration
| filter @type = "REPORT"
| stats count() as invocations, sum(@duration) as total_ms by bin(1m)
| sort @timestamp asc
Example output:
| bin(1m) | invocations | total_ms |
|---|---|---|
| 2026-04-26T03:00 | 1820 | 412318 |
| 2026-04-26T03:01 | 1822 | 415020 |
Variation: divide
total_ms / 60000 — that is, the total billed milliseconds in the bin divided by the number of milliseconds in the bin window (60,000 ms for bin(1m)) — to estimate average concurrency in that minute. The result is Little's Law applied to a one-minute window: average concurrency ≈ (sum of in-flight time) / (window length). Compare against your reserved-concurrency configuration; values that approach the reserved limit indicate throttling risk.40. Slow request paths via X-Ray correlation
If you propagateX-Amzn-Trace-Id from API Gateway through Lambda, you can cluster the slow requests by URI even when the slowness occurs deeper in the stack.fields @timestamp, @requestId, @message
| parse @message /Trace-Id: (?<trace>[\w-]+)/
| parse @message /elapsed_ms=(?<elapsed_ms>\d+)/
| filter ispresent(trace) and @message like /SLOW/
| stats count() as slow_count, max(elapsed_ms) as max_ms by trace
| sort max_ms desc
| limit 50
Note: Application logs (not the
REPORT line) are the source for the Trace-Id: token; the REPORT line emitted by the Lambda runtime does not include it, and @duration is populated only on REPORT lines. The query therefore parses an application-emitted elapsed_ms=<ms> token instead of relying on @duration. Replace the SLOW marker and the elapsed_ms field name with whatever your code logs when it considers a request slow.Example output:
| trace | slow_count | max_ms |
|---|---|---|
| Root=1-67abc-... | 4 | 5012 |
Variation: drop the
SLOW filter and keep bin(5m) to see slow-trace density per time bucket.Category 5: Cross-Service / Cross-Account Analytics
The final ten queries lean into the cross-cutting features: multi-log-group queries, time-series bucketing, and pattern detection across accounts. These are also the queries that benefit the most from a deliberate logging contract upstream: a stable correlation header propagated end-to-end, a consistent JSON schema across services, and an account-linking topology in CloudWatch that lets a monitoring account read source-account log groups. If those three pieces are in place, the queries below become trivial; if any one of them is missing, the queries still work but the joins become squishier and you end up filtering by partial string matches rather than structured fields.41. Query multiple log groups in a single statement
Logs Insights supports multiple log groups per query (current per-query limit increased from 20 to 50 log groups in February 2023; confirmed as 50 as of 2026-04 per docs.aws.amazon.com/AmazonCloudWatch/latest/logs/cloudwatch_limits_cwl.html). Selecting multiple groups in the console is the simplest way; the syntax otherwise remains identical.fields @log, @timestamp, @message
| filter @message like /(?i)error/
| stats count() as errors by @log
| sort errors desc
Example output:
| @log | errors |
|---|---|
| /aws/lambda/order-processor | 412 |
| /aws/apigateway/orders-api | 88 |
| /aws/ecs/order-frontend | 21 |
Variation: when you want strict per-service breakdown, select the log groups individually rather than using a wildcard pattern, since wildcards expand at runtime and may pull in unintended groups.
42. Trace ID across services
When Lambda, API Gateway, and ECS all emit the same correlation header, the join is just afilter on the same identifier across selected groups.fields @timestamp, @log, @message
| filter @message like /Trace-Id: Root=1-67abc-/
| sort @timestamp asc
Example output: a chronological multi-service log line view of the request lifecycle.
Variation: substitute your in-house trace header (
x-correlation-id, x-request-id); the same query shape works as long as the literal appears in every log line you care about.43. Cross-account log analysis
CloudWatch cross-account observability lets a monitoring account run Logs Insights against linked source-account log groups. Once linked, the queries above run unchanged; the only difference is the log-group selector includes accounts other than the current one.fields @timestamp, @log, @logStream, @message
| filter @message like /(?i)error|critical/
| stats count() as errors by @log
| sort errors desc
| limit 50
Variation: in a multi-account SDLC (dev / staging / prod), link only prod into the monitoring account so on-call queries do not accidentally include staging chatter.
44. Custom metrics extraction
Sometimes the application logs structured numbers and the dashboard needs them. Logs Insights can act as an ad-hoc metric extractor.fields @timestamp, @message
| parse @message /"items_processed":(?<items>\d+)/
| stats sum(items) as total_items by bin(5m)
| sort @timestamp asc
Example output:
| bin(5m) | total_items |
|---|---|
| 2026-04-26T03:00 | 18020 |
| 2026-04-26T03:05 | 19142 |
Variation: feed the same logic into a CloudWatch Logs metric filter for permanent metric publication once you have validated the extraction.
45. Distinct value counts via dedup
dedup is the lightweight equivalent of SELECT DISTINCT. It is faster than a stats by when you only need the unique set of values.Note:
dedup de-duplicates within the scanned result set, so on very large datasets where Logs Insights returns a sampled or truncated result, it may not surface every distinct value across the full log stream. For exhaustive distinct-value counts over large volumes, prefer stats count_distinct() instead.fields userIdentity.arn, sourceIPAddress
| dedup userIdentity.arn, sourceIPAddress
| sort userIdentity.arn asc
| limit 1000
Example output:
| userIdentity.arn | sourceIPAddress |
|---|---|
| arn:aws:iam::111111111111:user/alice | 203.0.113.7 |
| arn:aws:iam::111111111111:user/alice | 198.51.100.42 |
Variation: chain
dedup with stats count_distinct() to count unique combinations cheaply.46. Time-series bucketing with bin
Almost every dashboard panel reduces to "count or sum, grouped bybin(N)." It is worth being deliberate about the bucket size.fields @timestamp, @message
| filter @message like /(?i)error/
| stats count() as errors by bin(5m)
| sort @timestamp asc
Example output:
| bin(5m) | errors |
|---|---|
| 2026-04-26T03:00 | 12 |
| 2026-04-26T03:05 | 18 |
Variation: use
bin(1h) for week-long views and bin(30s) for tight incident timelines. Picking a bucket size that yields more than a few hundred buckets makes the chart noisy; fewer than ten makes trends invisible.47. Geographic IP distribution
WAF, CloudFront, and ALB logs all carry a country field directly. When they don't, you can join on a lookup table externally; for in-Logs-Insights work, the country field is sufficient.fields httpRequest.country, action
| stats count() as requests, sum(case when action = "BLOCK" then 1 else 0 end) as blocks by httpRequest.country
| sort requests desc
| limit 25
Example output:
| httpRequest.country | requests | blocks |
|---|---|---|
| US | 412318 | 412 |
| JP | 142318 | 21 |
| CN | 18021 | 17021 |
Variation: filter to only countries above a threshold (
requests > 1000) to suppress noise, then sort by blocks * 1.0 / requests to find disproportionately blocked sources.48. Top N pattern detection with the pattern command
Logs Insights includes apattern command that clusters similar messages automatically — a fast way to summarize a noisy log group without writing a regex. This is distinct from the console's automatic Patterns tab (which uses CloudWatch Log Anomaly Detection on the log group itself); the pattern command runs over the result rows of your query.fields @message
| filter @message like /(?i)error/
| pattern @message
Example output: clustered patterns with a ratio per pattern, e.g.:
| @ratio | @sampleCount | @pattern |
|---|---|---|
| 0.62 | 412 | "ERROR: ConditionalCheckFailedException ..." |
| 0.21 | 142 | "ERROR: AccessDenied ..." |
Variation: combine with a time filter to confirm whether the dominant pattern shifted between the pre-incident window and the during-incident window.
49. ECS container logs joined by task
ECS logs delivered byawslogs driver include the containerInstanceId or taskArn (depending on driver options). Joining across containers in the same task is straightforward.fields @timestamp, @logStream, @message
| filter @logStream like /ecs\/order-frontend/
| sort @timestamp asc
| limit 1000
Example output: a unified per-task timeline.
Variation: when you have sidecar containers, append
| stats count() by @logStream to confirm which container is producing the volume; compare against per-container CPU/memory in CloudWatch Container Insights.50. Anomaly detection via standard deviation
When you need a quick "is this minute weird?" signal, mean and standard deviation give you a usable proxy.fields @timestamp, @log, @duration
| filter @type = "REPORT"
| stats avg(@duration) as avg_ms, stddev(@duration) as sd_ms, count() as invocations by @log, bin(5m)
| sort sd_ms desc
| limit 25
Example output:
| @log | bin(5m) | avg_ms | sd_ms | invocations |
|---|---|---|---|---|
| /aws/lambda/order-processor | 2026-04-26T03:05 | 412 | 1820 | 1820 |
Variation: feed
(max - avg) / sd_ms into a follow-up dashboard to flag bins where the tail is many standard deviations away from the mean — a coarse but cheap anomaly signal.Running Queries from the Console, the CLI, and Saved Libraries
The console is where most queries get written, but it is not the only entry point. The AWS CLI exposesaws logs start-query, which returns a query ID; you then poll aws logs get-query-results until the status is Complete. The same pattern is wrapped in the AWS SDKs for Boto3, the AWS SDK for Java, and the Go SDK, which is what most CI / runbook automation actually uses. Two pragmatic notes that the documentation glosses over.First, the CLI returns the per-row payload in a flat list rather than a table; if you are piping the results into
jq, expect arrays of [{Field: "@timestamp", Value: "2026-04-26T03:00:00.000Z"}, ...] per row. Reshaping into the conventional column-oriented form is one extra jq stage.Second, the saved-queries feature in the console is not a code-management surface. It is fine for "the query I keep retyping," but for production runbooks I prefer to keep queries in version control next to the code that emits the matching log lines, exposed via a short script that calls
start-query. The result is reproducibility (the same query runs the same way for every on-call shift), reviewability (the diff in the pull request shows the change), and portability (the same query runs in three regions without re-saving).For exploratory work, however, the console is unbeatable. Two console habits worth keeping:
- Use the Queries tab in the Logs Insights console to recall recent queries and their results. The history persists for several days and is the cheapest way to verify "did the same query produce the same shape yesterday?"
- When the result is interesting, click the Add to dashboard button. The dashboard widget is just a frozen rendering of the query, but it brings the visualization into a place that on-call engineers actually open during an incident.
Common Pitfalls and Optimization Tips
A few habits separate efficient Logs Insights users from the people who watch the spinner. The list below is opinionated; you will recognize most of these from your own war stories.Pick the smallest time range that answers the question
Logs Insights bills on scanned bytes, and the time range is the dominant input to that scan size. A query over fifteen minutes of one log group typically scans tens of megabytes; the same query over seven days might scan tens of gigabytes. The console's default time range is the last hour, which is a reasonable compromise but the wrong default for "I just want to see the latest five errors." Start with the last fifteen minutes; widen only when you have confirmed the question requires a longer window. If you find yourself widening the range repeatedly, that is a signal that the data you actually want is too sparse for Logs Insights and belongs in metric form — either a CloudWatch metric filter or a metric exported to your monitoring stack of choice.Filter early
Afilter clause before stats is dramatically cheaper than the same filter after, because the engine pushes filter predicates down to the scan stage. The same goes for chained filters: write the most selective predicate first when you can. filter @type = "REPORT" and @duration > 1000 is faster than the reverse order on a log group where most lines are not REPORT lines, because the first predicate eliminates most rows before the duration comparison runs.Avoid * in fields
Project only the columns you need. Auto-discovered JSON fields can multiply the projected payload by a factor of ten or more. The fields command is purely about display, but the engine still pulls the underlying field values out of the scanned rows; with deeply nested JSON, that pull is not free. The cheapest queries declare three or four fields explicitly, never fields *.Prefer exact match over regex
eventName = "ConsoleLogin" is faster than @message like /ConsoleLogin/ when the field is structured, because the engine can short-circuit the comparison without scanning the regex against the whole message. The lesson generalizes: structured fields beat unstructured fields for filter performance, which is why investing in JSON-formatted application logs pays off for years. If you control the producer, log JSON.Index the fields you filter on
Since November 2024, CloudWatch Logs supports field index policies that index named JSON fields at ingestion time, and afilterIndex command that reads only the indexed slices instead of scanning the full event payload. Index policies are defined per log group or as account-level policies (up to 40 account-level policies per account; up to 20 fields per policy), and indexed events stay indexed for 30 days. Field indexes are included in Standard log class ingestion at no additional cost. The pay-off is a query that scans a fraction of the bytes for predicates against high-cardinality identifiers — request IDs, session IDs, user IDs, instance IDs — and the same query can span up to 10,000 log groups when it uses filterIndex against a prefix selector. The investment is small: define the policy once via PutIndexPolicy, then replace filter requestId = "..." with filterIndex requestId = "..." in the queries you run frequently. If your snippets file has a query that you run more than once a week, index the field it filters on.Use parse once, not in every query
When a regex extraction is reused, save it as a CloudWatch Logs metric filter or a query in your saved-queries library; do not re-derive it interactively. The interactive form is fine for "I am exploring this once" but it is the wrong place for "this is the canonical extraction." Once you have it right, codify it — ideally as part of the application's structured logging contract, so the field appears as a first-class JSON key and no parse is needed at query time.Mind the result-row cap
Logs Insights returns up to 10,000 rows whenlimit is omitted, and up to 100,000 when you specify one. Aggregations are unbounded by row count, so stats followed by sort | limit is the safest way to surface the top entries from very large result sets. When you genuinely need every row of a large result, the right move is the aws logs start-query CLI followed by an export to S3 with the CloudWatch Logs subscription filter pattern; trying to render hundreds of thousands of rows in the console is rarely useful and never fast.Quote dotted field names
`requestParameters.policyArn` with backticks works in every position; requestParameters.policyArn without backticks works in most contexts but fails when the path contains characters the parser treats as operators — for example, fields whose path includes a hyphen or a colon. When in doubt, quote.Verify quotas before scaling out queries
Concurrent active queries, log groups per query, and query history retention are all subject to AWS service quotas that can change. Current verified figures (2026-04-27): 100 concurrent active Logs Insights QL queries per account, including queries added to dashboards; 15 concurrent OpenSearch SQL or PPL queries per account; queries time out after 60 minutes if not completed; query results available for 7 days; 50 log groups per query when selecting groups individually (and up to 10,000 log groups when usingfilterIndex with a log-group prefix selector). (Verified 2026-04-27 against Analyzing log data with CloudWatch Logs Insights and CloudWatch Logs quotas.) Re-check before relying on these in production runbooks. The most common surprise is the concurrent-query limit: when ten engineers run an incident retro at the same time, queries can begin queuing instead of executing, which silently inflates the time-to-first-result.Summary
The ability to walk into an unfamiliar log group and produce an answer in three minutes is the difference between an SRE who waits for dashboards and one who builds them. The fifty queries above are the catalog I keep for that purpose: copy, paste, narrow the time range, and adapt the field names to the log format you have. They cover the daily incident-investigation work, the monthly cost questions that always reach the engineering team, the security audits that come around every quarter, and the steady drumbeat of latency and capacity questions that no one ever stops asking.A few habits compound over time. Save the queries you find yourself rerunning, not in the console's saved-queries list but in version control alongside the code that emits the matching log lines. Document the handful of regex extractions your team relies on so they do not get re-derived from scratch every time someone new joins the rotation. And when you find yourself running the same scan repeatedly across long time ranges, take that as the cue to promote the query into a CloudWatch metric filter or, for higher-volume use cases, an Amazon Athena table backed by an exported S3 dataset. Logs Insights is the right tool for ad-hoc analysis; it is the wrong tool for durable, high-frequency dashboards, and the operational signal that someone is fighting the tool is usually a query that gets pasted into the same channel three times a week.
If you want a faster on-ramp into the query language itself, try the companion CloudWatch Logs Insights Query Builder tool, which ships with these queries pre-loaded. For broader AWS context, the AWS History and Timeline overview shows where CloudWatch Logs and the surrounding observability stack came from, the AWS Lambda timeline covers the runtime that produces most of the logs in the queries above, and the DKIM, SPF, DMARC setup with Amazon SES and Amazon Route 53 walkthrough produces a log stream that several of these queries can analyze directly.
References:
Analyzing log data with CloudWatch Logs Insights — Amazon CloudWatch User Guide
CloudWatch Logs Insights query syntax
Supported logs and discovered fields
CloudWatch Logs cross-account observability
Lambda function logging in CloudWatch Logs
VPC Flow Logs records
AWS WAF logging
CloudTrail log file examples
References:
Tech Blog with curated related content
Written by Hidekazu Konishi