Incident Triage Flowcharts - Network, DB, and Application Layer
First Published:
Last Updated:
The goal here is not to teach you how DNS, TCP, TLS, HTTP, application servers, or relational databases work. There are excellent books for that. The goal is to give you a small set of pre-decided answers to the question "given this symptom, what do I check next, and in what order?" Five flowcharts cover the five symptoms that account for most of the on-call pages I have ever taken: the site is down, the site is slow, the data looks wrong, a background job did not run, and someone cannot log in or cannot do something they expect to be allowed to do.
Each flowchart is built around the same six-layer mental model — DNS, TCP, TLS, HTTP, application, database — and uses the same vocabulary for tooling per layer. By the end of the article you should be able to walk a teammate through any of the five flows from memory, point at the layer where the symptom is being produced, and pick a recovery pattern without re-deriving the framework from first principles each time.
* The flowcharts and the recovery suggestions in this article were written from operational notes and independent research. They are intended as a structured starting point, not a definitive procedure for any specific environment. Tool flags, AWS service behaviors, and database-engine specifics evolve over time; verify the exact commands and outputs against the current documentation for your environment before relying on them in an incident. Some details — particularly the latest output formats of
dig, curl, openssl s_client, and EXPLAIN ANALYZE, and the AWS service quotas referenced in the recovery section — change over time, so re-check the official references before you depend on them.* For this article, no live AWS production environment was used. All command snippets are illustrative.
Table of Contents:
- 1. Introduction — How to Use This Article
- 2. The Layered Triage Mental Model
- 3. Common Tooling Per Layer
- 4. Flowchart 1 — "Site Is Down"
- 5. Flowchart 2 — "Site Is Slow"
- 6. Flowchart 3 — "Data Inconsistency"
- 7. Flowchart 4 — "Background Job Failure"
- 8. Flowchart 5 — "Auth / Permission Issue"
- 9. Recovery Patterns by Symptom
- 10. Documenting Triage Sessions — Postmortem Linkage
- 11. Common Pitfalls
- 12. Summary
- 13. References
1. Introduction — How to Use This Article
The five flowcharts in this article are not meant to be followed verbatim during an incident. Reading a flowchart node by node while a service is on fire is slower than reading the article when the service is healthy and remembering the shape of the diagram during the page. The right way to use this article is to read it once before the next incident, and then keep it open in a second tab during incident review afterwards.Three audiences benefit most from this material. The first is the on-call engineer who has been pulled in to investigate a symptom they did not write the code for, and who needs a default order of operations for ruling out layers. The second is the SRE or platform engineer building a runbook for their team, who needs a stock set of triage steps that can be parameterized with environment-specific tooling. The third is the technical lead who is teaching a less senior engineer how to debug — these flowcharts make the implicit "what would I check next" knowledge explicit.
A short note on what the flowcharts deliberately leave out. They do not include vendor-specific incident-management UI steps (PagerDuty acknowledgment, Opsgenie escalation policies, Statuspage updates) because those are organization-specific and change frequently. They do not include cost or pricing decisions, because those are orthogonal to triage and they are covered separately on this site. They do not include detailed remediation code, because remediation depends on the specific defect and is more naturally captured in a postmortem template than in a generic flowchart. The article ends with a short section on linking triage notes back to a postmortem so that the lessons survive past the incident.
If you have read AWS public RCAs before, you will recognize the same vocabulary in this article — blast radius, back-off, idempotency, static stability. The five flows are, in a sense, the customer side of the same decisions AWS makes when it writes its own service-event summaries. Section 10 connects the two by showing how to feed the output of a triage session into the postmortem template described in AWS Postmortem Case Studies — Design Lessons from AWS Public RCAs.
2. The Layered Triage Mental Model
Almost every incident I have triaged on a public-facing service can be located in one of six layers between the user and the data. The layers are well known individually; the value of the model is putting them in a strict outside-in order so that triage always proceeds in the same direction. Outside-in is the right direction because it follows the path a real request takes, and because the cheapest layers to test (DNS resolution, TCP reachability) are the ones at the outside.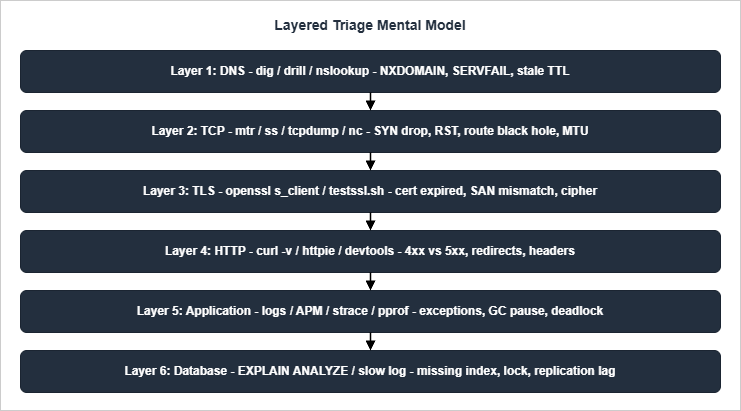
Two heuristics from the Google SRE book pair well with the layered model and are worth holding onto throughout the rest of the article. The first is "what touched it last": a working system tends to remain working until acted upon by an external force, so any recent deploy, configuration change, or capacity action should be the first hypothesis tested at whatever layer the symptom appears. The second is "what / where / why": once a layer has been identified as the failing one, ask in order what the layer is doing, where its resources are being spent, and why those resources are being spent that way. The two questions converge on a cause faster than open-ended hypothesis generation almost always does.
A third heuristic is borrowed from Brendan Gregg's USE method: for every resource on the path — a DNS resolver, a NAT gateway, an application server, a database — check Utilization, Saturation, and Errors. The three values fit on one line of a dashboard and tell you whether the layer is healthy without requiring you to remember every possible failure signature. Throughout the flowcharts below, "is layer X healthy" almost always reduces to a USE check on the resources owned by that layer.
3. Common Tooling Per Layer
The flowcharts in sections 4 through 8 reference command-line tools by name without explaining them. This section is the reference. For each layer I list the two or three tools I reach for first, the question they answer, and a representative invocation. None of the snippets are exhaustive; they are the version I would type during an incident, not a tutorial.3.1 DNS — dig, drill, nslookup
DNS questions reduce to "did the resolver return the answer I expected, from the authoritative nameserver I expected, with a TTL that makes sense?" dig is the canonical tool because it shows the response sections, the resolver path, and the TTL in one output.dig +trace +nodnssec example.com A
dig @8.8.8.8 example.com A +short
dig example.com NS +short
The first form walks the delegation chain from the root, which is invaluable when you suspect a parent-zone or NS-delegation problem; the second is the fastest "does Google's resolver agree with my own resolver" check; the third lists the nameservers responsible for the zone, which is what you compare with the registrar's records when a recently changed delegation is suspected.
drill is a drop-in alternative that some operators prefer for its terser output, and nslookup exists on every Windows host but should be considered a fallback rather than a first choice — it hides response codes that dig makes explicit.The most common failure modes worth being able to recognize on sight are
NXDOMAIN (the name does not exist), SERVFAIL (the resolver could not get a useful answer, often from an authoritative server outage or a DNSSEC validation failure), and a stale TTL — a record that was changed at the registrar but whose old value is still cached at intermediate resolvers. Stale TTL is the failure mode the flowcharts treat with the most care, because it produces the appearance of a partial outage that resolves itself over time and is therefore frequently misdiagnosed.3.2 TCP — mtr, ss, tcpdump, nc
TCP questions are about reachability and connection state. mtr is the right first tool because it combines traceroute and ping into a single live view that surfaces packet loss at intermediate hops; ss (or, on older systems, netstat) shows the local socket state; tcpdump is the tool of last resort when you need to see the actual packets on the wire.mtr --report --report-cycles 10 example.com
ss -tan | grep -E ':(80|443) '
nc -vz example.com 443
sudo tcpdump -ni any 'tcp port 443 and host example.com' -c 50
For a hung handshake,
mtr will show whether packets are reaching the remote host at all; if mtr is clean but nc cannot complete the connection, the next hypothesis is a security-group, NACL, or host-firewall rule blocking SYN packets at the destination. For a connection that establishes and then immediately drops, tcpdump will reveal an RST from one side, and the side that sent the RST is almost always the side with the misconfiguration. MTU black holes are rare on commodity networks but common on VPN and Direct Connect paths; the symptom is "small requests work, large ones hang", and the diagnostic is mtr --psize 1500.On AWS specifically, two services close the loop after the OS-level tools have narrowed the symptom down to "this connection is being blocked somewhere". VPC Flow Logs at the ENI, subnet, or VPC level record every accepted and rejected TCP/UDP flow with source, destination, port, action, and a per-record reason; a single
REJECT line with the matching five-tuple is usually proof that a security group or NACL is the cause, and the absence of any record at all means the packet never reached the ENI in question. Reachability Analyzer is the complementary configuration-time tool: it walks the security groups, NACLs, route tables, and gateway attachments between two ENIs (or between an ENI and an Internet Gateway) and returns the explicit allow or deny path, which is faster than reasoning about a multi-rule SG stack by hand and is the right next step once mtr is clean but nc still hangs.3.3 TLS — openssl s_client, testssl.sh, curl --resolve
TLS questions are dominated by certificates: is the certificate valid, does its SAN list include the hostname being requested, is the chain complete, and is the cipher set the client is offering compatible with what the server is willing to accept?openssl s_client -connect example.com:443 -servername example.com -showcerts </dev/null
echo | openssl s_client -connect example.com:443 -servername example.com 2>/dev/null \
| openssl x509 -noout -subject -issuer -dates -ext subjectAltName
curl --resolve example.com:443:203.0.113.10 https://example.com/ -v
The first form is the verbose handshake; the second is the abbreviated form I run during triage to check expiry and SAN coverage at a glance. The
--resolve flag on curl is the trick that lets you bypass DNS while still presenting the right SNI value to the server, which is essential when the question you are trying to answer is "does the server respond correctly when reached at this specific IP?" testssl.sh is worth installing for its enumerated cipher report, but it is too slow to be a first-stage triage tool.3.4 HTTP — curl -v, httpie, browser devtools
HTTP questions split cleanly by status-code class. 1xx are informational and 3xx are redirects, both rare on a normal request path; 2xx means the server processed the request; 4xx means the client sent something the server rejected (auth, malformed input, missing routing rule); 5xx means the server failed to produce a response (application crash, dependency outage, gateway timeout). The status code is therefore the first variable to read after a TLS handshake completes.curl -sS -o /dev/null -w '%{http_code} %{time_namelookup} %{time_connect} %{time_appconnect} %{time_starttransfer} %{time_total}\n' https://example.com/
curl -v -X POST https://example.com/api/orders -H 'content-type: application/json' -d '{"id":1}'
http -v GET example.com/healthz
The first form is the latency-breakdown shortcut and is worth memorizing, because it is the same shortcut the "site is slow" flowchart uses to assign blame to a specific layer. The fields, in order, are DNS lookup time, TCP connect time, TLS handshake time, time-to-first-byte (TTFB), and total time. Subtracting consecutive fields gives the per-layer cost.
httpie's http -v is friendlier than raw curl for examining headers when you have to read a 4xx response carefully.3.5 Application — logs, APM, strace, perf
The application layer is where standardized tooling stops and language-specific tooling begins. The two questions that matter most are "what was the application trying to do when the symptom appeared?" (answered from logs and APM traces) and "where is the application spending its time?" (answered from sampling profilers).# Tail the structured log and follow request IDs
aws logs tail /aws/lambda/order-processor --follow --filter-pattern 'requestId="abc-123"'
# Show what a hung process is doing
sudo strace -p $(pgrep -f order-processor) -e trace=network -tt
# Sample CPU for 30 seconds and produce a flame graph
sudo perf record -F 99 -a -g -- sleep 30 && sudo perf script | flamegraph.pl > flame.svg
In a Lambda or container environment the
strace step is rarely available; the equivalents are AWS X-Ray segments, container-native APM agents, or the language-specific profilers (pprof for Go, py-spy for Python, async-profiler for the JVM). In all cases the goal is the same: turn "the application is slow or wrong" into a per-function or per-span time budget that can be compared with a known-good baseline. For ad-hoc filtering of structured logs once the request ID is known, the queries in CloudWatch Logs Insights Query Cookbook are the catalog I reach for.3.6 Database — EXPLAIN ANALYZE, slow log, pg_stat_* / performance_schema
Database questions during triage almost always reduce to "is a specific query doing something different from what it did yesterday?" The right tool depends on the engine, but the shape of the answer is the same: read the query plan, read the slow log, and check the wait events.-- PostgreSQL
EXPLAIN (ANALYZE, BUFFERS) SELECT ... ;
SELECT * FROM pg_stat_activity WHERE state <> 'idle' ORDER BY query_start;
SELECT * FROM pg_stat_statements ORDER BY total_exec_time DESC LIMIT 20;
-- MySQL
EXPLAIN ANALYZE SELECT ... ;
SELECT * FROM performance_schema.events_statements_summary_by_digest
ORDER BY sum_timer_wait DESC LIMIT 20;
The two facts to extract from a plan are "is the engine using the index I expect?" and "how many rows does it think it will read versus how many it actually read?" A large mismatch between the planner estimate and the actual row count is almost always a stale-statistics or skewed-distribution problem, which is much more common than a query the optimizer simply cannot handle. Replication lag is the second thing to check on any read-replica path, because lag turns a "data is stale" symptom into a database-tier problem rather than an application-tier one.
For RDS and Aurora, the AWS-native equivalent of "read the slow log and the wait events at the same time" is RDS Performance Insights. It samples the active session count broken down by wait event (
IO:DataFileRead, Lock:transactionid, LWLock:lock_manager, Client:ClientRead, and so on) and by Top SQL, and the time-series view makes it possible to attribute a load spike to a specific query and a specific waiting condition without joining pg_stat_statements snapshots by hand. Enhanced Monitoring covers the OS-level metrics (per-process CPU, I/O, memory) that Performance Insights does not, so the two are complementary: Performance Insights for "which query is waiting on what?", Enhanced Monitoring for "is the host itself saturated?".4. Flowchart 1 — "Site Is Down"
The first flowchart covers the most common, most stressful, and most well-defined symptom: a user-facing service is returning errors or no response at all, and someone wants the site back. Because the symptom is binary, the flowchart is also binary at almost every node, which makes it the best first flowchart to internalize.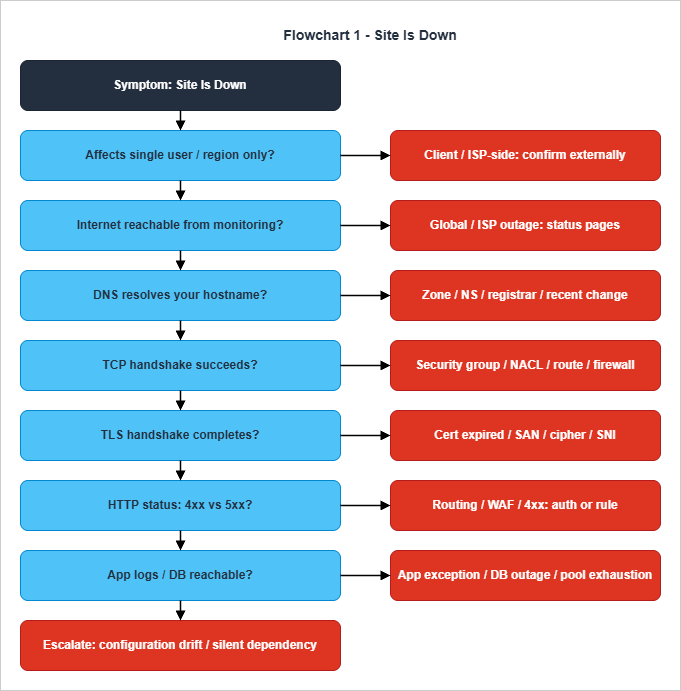
The HTTP node is where the flow widens slightly. A 4xx response splits further by sub-class: 401 and 403 push the flow into the auth flowchart in section 8; 404 and 410 push the flow into a routing or recently-deployed-rule investigation; 429 indicates rate limiting, which is its own diagnostic path centered on the source IP, the user identity, and the WAF or API Gateway throttle that owns the rule. A 5xx response is the canonical "the server tried and failed" branch, and it splits into the application log check (do logs show the failure?) and the database reachability check (is the dependency healthy?). One subtlety worth holding on to: a 502 or 504 from an upstream load balancer almost always means the application instance behind it has crashed, hung, or been taken out of service; the right next step is therefore not "look at the load balancer" but "look at the upstream target group health".
The bottom of the flow has a deliberate "escalate" terminal. If the symptom has reached this point — the network layers all check out, the application is reachable, the database is reachable, and the logs are clean — the failure is either in a code path that is not logging properly, in a third-party dependency the application calls without good observability, or in a configuration change that is not yet visible from outside. All three of those are signals that the on-call engineer should be paged into a higher-tier responder rather than continuing to walk a tree they have already exhausted. Knowing when to escalate is part of the triage skill, not an admission of defeat.
A note on parallelism. The flowchart looks sequential, but in practice an experienced engineer runs several nodes in parallel — a
dig and a curl -v from one window, a status-page check from another, a logs query in a third. The flowchart's job is to keep the engineer from skipping a node, not to force them to wait for one to finish before starting the next. The order matters because the lower-layer answers, once available, narrow the search space for everything above them.5. Flowchart 2 — "Site Is Slow"
Slowness is harder to triage than down because the symptom is not binary. A site that is "slow" might be uniformly slower for everyone, slower for a single endpoint, slower for a single region, or slower only at the long tail of the latency distribution while the median is unchanged. The single most useful instinct in the slow flowchart is therefore to ask, before anything else, "slow where?" — and to break end-to-end latency into the per-layer time budget that produced it.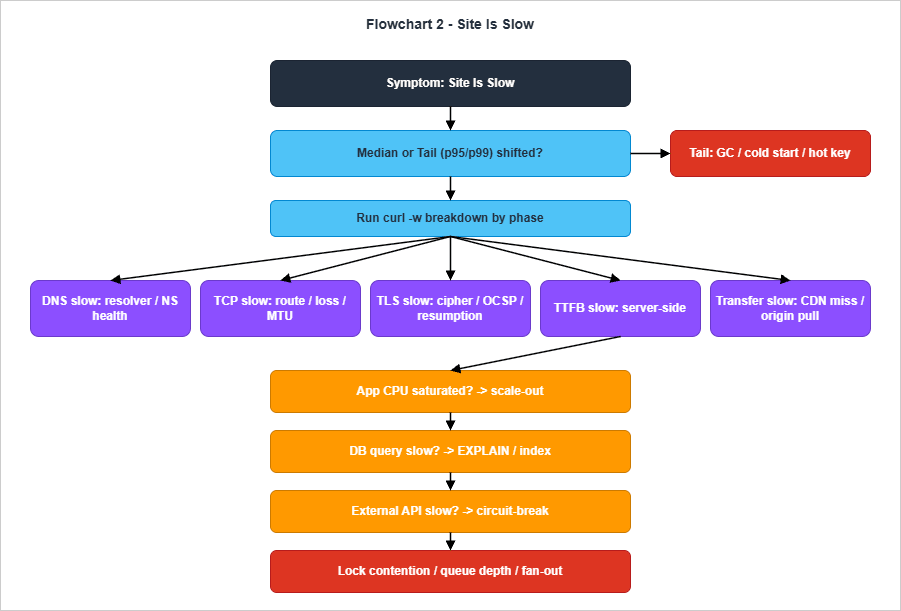
Once the median has been confirmed as slower, the
curl -w latency-breakdown invocation from section 3.4 becomes the workhorse. Run it three or four times against the affected endpoint and record the per-phase numbers. The five phases — DNS lookup, TCP connect, TLS handshake, TTFB, transfer — sum to the total, and one of them is almost always disproportionately large. The flowchart branches on which phase is dominant. DNS-bound slowness usually points at a misconfigured resolver or a recursive resolver that is not caching well; TCP-bound slowness almost always points at a routing issue (asymmetric path, MTU mismatch, packet loss); TLS-bound slowness is rare on modern stacks and usually means OCSP stapling is failing or session resumption has been disabled; TTFB-bound slowness is the catch-all for "the server took a long time to start replying"; and transfer-bound slowness almost always means a large response, a CDN cache miss, or an under-provisioned origin pull.The TTFB-bound branch is the interesting one because it is the most common, and because it has its own sub-flow. The three sub-questions are, in order, "is application CPU saturated?", "is the dominant database query slow?", and "is an outbound API call slow?" — and they deliberately appear in that order because that is the cheapest order to test. Application CPU is read from the system or container metrics; the dominant query is read from the slow log or
pg_stat_statements; the outbound API is read from the application's own client-side instrumentation, or from the egress logs of the NAT gateway or VPC. If all three answer "no", the remaining hypotheses are lock contention, queue depth, or a fan-out pattern in which the slow path is the slowest of N parallel calls.A useful sanity check at the end of the slow flow: "is the slowness reproducible with
curl against the same endpoint, with the same headers, from a known-good location?" If curl is fast and the user reports slow, the problem is at the user's edge — their ISP, their corporate proxy, a CDN PoP they happen to land on. If curl is also slow, the problem is server-side and the breakdown is correct. This single test eliminates a surprising number of incidents.6. Flowchart 3 — "Data Inconsistency"
Data-inconsistency symptoms are the hardest of the five to triage because they have the longest time-to-detect: by the time the user notices that a record looks wrong, the write that produced it may be hours or days in the past. The flowchart is therefore organized around two axes: scope (single record versus a class of records) and the recent change that may have introduced the inconsistency.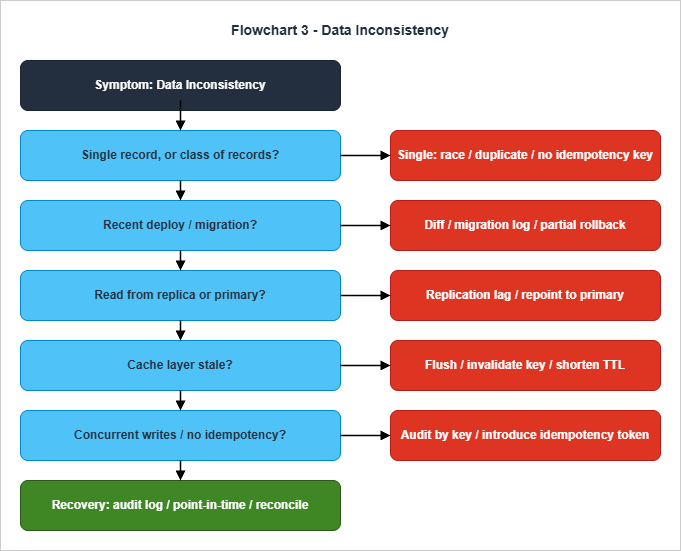
state column is the new enum value) almost always means a code change, a schema migration, a misconfigured background job, or a stale read replica being used as the source of truth. The same triage tools — audit logs, replication metrics, change-data-capture streams — are useful for both, but the ordering of the questions is different.The "recent change" branch deserves to be the second node because the prior probability that an inconsistency is caused by something that changed in the last day is overwhelmingly higher than the prior probability that it is caused by latent code that has been running unchanged for months. Reading the deploy log, the migration log, and the configuration-change history is therefore worth doing before any of the deeper hypotheses. If a migration ran and the symptom appeared at the same time, the migration is suspect until proven otherwise — and on most teams the right next step is a partial rollback of the migration combined with a hold on traffic for the affected entity.
The replica-versus-primary node catches the second-most-common cause of class-level inconsistency: a read path is hitting a replica that has fallen behind the primary. The diagnostic is direct: read the replication-lag metric for the database instance, and re-run the query against the primary to compare. If the primary returns the expected value, the symptom is replication lag and the remediation paths are either to wait, to fail the replica out of the read pool, or — if the lag is structural rather than transient — to reduce the read fan-out and re-architect the read path. The cache-staleness node catches the related case where a memcached or Redis layer has retained values past their natural expiry.
The bottom of the flow handles two recovery patterns that are easy to forget under pressure. The first is to use the audit log or change-data-capture stream as the source of truth: if the table can be reconstructed from a stream of writes, an inconsistent record is a bug in the materialization, not in the underlying state. The second is point-in-time recovery: most managed databases (RDS, Aurora, DynamoDB) support restore-to-point-in-time, and a forty-five-second recovery operation against a known-good timestamp is occasionally the fastest path to a clean state. Both patterns assume the team knows where the audit log lives and that the point-in-time recovery has been tested at least once before — neither is a good thing to learn during an incident.
7. Flowchart 4 — "Background Job Failure"
Background jobs fail differently from synchronous request paths because the failure is not visible to the user until the consequence catches up. By the time someone notices that the daily report is missing or that an order acknowledgment was never sent, the original failure is hours or days in the past and the surrounding system has continued to run. The flowchart is organized around the lifecycle of a job — was it triggered, did it run, did it succeed, was it retried — because each stage has its own diagnostic tools and its own cause set.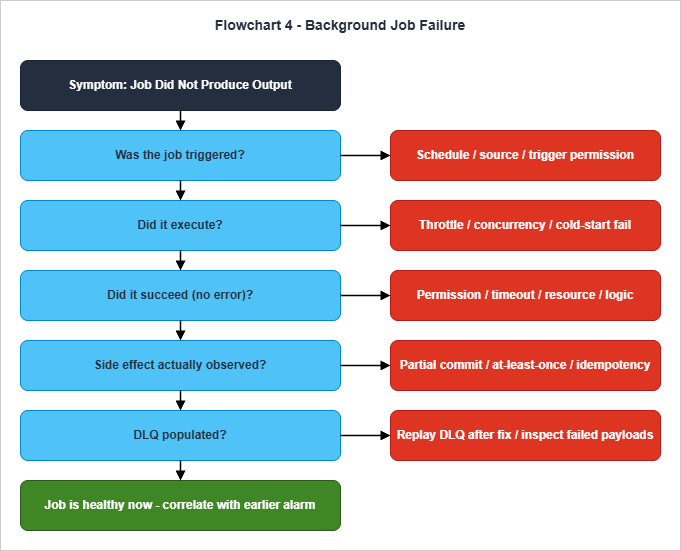
The second node — did the job actually execute — separates "the trigger fired but the consumer did not start" from "the consumer started and failed". Throttle limits, concurrency caps, and cold-start failures live here. AWS Lambda, for example, behaves differently per event source when reserved or account-level concurrency is exceeded: synchronous invokers receive a 429
TooManyRequestsException, asynchronous invokers buffer and eventually route to the on-failure destination or DLQ, poll-based event source mappings (SQS, Kinesis, DynamoDB Streams) back off and retry rather than drop, and EventBridge or scheduled targets follow the target's own retry policy and DLQ. The single symptom shared across these modes is "the trigger fired N times and only K invocations are visible in the logs", which is exactly the comparison the second node asks the engineer to make — the next step is to identify which mode applies and to inspect the matching artifact (response code, on-failure destination, source-side iterator age, or target DLQ). Once execution is confirmed, the third node classifies the error. Permission errors point at IAM (the function's execution role, the resource policy on the target service); timeouts point at the function's timeout configuration and the slow path inside it; resource limits point at memory, file-descriptor, or ENI exhaustion; logic errors point at the code itself.The fourth node is the one most often skipped, and the one that most frequently catches the incident I should have caught earlier. Even when a job appears to succeed, the side effect it was supposed to produce — the row written, the message sent, the file uploaded — may not have happened. The cause is almost always partial commit: the job acknowledged the trigger before the commit was durable, the commit was rolled back, or an at-least-once delivery semantics meant that an earlier execution already produced the side effect and the current execution treated it as a no-op. Idempotency keys are the canonical mitigation; absence of an idempotency key is, in practice, the single most common production-incident root cause among jobs that "ran successfully".
The DLQ check is the recovery-side companion of the same lifecycle. A populated DLQ is a concrete, replayable record of failed jobs — and after the underlying defect has been fixed, replaying the DLQ is a one-liner in most platforms. The symmetric failure mode is a DLQ that is configured but unread: failures are being captured silently, no alarm is firing, and the incident only surfaces when someone goes looking. Each background-job pipeline should have an alarm on DLQ depth in addition to one on error rate; the absence of the alarm is its own incident-prevention failure.
8. Flowchart 5 — "Auth / Permission Issue"
Authorization symptoms are deceptively close to authentication symptoms in their failure presentation, but they have entirely different remediations. The flowchart is organized around the split: first decide whether the user could not prove who they are, or proved who they are but is not allowed to do what they are trying to do; then walk the appropriate sub-flow.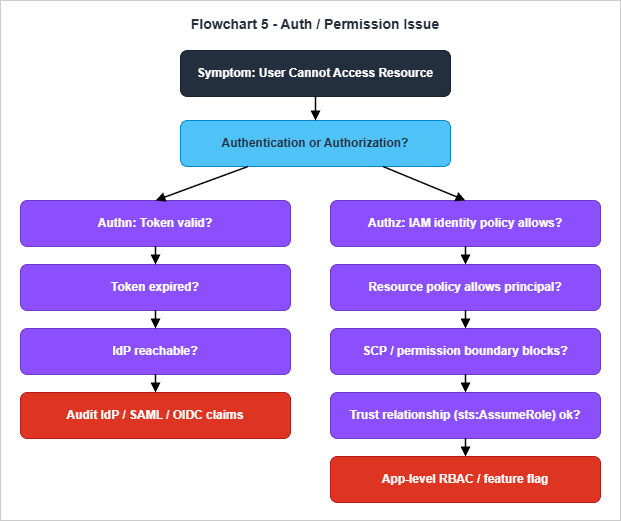
The authentication branch walks token state, expiry, and IdP availability. The token-validity check is the cheapest: most modern stacks make the bearer token visible in browser devtools or API Gateway logs, and a JWT can be decoded without verification to inspect its claims and expiry. An expired token has a one-line remediation — refresh it — and a thirty-second test for whether refresh is the issue. An IdP outage is rarer than an expired token but has a larger blast radius; the diagnostic is to attempt authentication from a separate device or account, and the remediation is to either wait, fail over to a secondary IdP, or temporarily route around the IdP for a known-good identity. The audit branch covers the long tail of misconfigured SAML assertions, missing OIDC claims, and clock-skew problems that cause valid tokens to look invalid.
The authorization branch is longer because AWS authorization is composed of layered policy evaluation. The order is deliberate: identity policy first, because it is the most local; then resource policy, because it is owned by the resource and frequently differs across accounts; then SCP and permission boundaries, because they are organizational guard rails that override identity-level grants; then the trust relationship, because role-assumption failures are uniquely confusing — they look like authorization failures but are actually a precondition for authentication into the target account. Application-level RBAC and feature flags are at the bottom because they are the rarest cause and the easiest one to verify in the application's own admin UI.
A few patterns from the flow are worth memorizing because they recur across incidents. AWS IAM evaluates with an explicit-deny-wins rule: an explicit
Deny anywhere in the evaluation chain (identity policy, resource policy, SCP, permission boundary, session policy) blocks the action regardless of any allow. The IAM Policy Simulator is a faster way to confirm "did the request actually fail because of a deny somewhere" than reading the policies by hand, and CloudTrail's errorCode and errorMessage fields name the policy type that produced the deny. For S3 in particular, the bucket policy and the object ACL are evaluated together with the IAM policy, and the most common surprise on legacy buckets is an object that was uploaded with a bucket-owner-full-control ACL missing — the bucket policy says "allow", but the object's ACL does not, and the request fails with a misleading error. Since April 2023 new S3 buckets are created with Object Ownership set to Bucket Owner Enforced and ACLs disabled by default, so this surprise is restricted to buckets that pre-date the change or have explicitly re-enabled ACLs; the IAM and bucket policies are then the only authorization surfaces. The same pattern surfaces in the routing checks at the front of the down flowchart: a 403 from CloudFront that originated at the edge points at WAF or a viewer-request Lambda@Edge; a 403 from CloudFront that originated at the origin points at the origin's own policy stack, not at CloudFront. The construction of those policy stacks is covered in detail in Building a Multi-Region CloudFront, S3, ACM, Lambda@Edge, and WAF Stack with CloudFormation.9. Recovery Patterns by Symptom
Once the triage has identified a probable cause, the recovery action is rarely a single command — it is a choice among a small set of patterns that vary by symptom. The summary diagram below gives one decision tree per symptom and is meant as a memory aid rather than as a binding procedure: the right recovery action in any specific incident is whatever the on-call engineer can execute safely with the highest probability of restoring service.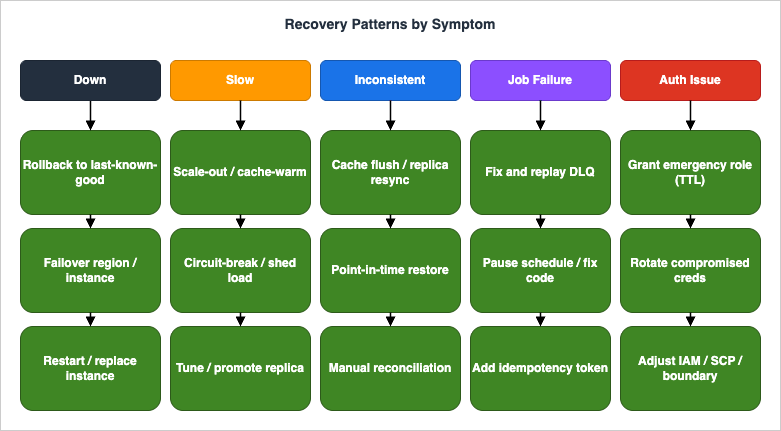
The "slow" recovery patterns split by the layer the slowness originated in. Application-tier slowness from CPU saturation is mitigated by horizontal scaling — and by tuning the autoscaling rules so that the next time the same load arrives the system reacts before users notice. Database-tier slowness is mitigated by query rewrites or index additions; the emergency variant is a temporary read-replica promotion or a query-cache pre-population. External-API slowness is mitigated by circuit-breakers and graceful-degradation paths in the application code; the emergency variant is a feature-flag flip that disables the slow path entirely. Cross-layer slowness — a thundering-herd retry storm, for example — is mitigated by load-shedding, exponential backoff, and admission control at the edge, and the emergency variant is to throttle inbound traffic at the load balancer or CDN until the system recovers.
The "inconsistent data" recovery patterns are the most varied because they depend on what artifact survived the inconsistency. If the audit log or change-data-capture stream is intact, the recovery is to replay the log against a known-good initial state — slow but deterministic. If the database supports point-in-time recovery, restoring a copy at a known-good timestamp and reconciling the divergence is faster but introduces a second-source-of-truth problem during the reconciliation window. Manual reconciliation is the recovery of last resort and is worth doing only when both the audit log and the point-in-time recovery are unavailable. The "background job" recovery is dominated by the DLQ pattern: fix the underlying defect, drain the DLQ, and add idempotency tokens to anything that does not already have them. The "auth" recovery is dominated by the emergency-grant pattern: temporarily widen access for a known operator while the root cause is investigated, with an automatic expiry on the temporary policy so it cannot be forgotten.
A pattern across all five symptoms: the recovery action that restores service is almost never the same as the action that prevents recurrence. Recovery actions are immediate, reversible, and aimed at availability; prevention actions are long-lived, structural, and aimed at the system's architecture. The next section ties the two together.
10. Documenting Triage Sessions — Postmortem Linkage
A triage session that ends with the service restored and no written record is a session whose lessons survive only as long as the engineer's memory. The discipline of writing those lessons down — not in a long retrospective, just in a structured triage note — is what converts a series of incidents into a body of operational knowledge.The minimum useful triage note has six fields, in the order they were generated during the incident. The first is the symptom as it was originally reported, in the original language of the report (the user's words, the alarm name, the page). The second is the layer where the failure was eventually located — DNS, TCP, TLS, HTTP, application, or database — drawn from the mental model in section 2. The third is the propagation path, written as a one-line arrow chain from the trigger to the user-visible symptom. The fourth is the recovery action that restored service. The fifth is the timestamp range, in UTC, for the entire incident. The sixth is the open question or follow-up the incident produced, recorded specifically so that it survives into the postmortem.
Symptom:         "checkout 502s for ~5% of requests" (PagerDuty alert P-12345)
Layer:           Application (order-service)
Propagation:     deploy v1.42 -> connection-pool default reduced -> pool exhaustion under load -> 502 from ALB
Recovery:        rolled back to v1.41 at 14:07 UTC
Window:          2026-04-26T13:51Z - 2026-04-26T14:07Z
Open question:   why was the pool default change merged without a load test?
A note in this shape takes about three minutes to write while the incident is still fresh, and it is the single most useful artifact for the next on-call engineer who sees a similar symptom. It is also the seed of the postmortem: the propagation line becomes the timeline, the open question becomes the remediation, and the layer field becomes the category for trend analysis across multiple incidents.
The site's AWS Postmortem Case Studies — Design Lessons from AWS Public RCAs walks through the longer-form postmortem template I use after the immediate incident is resolved. The two artifacts compose: the triage note is what is written during and immediately after the incident, when the on-call engineer's memory is fresh and the cost of writing is minimal; the postmortem is what is written a day or two later, when the team has the bandwidth to extract the architectural lesson and to commit to a remediation. Skipping the triage note in favor of "we will write the postmortem next week" is the single most common reason postmortems are thin on detail when they finally get written. The flowcharts in this article are designed to make the triage note almost write itself: each terminal node names the layer and the cause class, and each remediation branch names the recovery action.
11. Common Pitfalls
Five anti-patterns recur across the incidents I have reviewed for this article, and they are worth naming explicitly because they are easier to avoid when they have a label.The first is diagnosing from logs alone. Logs are useful but lossy: they show what the application chose to write down, not what actually happened, and they are biased toward paths the developer thought to instrument. A triage session that consists of nothing but log queries is one that has skipped the lower-layer checks in the flowcharts. The remedy is to ask, before opening the log query tool, "have I confirmed the request reached the application at all?" — a question that requires a
curl or a load-balancer access log, not an application log.The second is forgetting to check status pages before investigating. AWS, Cloudflare, GitHub, Stripe, and every other major dependency publish a status page, and a known-degraded dependency turns an hour of investigation into a five-second confirmation. The flowchart in section 4 includes status-page checks at the second node specifically because skipping it is the most common time-waster I have seen. The corollary is that a dependency you do not have a status-page subscription for is a dependency whose outage will surprise you; the prevention is to enumerate dependencies during architecture review and to subscribe to all of them.
The third is deploying during an active incident. The instinct to fix the bug while the incident is still running is strong and almost always wrong. A deploy during an active incident introduces a second variable into the experiment, makes rollback more complicated if the deploy itself is broken, and frequently produces a follow-on incident from a not-fully-tested change made under stress. The discipline is to either roll back to a known-good version or to apply a configuration-only mitigation (a feature flag, a traffic-shaping rule); code changes should wait for the incident to be stable.
The fourth is trusting "healthcheck OK" as proof of health. A health check that returns 200 from
/healthz only proves that the load balancer can reach the application's lightest endpoint. It does not prove that the application can reach its database, that its outbound API client is working, or that it can complete a real request. Health checks should be deep enough to exercise the dependencies that matter — a "deep health check" that includes a database round-trip and a cache touch is worth ten times its weight in shallow checks. The same principle applies to synthetic monitoring: a synthetic that hits one endpoint is one tenth as useful as a synthetic that hits the user's full journey.The fifth is acting on correlation as if it were causation. Two events that started at the same time are almost certainly related; whether one caused the other is a separate question that requires evidence. The flowcharts are organized to elicit causal evidence — the propagation line, the layer terminal — rather than correlation. The discipline is to ask, for any candidate cause, "what evidence would change my mind?" — and to find that evidence before declaring the incident root-caused. The Google SRE book's warning about cognitive biases is the canonical reference for this, and "when you hear hoofbeats, think of horses, not zebras" is the one-line summary worth keeping at the top of the runbook.
12. Summary
The five flowcharts in this article are not a comprehensive incident-response procedure; they are a memory aid for the parts of the procedure that are easy to forget under stress. The mental model in section 2 — DNS, TCP, TLS, HTTP, application, database — is the spine. The tooling in section 3 is the vocabulary. The flowcharts in sections 4 through 8 are the default order of operations for the five symptoms that account for most production pages. The recovery patterns in section 9 are the small set of choices that follow once a cause has been identified, and the documentation discipline in section 10 is what converts the lessons into long-lived operational knowledge.If only one thing from this article survives the next reading, let it be the heuristic from section 2: outside-in. The cheapest layers to test are the ones at the outside — DNS, TCP, TLS, HTTP — and they eliminate the largest parts of the search space when they answer cleanly. Walking the layers from the outside in is what separates the engineer who finishes triage in fifteen minutes from the engineer who is still looking at the database after an hour.
13. References
- Site Reliability Engineering — Chapter 12: Effective Troubleshooting (Google SRE Book)
- Brendan Gregg — The USE Method
- AWS Documentation — IAM Policy Evaluation Logic
- PostgreSQL Documentation — Using EXPLAIN
- CloudWatch Logs Insights Query Cookbook — Practical Recipes for Incident Investigation, Cost Analysis, and Security Audits
- Building a Multi-Region CloudFront, S3, ACM, Lambda@Edge, and WAF Stack with CloudFormation
- AWS Postmortem Case Studies — Design Lessons from AWS Public RCAs
References:
Tech Blog with curated related content
Written by Hidekazu Konishi