AWS Observability Architecture Guide - End-to-End Tracing, Metrics, and Logs with CloudWatch, X-Ray, Application Signals, and OpenTelemetry
First Published:
Last Updated:
This guide is a Level 400 implementation walkthrough. Rather than describing each service, it instruments one named reference architecture — a serverless-plus-container order system — with a single observability stack built from Amazon CloudWatch, AWS X-Ray, CloudWatch Application Signals, and the AWS Distro for OpenTelemetry (ADOT). We wire up instrumentation across AWS Lambda and Amazon ECS on Fargate, propagate trace context and correlation IDs across asynchronous hops, define SLOs and composite alarms, and finish by diagnosing a single latency incident from metric to trace to log.
This article is the operations companion to two implementation guides in the same series: the serverless system in Event-Driven Serverless Architecture on AWS and the container system in Amazon ECS on Fargate Microservices Architecture Guide. Vocabulary is delegated to the AWS Observability Glossary, the deep collection of query patterns to the CloudWatch Logs Insights Query Collection, and the service's own evolution to the AWS History and Timeline of Amazon CloudWatch. This piece stays on the architecture: how the pieces fit, how a request flows through them, and how you operate the result.
A note on cost: telemetry is billed primarily by ingestion and storage volume, and pricing changes frequently, so this guide deliberately contains no price figures. Where a design decision has a cost dimension, it is described qualitatively (sampling rate, retention, cardinality), and you should confirm current numbers in the official AWS Pricing pages linked in the References.
1. Why Cross-Service Correlation Is the Real Problem
A single-service view is easy. CloudWatch already publishes LambdaDuration, Errors, and Throttles; ECS already publishes CPU and memory utilization; X-Ray already draws a service map. The difficulty appears the moment a request crosses a boundary you do not control end to end — a synchronous API call becomes an event, the event is buffered in a queue, the queue is drained by a container task, and the task writes to a database. Each hop is observable on its own, but the connective tissue — "this slow database query belongs to that customer's checkout, which entered through that API request" — is what you have to engineer deliberately.Three properties make that tissue work, and this guide is organized around building all three:
- A shared identity for one request. A trace ID (and a human-friendly correlation ID) created at ingress must survive every hop, including asynchronous ones, so that metrics, logs, and trace segments can all be filtered to the same request.
- A single collection path. Rather than bolting on a different agent per runtime, we standardize on OpenTelemetry-based instrumentation through ADOT, so Lambda and Fargate emit the same kind of telemetry into the same backends.
- An operating model above raw signals. Humans do not watch dashboards all day; they respond to SLO burn and to a small number of high-signal alarms. Application Signals provides the SLO layer, and composite alarms keep the alarm count sane.
Get these right and the "three pillars" stop being three tools and become three views of the same request.
There is a tension running underneath all of this: fidelity versus volume. You could trace every request, log every field, and emit a metric for every dimension — and you would drown in data and ingestion volume. The art is to keep full fidelity where it is cheap and on demand (100% of spans as logs, retrievable when you need them) and aggregate everywhere else (low-cardinality metrics, sampled trace summaries, structured logs at the right level). Each section below makes that trade explicitly, which is why the same architecture can stay both deeply observable and operationally sustainable.
2. The Reference Architecture at a Glance
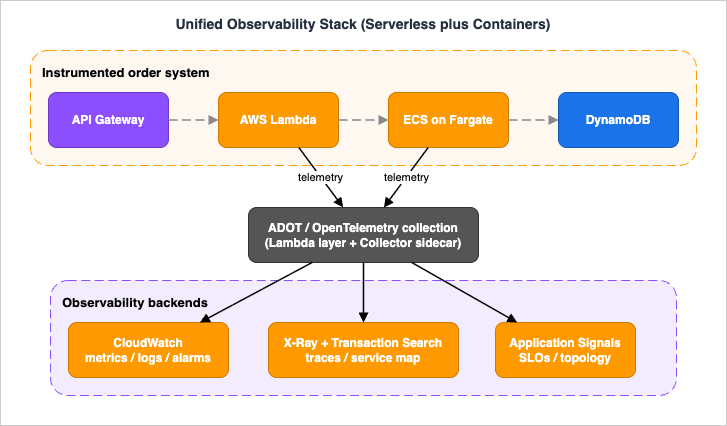
The system under observation is an order-processing pipeline. A client submits an order through Amazon API Gateway; a Lambda function validates and accepts it, returning quickly while publishing a domain event to Amazon EventBridge; the event is buffered through Amazon SQS and drained by a containerized worker running on Amazon ECS on Fargate behind an Application Load Balancer; the worker persists state to Amazon DynamoDB, and a longer multi-step fulfillment is coordinated by AWS Step Functions. This is intentionally the union of the serverless and container reference architectures from the two companion articles, because real observability problems live exactly at the seam between those two worlds.On top of that system we layer one observability stack. ADOT provides the instrumentation and collection layer — an OpenTelemetry Lambda layer for the functions and an ADOT Collector sidecar for the Fargate tasks. The collected telemetry fans out to three backends: CloudWatch holds metrics, logs, dashboards, and alarms; X-Ray holds traces and the service map, with Transaction Search capturing spans as structured logs; and CloudWatch Application Signals sits on top, auto-discovering services, drawing a topology map, and tracking SLOs.
- Amazon API Gateway — ingress; with active tracing it starts the trace and applies the root sampling decision.
- AWS Lambda — synchronous accept plus asynchronous workers; instrumented with the OpenTelemetry/ADOT Lambda layer and AWS Lambda Powertools.
- Amazon EventBridge / Amazon SQS — the asynchronous backbone; the point where trace context must be carried in the message, not inferred.
- Amazon ECS on Fargate — the long-running worker; instrumented with an ADOT Collector sidecar and the CloudWatch agent for Application Signals.
- Amazon DynamoDB / AWS Step Functions — downstream state and orchestration; both appear as nodes on the service map.
- ADOT — instrument once, send traces and metrics to multiple AWS backends.
- CloudWatch / X-Ray / Application Signals — metrics-logs-alarms, traces, and the SLO/topology layer respectively.
Two things are worth noting before we instrument anything. First, several of these services emit useful telemetry natively, before you add a line of code: API Gateway can write access logs and execution metrics, Lambda publishes
Duration, Errors, Throttles, and ConcurrentExecutions, SQS publishes ApproximateAgeOfOldestMessage, and DynamoDB publishes throttling and latency metrics. Instrumentation adds the cross-service correlation that these per-service metrics lack. Second, the architecture mixes choreography (EventBridge fan-out) with orchestration (Step Functions); both can participate in a trace, but Step Functions in particular benefits from active tracing so the state machine appears as a first-class node on the service map rather than an opaque gap.3. Instrumentation Across Serverless and Containers
Instrumentation is where a Level 400 observability design is won or lost, because it determines whether the later sections even have correlated data to work with. AWS gives you three instrumentation setups, and choosing deliberately matters.3.1 The Three Instrumentation Setups
Per the official Application Signals documentation, there are three supported setups, and they are not equivalent:- ADOT SDK with the CloudWatch agent (recommended). This delivers the most integrated APM experience: out-of-the-box integration with Container Insights and CloudWatch Logs, runtime metrics, and — importantly — metrics on 100% of traffic regardless of trace sampling rate, because Application Signals computes them from the agent rather than from sampled traces.
- The OpenTelemetry SDK with the OpenTelemetry Collector. Best when you already run upstream OpenTelemetry, or when your language is not covered by ADOT (the docs name Erlang and Rust). You get metrics on 100% of traffic only at a 100% sampling rate.
- The AWS X-Ray SDK with the X-Ray daemon (legacy). Appropriate only if you are already on the X-Ray SDK and have not migrated. AWS now documents migration paths from the X-Ray SDK to OpenTelemetry for each language, so treat this path as legacy and OpenTelemetry as the forward direction.
The feature comparison from the official docs is worth internalizing:
* You can sort the table by clicking on the column name.
| Capability | ADOT SDK + CloudWatch agent | OTel SDK + OTel Collector | X-Ray SDK + daemon |
|---|---|---|---|
| AWS support | Yes | Only for data sent to AWS | Yes |
| Non-standard language support | No | Yes | No |
| Container Insights integration | Yes | No | No |
| Out-of-the-box CloudWatch Logs | Yes | No | No |
| Out-of-the-box runtime metrics | Yes | No | No |
| Metrics on 100% of traffic | Yes | Only at 100% sampling | Only at 100% sampling |
For this reference architecture we choose the ADOT + CloudWatch agent path, and treat OpenTelemetry as the lingua franca so that a future move to upstream OTel or a third-party backend is a configuration change, not a re-instrumentation.
3.2 Instrumenting the Serverless Tier (Lambda)
For Lambda, ADOT ships an OpenTelemetry Lambda layer that packages the OpenTelemetry SDK and a Collector running as a Lambda extension, enabling auto-instrumentation and export of traces without code changes. The simplest production-grade path is to enable Application Signals for the function, which attaches the OpenTelemetry layer and wires the function into the Application Signals service map and SLOs.A minimal AWS SAM definition that turns on active tracing and attaches the layer looks like this:
Resources:
  AcceptOrderFunction:
    Type: AWS::Serverless::Function
    Properties:
      Runtime: python3.12
      Handler: app.handler
      Tracing: Active            # X-Ray active tracing on the function
      Layers:
        # AWS-managed OpenTelemetry/ADOT layer for the chosen runtime/region
        - !Sub arn:aws:lambda:${AWS::Region}:ACCOUNT:layer:AWSOpenTelemetryDistro:VERSION
      Environment:
        Variables:
          AWS_LAMBDA_EXEC_WRAPPER: /opt/otel-instrument   # auto-instrument wrapper
          OTEL_PROPAGATORS: tracecontext,baggage,xray     # W3C + X-Ray propagation
          POWERTOOLS_SERVICE_NAME: order-accept
          POWERTOOLS_METRICS_NAMESPACE: OrderSystem
  AcceptOrderApi:
    Type: AWS::Serverless::Api
    Properties:
      StageName: prod
      TracingEnabled: true       # API Gateway active tracing starts the trace
On top of auto-instrumentation, AWS Lambda Powertools gives you the application-level signals that auto-instrumentation cannot infer: structured JSON logging with the trace ID injected automatically, custom business metrics via the Embedded Metric Format (EMF), and explicit subsegments. The Powertools logger, tracer, and metrics utilities share one service name so that logs, traces, and metrics line up:
from aws_lambda_powertools import Logger, Tracer, Metrics
from aws_lambda_powertools.metrics import MetricUnit

logger = Logger(service="order-accept")
tracer = Tracer(service="order-accept")
metrics = Metrics(namespace="OrderSystem", service="order-accept")

@metrics.log_metrics                 # flush EMF metrics at the end of the invocation
@logger.inject_lambda_context        # add request/trace context to every log line
@tracer.capture_lambda_handler       # open a segment for the handler
def handler(event, context):
    order = parse(event)
    # A correlation ID that humans can paste into a search box.
    correlation_id = order.get("orderId")
    logger.append_keys(correlation_id=correlation_id)

    with tracer.provider.in_subsegment("validate-order") as sub:
        sub.put_annotation("order_id", correlation_id)   # indexed, filterable in X-Ray
        validate(order)

    metrics.add_metric(name="OrdersAccepted", unit=MetricUnit.Count, value=1)
    logger.info("order accepted")
    publish_event(order, correlation_id)   # see 3.4 for context propagation
    return {"statusCode": 202, "body": "accepted"}
order_id is added both as a structured log key and as an X-Ray annotation, so you can pivot from a trace to its logs and back. Second, the function returns 202 Accepted immediately and pushes work onto the asynchronous backbone, which is exactly where trace context is most likely to break (Section 3.4).3.3 Instrumenting the Container Tier (ECS on Fargate)
For Fargate, the ADOT Collector runs as a sidecar container in the same task definition as the application, and the CloudWatch agent provides the Application Signals integration. The application container is auto-instrumented with the ADOT SDK for its language; the sidecar receives spans and metrics over OTLP and exports them to X-Ray and CloudWatch. A trimmed task definition shows the shape:{
"family": "order-worker",
"networkMode": "awsvpc",
"requiresCompatibilities": ["FARGATE"],
"containerDefinitions": [
{
"name": "worker",
"image": "ACCOUNT.dkr.ecr.REGION.amazonaws.com/order-worker:latest",
"environment": [
{ "name": "OTEL_EXPORTER_OTLP_ENDPOINT", "value": "http://localhost:4317" },
{ "name": "OTEL_PROPAGATORS", "value": "tracecontext,baggage,xray" },
{ "name": "OTEL_SERVICE_NAME", "value": "order-worker" }
],
"dependsOn": [{ "containerName": "adot-collector", "condition": "START" }]
},
{
"name": "adot-collector",
"image": "public.ecr.aws/aws-observability/aws-otel-collector:latest",
"command": ["--config=/etc/ecs/ecs-default-config.yaml"],
"user": "0"
}
]
}
localhost:4317 (the OTLP gRPC port on the sidecar), so the application code is backend-agnostic — it speaks OpenTelemetry, and the Collector decides where data goes. This is the same property that makes a later switch to upstream OTel or a third-party backend a Collector-config change rather than an application change.If the container tier runs on Amazon EKS instead of (or alongside) Fargate, the equivalent one-step path is the Amazon CloudWatch Observability EKS add-on (
amazon-cloudwatch-observability), which installs the CloudWatch agent and Fluent Bit and enables both Container Insights and Application Signals, with IAM granted through EKS Pod Identity (recommended), a node instance role, or an IAM role for a service account (IRSA).3.4 Propagating Trace Context and Correlation IDs
Within a synchronous call chain, propagation is automatic: the instrumentation injects atraceparent header (W3C Trace Context) or the X-Ray X-Amzn-Trace-Id header, and the next service reads it. The OTEL_PROPAGATORS: tracecontext,baggage,xray setting above configures a composite propagator so the system understands both formats, which matters because API Gateway and some AWS integrations speak the X-Ray header while OpenTelemetry defaults to W3C.The trap is the asynchronous hop. When Lambda publishes to EventBridge and the event is buffered in SQS, there is no HTTP header to carry context automatically for your application spans — the producer and consumer are decoupled in time. You must carry the context yourself, by writing it into the message and reading it back out:
from opentelemetry import propagate
from opentelemetry.trace import get_current_span

def publish_event(order, correlation_id):
    carrier = {}
    propagate.inject(carrier)            # serialize traceparent into a dict
    detail = {
        "orderId": correlation_id,
        "correlationId": correlation_id,
        "_otel": carrier,                # carry W3C context in the event payload
        "payload": order,
    }
    eventbridge.put_events(Entries=[{
        "Source": "order.accept",
        "DetailType": "OrderAccepted",
        "Detail": json.dumps(detail),
    }])
extract the carrier and start the next span as a child of the original trace, so the asynchronous segment links back into the same end-to-end trace instead of starting a fresh, orphaned one:from opentelemetry import propagate, trace
def handle_message(record):
detail = json.loads(record["body"])
ctx = propagate.extract(detail.get("_otel", {})) # rebuild the parent context
tracer = trace.get_tracer("order-worker")
with tracer.start_as_current_span("process-order", context=ctx) as span:
span.set_attribute("order_id", detail["orderId"])
persist(detail["payload"])
3.5 What Auto-Instrumentation Cannot See
Zero-code instrumentation gives you the skeleton — HTTP server and client spans, AWS SDK calls, database calls — for free, and for many services that is enough. What it cannot infer is business meaning: which tenant this request belongs to, that "checkout" is a distinct operation from "browse", or that a particular code path is the expensive one. That is why the reference architecture still writes a small amount of manual instrumentation: a custom subsegment around a critical block, an annotation carrying the order ID, and a structured log line at a decision point. The guideline is to let auto-instrumentation cover the plumbing and to add manual spans and attributes only where they answer a question you will actually ask during an incident. Over-instrumenting is its own failure mode — every custom span and attribute is data you ingest, store, and pay to keep.4. Distributed Tracing with X-Ray and OpenTelemetry
With instrumentation in place, tracing turns the architecture into a navigable map. This section covers the trace data model, sampling (including why 100%-visibility features exist), and how a single request is reconstructed across services.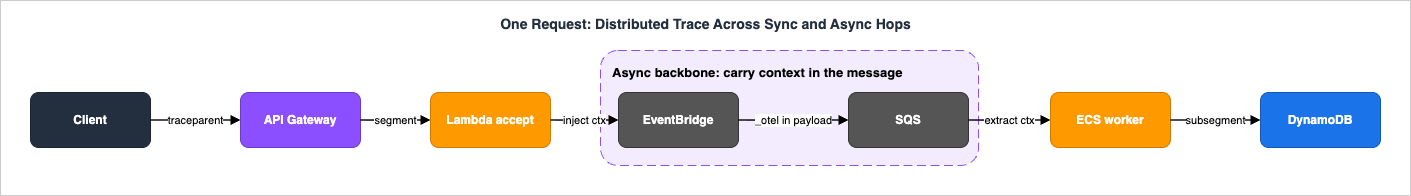
4.1 Segments, Subsegments, and the Service Map
A trace is a tree of segments (one per service) and subsegments (units of work inside a service, such as a DynamoDB call or an outbound HTTP request). X-Ray aggregates segments across requests into a service map — a topology of nodes and edges annotated with latency, request rate, and error/fault rates. The service map is the entry point for diagnosis: it shows you where a problem is before you open a single trace, and Application Signals builds an enriched version of the same map automatically once services are instrumented.Annotations (indexed, filterable key-values) and metadata (non-indexed context) are how you make traces queryable by business identity. The
order_id annotation added in Section 3.2 lets you find the exact trace for a customer complaint, instead of scrolling through thousands of anonymous traces.Beyond manual inspection, X-Ray Insights analyzes trace data automatically to detect anomalies — when a node's fault rate exceeds its expected range — identifies a probable root cause, and tracks the incident from creation to closure. Insights are enabled per X-Ray group and can notify Amazon EventBridge, so an emerging fault can trigger an SNS alert or a Lambda remediation without a human watching the map.
One distinction the map encodes is worth internalizing: X-Ray separates errors (client-side, typically 4xx), faults (server-side, typically 5xx), and throttles. A red edge that is mostly throttles points at a capacity or quota problem; one that is mostly faults points at a code or dependency failure; one that is mostly errors may simply be clients sending bad requests. Reading the color of an edge before opening a single trace often tells you which of the three classes of problem you are dealing with.
4.2 Sampling: Reservoir, Fixed Rate, and Parent-Based Decisions
Tracing every request at full fidelity is rarely necessary and is a cost lever, so X-Ray samples. Per the official documentation, the default behavior records the first request each second (the reservoir) plus 5% of additional requests. Sampling rules — configured centrally in the X-Ray console so you do not redeploy to change them — match on attributes like service name, HTTP method, URL path, and host, and each rule has a priority, a fixed rate, and a reservoir size.A custom rule is a small JSON document; this one keeps a higher floor on checkout traffic while sampling the rest at a modest rate:
{
  "RuleName": "checkout-high-visibility",
  "Priority": 100,
  "ResourceARN": "*",
  "ServiceName": "order-accept",
  "HTTPMethod": "POST",
  "URLPath": "/checkout",
  "ReservoirSize": 5,
  "FixedRate": 0.10,
  "Version": 1
}
GetSamplingTargets to receive an allotted quota from X-Ray, which spreads the reservoir evenly across all instances of a service instead of letting one host consume it. That is what keeps sampling stable as you scale horizontally.Two properties of X-Ray sampling are essential to a multi-service design:
- Sampling is parent-based. The first X-Ray-enabled service handling a request makes the decision, and downstream services honor it. This is why a trace is either captured whole or not at all, rather than fragmented — but it also means the root's configuration governs the entire trace.
- Adaptive sampling exists for incidents. AWS X-Ray adaptive sampling adds Sampling Boost (automatically raising sampling rates when anomalies are detected) and Anomaly Span Capture (capturing critical spans even when the full trace is not sampled), so short-lived problems are less likely to slip between sampled requests. Adaptive sampling builds on the ADOT SDK and Application Signals.
4.3 Transaction Search: 100% of Spans as Structured Logs
Sampling creates a blind spot: the request you most want to investigate may not have been sampled. Transaction Search closes that gap. When enabled, it switches X-Ray span ingestion into a mode that stores 100% of spans as structured logs in a CloudWatch Logs log group namedaws/spans, in OpenTelemetry semantic-convention format, while indexing a configurable percentage of those spans as X-Ray trace summaries. By default the indexing percentage is 1%, and you can raise it.Because the spans land in CloudWatch Logs, you unlock log-native capabilities on trace data — metric filters, subscription filters, and data masking — and you can run free-form analytics over every span, not just sampled ones. Transaction Search also powers Application Signals. The indexing rate is managed declaratively:
Resources:
  TxnSearch:
    Type: AWS::XRay::TransactionSearchConfig
    Properties:
      IndexingPercentage: 5     # 0-100; spans are still ingested at 100% as logs
Operationally, the indexing percentage is the dial you turn against your investigation needs: a low rate keeps the service map and trace search populated cheaply for routine work, and you raise it when you need a denser sample — during a launch, a load test, or an active incident. Because the underlying spans are always retained as logs, raising the index rate changes how much is summarized, not how much is captured.
4.4 X-Ray and OpenTelemetry: One Direction of Travel
ADOT is the AWS-supported distribution of OpenTelemetry: you instrument once and send traces and metrics to multiple backends — X-Ray, CloudWatch, Amazon OpenSearch Service, Amazon Managed Service for Prometheus, and partner tools — with the same SDK. AWS now publishes per-language migration guides from the X-Ray SDK to OpenTelemetry (for example, replacing the X-Ray SDK with the OpenTelemetry SDK plus anOTLPTraceExporter and the AWSXRayPropagator). The practical guidance is unambiguous: new systems should standardize on OpenTelemetry, and existing X-Ray SDK systems have a documented path forward. Treating OpenTelemetry as the instrumentation contract is what keeps this architecture portable.The piece that makes this portability real is the Collector. Whether it runs as a Lambda extension or a Fargate sidecar, the ADOT Collector is a pipeline of receivers, processors, and exporters: it receives OTLP from the application, processes spans and metrics (batching, adding resource attributes that identify the AWS resource), and exports them to AWS backends. A minimal pipeline shape looks like this:
receivers:
  otlp:
    protocols:
      grpc:        # the application sends to localhost:4317
processors:
  batch:           # buffer and batch to reduce request volume
exporters:
  awsxray:         # traces to X-Ray
  awsemf:          # metrics to CloudWatch via EMF
service:
  pipelines:
    traces:  { receivers: [otlp], processors: [batch], exporters: [awsxray] }
    metrics: { receivers: [otlp], processors: [batch], exporters: [awsemf] }
5. Metrics and Structured Logs
Traces tell you about individual requests; metrics and logs tell you about populations and details. The design goal is to make all three pivot on the same identity.5.1 Structured Logs as the Substrate
Every log line should be structured JSON carrying the trace ID and correlation ID, because that is what lets you jump from a trace straight to its logs. The Powertools logger does this automatically onceinject_lambda_context is applied; for containers, configure the logging library to emit JSON and include the active trace ID. Deep query patterns over these logs — how to write efficient Logs Insights queries, parse fields, and build dashboards from them — are covered in the CloudWatch Logs Insights Query Collection, so this guide does not duplicate them; the architectural point is only that logs must be structured and trace-aware to participate in correlation.It helps to treat the log schema as a contract: every line should carry at least a timestamp, a level, the service name, the
trace_id, and the correlation ID, with the message and any event-specific fields as additional keys. Once that contract holds across both tiers, a single query can follow one request from the Lambda accept function into the Fargate worker, and dashboards built on those fields keep working as the code changes. The inverse — free-text logs with no shared keys — is what forces the slow, manual correlation this whole architecture exists to avoid.5.2 EMF: Metrics Born from Logs
The CloudWatch Embedded Metric Format (EMF) lets you emit a structured log event from which CloudWatch automatically extracts metric values, so a high-throughput function can record business metrics without a separate synchronousPutMetricData call on the request path. An EMF document is JSON with an _aws metadata member containing a CloudWatchMetrics array of directives; the official specification caps an EMF document at 1 MB, and the Powertools metrics utility supports up to 100 metrics per EMF object. A hand-written EMF document makes the structure concrete:{
"_aws": {
"Timestamp": 1718841600000,
"CloudWatchMetrics": [
{
"Namespace": "OrderSystem",
"Dimensions": [["service", "operation"]],
"Metrics": [{ "Name": "OrderLatency", "Unit": "Milliseconds" }]
}
]
},
"service": "order-accept",
"operation": "checkout",
"orderId": "ord-8a1f",
"OrderLatency": 142
}
_aws directive and extracts OrderLatency as a metric keyed by the low-cardinality service and operation dimensions, while orderId stays in the log event as a searchable field rather than a dimension. EMF is the right tool for custom business metrics (orders accepted, items fulfilled) because it folds the metric into the log you were going to write anyway, and the full log event remains queryable for the dimensions you chose not to promote to metrics.5.3 Metric Filters and the High-Cardinality Trap
Metric filters extract numeric metrics from existing log events using filter patterns; each log group supports up to 100 metric filters. The subtle, expensive mistake here is cardinality. The officialput-metric-filter guidance warns explicitly against using high-cardinality fields as dimensions, because each unique dimension value is billed and stored as a separate custom metric — promote customerId or orderId to a metric dimension and you have just created one metric per customer, which explodes both cost and the number of time series you have to manage.The architectural rule that follows: keep metric dimensions low-cardinality (service, operation, status code, Availability Zone) so they aggregate cleanly, and keep high-cardinality identifiers (customer, order, request) as searchable log fields or EMF properties rather than dimensions. You still get per-customer investigation — through Logs Insights or Transaction Search — without minting millions of metrics. This single distinction prevents the most common and most costly observability failure mode (Section 10).
When you genuinely need to rank high-cardinality contributors — the top customers by error count, the noisiest source IPs — use CloudWatch Contributor Insights, which evaluates a rule over the log stream and reports the top-N contributors without turning each one into a metric. A metric filter, by contrast, should target a low-cardinality numeric signal, for example counting throttled writes:
{
  "filterName": "throttled-writes",
  "filterPattern": "{ $.error_code = \"ProvisionedThroughputExceededException\" }",
  "metricTransformations": [
    { "metricName": "ThrottledWrites", "metricNamespace": "OrderSystem", "metricValue": "1" }
  ]
}
6. SLOs, Alarms, and Application Signals
Signals are inputs; the operating model is the output. Humans should respond to a small number of meaningful conditions, not to every threshold crossing.6.1 Application Signals: Automatic APM
CloudWatch Application Signals is an application performance monitoring (APM) feature that automatically collects metrics and traces and gives you, without custom code or hand-built dashboards: standardized service metrics (call volume, latency, availability, faults, errors), an auto-discovered service map, and SLOs. Per the official documentation it is supported on Amazon EKS, native Kubernetes, Amazon ECS, Amazon EC2, and AWS Lambda; it instruments Java, .NET, Python, and Node.js through ADOT, and PHP, Ruby, and Go through standard OpenTelemetry zero-code instrumentation with Transaction Search enabled. It also reports runtime metrics (memory usage, garbage collection, thread counts) for Java, Python, and .NET, correlated with the application metrics, traces, and logs. Application Signals is available in most commercial AWS Regions; because the list expands over time, confirm current availability in the Application Signals endpoints and quotas documentation.For the reference architecture this means both the Lambda accept function and the Fargate worker show up as services on one topology map, each with consistent golden-signal metrics, with no per-service dashboard work.
What Application Signals standardizes is the service, operation, and dependency model: every instrumented service is discovered automatically, each of its operations (an API route, a queue consumer) gets the same golden signals — volume, latency, availability, faults, and errors — and every call it makes to a dependency (DynamoDB, an HTTP backend) becomes a measured edge. Because the model is identical for the Lambda function and the Fargate worker, an operator reads both tiers the same way, which is what makes a serverless-plus-container system feel like one system rather than two.
6.2 Defining SLOs That Mean Something
An SLO is built on a service level indicator (SLI) — Application Signals collects Latency and Availability automatically — and an attainment goal such as 99.9%. The official documentation defines two SLO types:- Period-based SLOs measure the percentage of good time periods within an interval.
- Request-based SLOs measure the ratio of good requests to total requests.
Both support error budget tracking — how much non-compliance you can tolerate while still meeting the goal — which is what turns reliability into a number you can spend. An SLO is defined declaratively, and creating one provisions the
AWSServiceRoleForCloudWatchApplicationSignals service-linked role:Resources:
CheckoutLatencySLO:
Type: AWS::ApplicationSignals::ServiceLevelObjective
Properties:
Name: checkout-latency-p99
Sli:
SliMetric:
KeyAttributes: # an Application Signals-discovered service
Type: Service
Name: order-accept
Environment: prod
OperationName: "POST /checkout"
MetricType: LATENCY
Statistic: p99
PeriodSeconds: 60
MetricThreshold: 300 # latency objective in milliseconds
ComparisonOperator: LessThanOrEqualTo
Goal:
Interval:
RollingInterval:
DurationUnit: DAY
Duration: 30
AttainmentGoal: 99.9 # percent
WarningThreshold: 50.0
A robust refinement is the multi-window, multi-burn-rate alarm: a fast-burn condition on a short window pages immediately when the budget is draining quickly, while a slow-burn condition on a longer window catches gradual erosion that a single threshold would miss. Both are ordinary CloudWatch alarms evaluated against the SLO's attainment and error-budget metrics, so you keep urgency proportional to severity.
6.3 Composite Alarms and Anomaly Detection
Below the SLO layer, two CloudWatch features keep the alarm count manageable:- Composite alarms evaluate a rule expression over other alarms and enter ALARM only when the combined condition holds, which collapses many child alarms into one actionable signal. A composite alarm can reference up to 100 underlying metric or composite alarms and can trigger SNS notifications, Lambda functions, or Systems Manager incidents — just watch for circular dependencies between composite alarms.
- Anomaly detection trains a machine-learning model on a metric's normal range and draws an expected band (the
ANOMALY_DETECTION_BANDfunction), so you can alarm on "outside expected behavior" instead of a hand-tuned static number — useful for metrics with strong daily or weekly seasonality.
A composite alarm's rule is a boolean expression over child alarm states, so you can encode "page only when latency is bad and the queue is also backing up" and suppress the page during a known maintenance window:
ALARM("order-accept-p99-latency")
  AND ALARM("order-queue-age")
  AND NOT ALARM("maintenance-window-active")
6.4 Avoiding Alert Fatigue
The cross-cutting goal is to page a human only when a customer-affecting objective is at risk. Concretely: alarm on SLO burn rate rather than on raw latency wherever possible; aggregate related conditions with composite alarms so one incident is one page; use anomaly detection for seasonal metrics that defeat static thresholds; and reserve high-urgency notification channels for the few alarms that imply user impact, routing the rest to dashboards and tickets. An alarm that fires when nothing is wrong trains responders to ignore it, which is more dangerous than having no alarm at all.Routing closes the loop. Every alarm that pages a human should point to a runbook and to the dashboard or saved query that starts the diagnosis in Section 7, so the responder lands on context rather than a bare notification. Alarms that do not imply user impact belong in a ticket queue or a chat channel, not on the pager. The test for any new alarm is simple: if it fires at 3 a.m., is there something a human must do right now? If not, it is a dashboard, not an alarm.
7. End-to-End: Diagnosing One Latency Incident
This is where the architecture pays off. Consider a single incident: the checkout latency SLO starts burning its error budget — p99 latency onorder-accept has crept above the objective. The disciplined path is metrics → traces → logs, narrowing the search space at each step.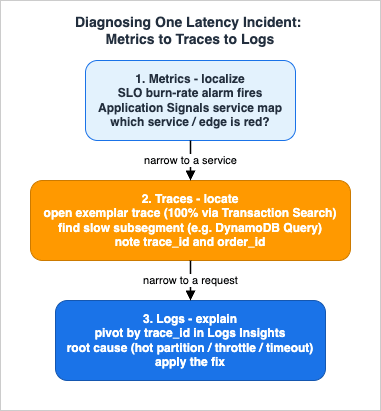
Step 1 — Metrics, to localize. Start on the Application Signals service map. The map shows golden signals per node and edge, so a red edge immediately narrows the problem to a service or a dependency. Cross-check the supporting CloudWatch metrics for that area: is the SQS
ApproximateAgeOfOldestMessage climbing (the worker is falling behind), is Lambda Duration or Throttles elevated, is ECS service latency up? At the end of this step you know which component is slow, without having read a single trace.Step 2 — Traces, to locate. From the slow node, open an exemplar trace — and because Transaction Search captured 100% of spans, the specific slow request is available even if it was not in the indexed sample. Walk the segment tree to the subsegment that owns the latency: frequently it is a single downstream call, such as a DynamoDB
Query that is suddenly slow, or an outbound HTTP call that is timing out. The trace's waterfall view makes this visual: each subsegment is a bar whose length is its duration and whose position shows whether it ran in series or in parallel, so a single long bar deep in the tree is the time sink, and a gap between bars often reveals an untraced wait. Record the trace_id and the order_id annotation. At the end of this step you know where in the request the time goes.Step 3 — Logs, to explain. Pivot from the trace to its correlated logs by
trace_id. Because every log line is structured and trace-aware, a Logs Insights query filtered to that trace ID (or the order_id) returns exactly the worker's log lines for that request — revealing, say, a hot-partition retry storm, a throttling response, or a downstream timeout that the trace showed as elevated latency:fields @timestamp, level, msg, dynamo_table, retry_count
| filter trace_id = "1-67b0a1e2-3f4d5c6b7a8e9f01"
| sort @timestamp asc
| limit 100This three-step flow is the same discipline formalized in the Incident Triage Flowcharts for Network, Database, and Application Layers, and the lessons you capture afterward feed the kind of structured retrospective described in AWS Postmortem Case Studies and Design Lessons. Observability is not just dashboards; it is the muscle that turns a page into a fix.
8. Cross-Account and Multi-Environment Observability
Production systems rarely live in one account. A common topology places workloads in separate accounts per environment or per team, which would fragment telemetry if each account were an island.CloudWatch cross-account observability solves this. You designate a central monitoring account and connect source accounts that share their metrics, logs, and traces, so you can search, visualize, and correlate across accounts — and set cross-account alarms — without switching contexts. The plumbing is the Observability Access Manager (OAM): a monitoring account creates a sink, and each source account creates a link to that sink, scoped by AWS Organizations to an organization, an organizational unit, or specific account IDs. The result is a single pane over a multi-account estate while workloads stay isolated in their own accounts.
Both sides are a few lines of infrastructure. The monitoring account creates a sink with a sink policy, and each source account creates a link that selects which telemetry types to share:
# In each source account (a sink must already exist in the monitoring account)
Resources:
  ObservabilityLink:
    Type: AWS::Oam::Link
    Properties:
      SinkIdentifier: arn:aws:oam:REGION:MONITORING_ACCOUNT_ID:sink/SINK_ID
      LabelTemplate: "$AccountName"
      ResourceTypes:               # valid: Metric, LogGroup, XRay::Trace, ApplicationInsights::Application, InternetMonitor::Monitor
        - AWS::CloudWatch::Metric
        - AWS::Logs::LogGroup
        - AWS::XRay::Trace
For environment separation (dev, staging, production), the same mechanism lets a central operations account observe all environments while each environment's blast radius stays contained. This is distinct from audit log aggregation — the immutable, security-oriented collection of CloudTrail, Config, and Security Hub data into an organization log archive — which is a different architecture covered separately in the centralized logging and audit guide. Keep the two concerns separate: operational observability optimizes for fast correlation and troubleshooting; audit logging optimizes for tamper-resistance and retention.
9. Least-Privilege IAM, Encryption, and Quotas for the Telemetry Path
Observability is itself a system with its own attack surface, data sensitivity, and scaling limits, so the telemetry path deserves the same cross-cutting rigor as the application it watches.9.1 Least-Privilege Identities
Separate the identities that write telemetry from those that read it. The Lambda execution role and the ECS task role only need to emit data: sending trace segments and telemetry records and reading sampling rules is exactly what the AWS managed policyAWSXRayDaemonWriteAccess grants (PutTraceSegments, PutTelemetryRecords, GetSamplingRules, GetSamplingTargets), while the CloudWatch agent uses CloudWatchAgentServerPolicy to put metrics and logs. Operators who only view traces get AWSXrayReadOnlyAccess, and the ability to change encryption settings or sampling rules is reserved for administrators through AWSXrayFullAccess. Application Signals provisions the AWSServiceRoleForCloudWatchApplicationSignals service-linked role for its own scoped access to X-Ray, CloudWatch, and Logs. The rule of thumb: producers are write-only, humans are read-only, and configuration is privileged.9.2 Encryption of Telemetry at Rest
Traces and logs routinely carry request context, so encrypt them with keys you control. A CloudWatch Logs log group can be associated with a symmetric customer-managed AWS KMS key viaAssociateKmsKey; the association encrypts newly ingested events, takes up to a few minutes to apply, and — a critical operational caveat — deleting the KMS key renders the encrypted data unreadable. Because Transaction Search lands 100% of spans in the aws/spans log group and EMF metrics are extracted from log events, the same log-group encryption protects your trace spans and metric source data. X-Ray additionally supports an account-level encryption configuration, so segments can be encrypted with a customer-managed key instead of the default AWS-owned key.9.3 Telemetry Volume Is a Scaling Axis
The interacting quotas across this stack reduce to one idea: telemetry volume scales with the workload, so the controls must scale too. The X-Ray sampling reservoir and fixed rate, the Transaction Search indexing percentage, the cap on metric filters per log group, the limit on child alarms per composite alarm, and the OAM cross-account scope each bound a different dimension of volume. The upstream system's throughput sets the floor: doubling the request rate doubles raw spans and log lines, so sampling rates, cardinality choices, and retention must be designed against peak load, not set once and forgotten. This is the observability analogue of the application-tier rule that an upstream component must never be allowed to overwhelm a downstream one.10. Failure Modes and Pitfalls
A Level 400 design is judged by how it fails. These are the recurring failure modes of an observability stack, with the symptom, the root cause, and the fix.10.1 Broken Traces
Symptom: the service map shows the serverless tier and the container tier as disconnected islands; traces stop at an EventBridge or SQS boundary. Root cause: trace context was not propagated across the asynchronous hop, so the consumer started a new root trace. Fix: inject the context into the message payload at the producer and extract it at the consumer (Section 3.4), and configure a composite propagator (tracecontext,baggage,xray) so both header formats are understood. Secondary causes are uninstrumented services in the middle of the path and a sampling mismatch where the root did not sample but a downstream tried to.10.2 Dimension Explosion
Symptom: custom-metric counts and metric costs grow without bound; dashboards become unusably sparse. Root cause: a high-cardinality field (customer, order, request ID) was promoted to a metric dimension, minting one metric per unique value. Fix: demote those identifiers to searchable log fields or EMF properties and keep dimensions low-cardinality (Section 5.3). If a metric filter is the source, the platform may even disable a filter that generates excessive name/value pairs, so fix the cardinality at the source.10.3 Log Bloat
Symptom: log ingestion and storage grow faster than traffic. Root cause: verbose or duplicated logging, debug logs left on in production, and indefinite retention. Fix (qualitative): log at the right level, prefer one structured event per unit of work over many lines, set retention deliberately per log group, and move rarely queried data to cheaper storage tiers. CloudWatch Logs offers a lower-cost log class for infrequently accessed data, per-log-group retention policies, and subscription filters that can stream selected logs to Amazon S3 or Amazon OpenSearch Service for long-term archival and analytics — so hot, queryable data and cold, archival data live in the right places. Because telemetry is volume-billed, log discipline is a cost control as much as a clarity control — confirm current pricing in the official AWS Pricing pages rather than guessing.10.4 Sampling Blind Spots
Symptom: the exact failing request was never traced. Root cause: static sampling discarded it. Fix: enable Transaction Search to retain 100% of spans as logs, and use adaptive sampling so anomalies boost the capture rate during incidents (Sections 4.2 and 4.3).10.5 Alarm Noise
Symptom: responders mute or ignore alarms. Root cause: too many static-threshold alarms firing on non-customer-impacting conditions. Fix: move to SLO burn-rate alarms, consolidate with composite alarms, and apply anomaly detection to seasonal metrics (Section 6.4).11. Variations: Native vs OpenTelemetry, and Third-Party
The stack above is one well-supported point in a small design space, and a few variations are worth naming so you can reshape it deliberately:- Native X-Ray SDK vs OpenTelemetry. The native X-Ray SDK still works and is the right choice only for existing X-Ray-instrumented systems. For anything new, OpenTelemetry through ADOT is the forward path, and AWS provides migration guides off the X-Ray SDK. Standardizing on OpenTelemetry is what keeps the rest of the stack swappable.
- ADOT vs upstream OpenTelemetry Collector. ADOT is AWS-tested and integrated; the upstream OTel Collector is the right call when you need languages ADOT does not cover (Erlang, Rust) or you already operate upstream OTel. Because the application speaks OTLP either way, this is a Collector choice, not an application rewrite.
- Third-party backends. Because everything is OpenTelemetry, the Collector can also export to third-party APM SaaS over OTLP, or you can dual-export to AWS and a vendor during a migration. This guide does not evaluate specific vendors; the architectural point is that OTLP at the boundary makes the backend a configuration decision.
When should you reshape? If you need a single backend across multiple clouds, lean harder on the upstream OTel Collector; if you live entirely on AWS and want the least operational overhead, the ADOT + CloudWatch agent + Application Signals path gives you the most for the least configuration.
Other triggers are concrete. If a compliance regime requires that telemetry never leave a boundary you control, pin the Collector's exporters accordingly. If one team needs a specialized analytics backend, dual-export from the Collector rather than re-instrumenting the application. If trace volume makes 100% span retention impractical on one very high-throughput path, scope a tighter sampling rule to that path while keeping full fidelity everywhere else. In every case the application code does not move; only the Collector configuration and the sampling rules do, which is the entire payoff of standardizing on OpenTelemetry.
12. Frequently Asked Questions
Do I need both X-Ray and Application Signals?They are complementary. X-Ray provides the raw trace data, sampling, and the service map; Application Signals sits on top to auto-discover services, standardize golden-signal metrics, and manage SLOs. In the recommended setup you enable both, and Application Signals consumes the trace data that X-Ray and Transaction Search collect.
How do I keep trace context across EventBridge and SQS?
Inject the W3C
traceparent (and a correlation ID) into the event or message payload at the producer, and extract it at the consumer to start a child span. Asynchronous hops have no HTTP header to carry context automatically for your application spans, so you must carry it in the message (Section 3.4).Should I use the X-Ray SDK or OpenTelemetry?
OpenTelemetry, through ADOT, for new work. AWS documents migration paths from the X-Ray SDK to OpenTelemetry per language, and the X-Ray SDK path is now legacy.
How do I trace a request that sampling discarded?
Enable Transaction Search, which ingests 100% of spans as structured logs in the
aws/spans log group while indexing a configurable percentage (1% by default) as trace summaries. You retain full investigative coverage without indexing every span as a full trace.Why does my service map show two disconnected halves?
Almost always a propagation gap at an asynchronous boundary, an uninstrumented service in the path, or a parent-based sampling mismatch. Fix context propagation and confirm a composite propagator is configured (Section 10.1).
How do I avoid alarm fatigue?
Alarm on SLO burn rate rather than raw thresholds, consolidate related conditions with composite alarms, and use anomaly detection for seasonal metrics so a single incident produces a single, meaningful page (Section 6.4).
How do I keep observability from getting expensive?
Telemetry is volume-billed, so control ingestion and storage: sample traces (with Transaction Search for completeness), keep metric dimensions low-cardinality, log structured events at the right level, and set retention deliberately. This guide intentionally avoids price figures — confirm current rates in the official AWS Pricing pages.
13. Summary
The hard part of observability is not the three pillars; it is correlating them across a system that spans serverless and containers, and operating the result with objectives instead of noise. The architecture in this guide does that with one stack: ADOT provides OpenTelemetry-based instrumentation for both Lambda and Fargate; trace context and a correlation ID are propagated across every hop, including the asynchronous ones where traces usually break; X-Ray and Transaction Search give full-fidelity tracing and a service map; CloudWatch holds metrics, EMF-derived business metrics, and structured logs that pivot on the same trace ID; and Application Signals layers SLOs and an auto-discovered topology on top so humans respond to burn rate, not to a wall of static alarms. The diagnosis walkthrough — metrics to localize, traces to locate, logs to explain — is the payoff that turns all of this from data into a fix.From here, see the two systems this guide instruments — Event-Driven Serverless Architecture on AWS and the Amazon ECS on Fargate Microservices Architecture Guide — and the adjacent operations material: the AWS Observability Glossary for vocabulary, the CloudWatch Logs Insights Query Collection for query patterns, the Incident Triage Flowcharts for the diagnosis discipline, and AWS Postmortem Case Studies and Design Lessons for what to do after the page clears.
14. References
- Amazon CloudWatch Application Signals (Application Monitoring)
- Application Signals - Supported instrumentation setups
- Application Signals - Supported systems and languages
- CloudWatch Application Signals - Service Level Objectives (SLOs)
- Enable Application Signals on AWS Lambda
- AWS Distro for OpenTelemetry (ADOT)
- AWS X-Ray and AWS Distro for OpenTelemetry
- AWS X-Ray - Configuring sampling rules
- Migrating from the X-Ray SDK to OpenTelemetry
- CloudWatch Transaction Search
- CloudWatch Embedded Metric Format (EMF) Specification
- CloudWatch - Creating composite alarms
- CloudWatch anomaly detection
- CloudWatch cross-account observability
- Powertools for AWS Lambda
- Amazon CloudWatch Pricing (confirm current rates)
- Event-Driven Serverless Architecture on AWS
- Amazon ECS on Fargate Microservices Architecture Guide
- AWS Observability Glossary
- CloudWatch Logs Insights Query Collection
- AWS History and Timeline of Amazon CloudWatch
- Incident Triage Flowcharts for Network, Database, and Application Layers
- AWS Postmortem Case Studies and Design Lessons
References:
Tech Blog with curated related content
Written by Hidekazu Konishi