LLMOps Observability and Evaluation Architecture on AWS - Tracing, Metrics, and Automated Evaluation Gates with CloudWatch and OpenTelemetry
First Published:
Last Updated:
1. Introduction
The hardest failure mode in production generative AI is not the one that pages you. It is the one that does not. A model returns HTTP 200, in the usual number of milliseconds, with a fluent, well-formed answer — that is quietly, subtly wrong. Nothing in classic application monitoring notices: there is no exception, no elevated error rate, no latency spike, no CPU saturation. The request succeeded. Only the answer got worse.Generative AI quality degrades silently, and it degrades from many directions at once. Someone edits a system prompt to fix one behavior and regresses three others. A knowledge base is re-indexed with a different chunking strategy and retrieval relevance drops. A model version is swapped for a newer one that is better on average but worse on your specific domain. A dependency bump changes how a tool serializes its output. None of these throw. All of them can move answer quality — and the only way to know is to measure the answer itself and to block the change that makes it worse before it ships.
LLMOps is the discipline that makes generative AI quality a measured, gated, first-class operational signal across the lifecycle — the same way DevOps made build health and SRE made availability into signals you can alarm on and gate releases against. This article builds one concrete, named reference architecture for doing that on AWS: a control plane that instruments your application once with OpenTelemetry, observes it in Amazon CloudWatch, evaluates its outputs both offline and online, and gates every prompt and model change in AWS CodePipeline so that a quality regression cannot reach production.
This is a Level 400 implementation walkthrough — multiple AWS services wired into a single working system, traced end to end, with the failure modes and cross-cutting concerns that only appear when the parts are connected. It is deliberately scoped to the cross-service platform. Several adjacent topics already have dedicated treatments on this site, and this article delegates to them rather than restating them:
- The catalog of built-in evaluators and the AgentCore-native evaluation gate are covered in the Amazon Bedrock AgentCore Evaluations Practical Guide. This article builds the complementary cross-service harness and a CodePipeline gate around custom and Amazon Bedrock evaluations.
- The single-agent telemetry-pipeline setup, cost optimization, resilience patterns, and 3 AM runbooks are covered in the Amazon Bedrock AgentCore Production Operations Guide. This article stays aligned with its four-signal model and references its runbooks rather than re-deriving them.
- Content safety with Guardrails is delegated to the Responsible-AI Guardrails article (No.06 in this series), and agentic RAG quality control to the Agentic RAG article (No.01).
A note on cost: per this site's policy, this article carries no pricing or token-unit numbers. Token usage appears throughout as an operational signal — something to trace, attribute, and watch for drift — never as a figure to multiply by a price. Where money matters, the text links to the official pricing pages.
2. The LLMOps Reference Architecture at a Glance
The architecture this article implements is a control plane: instrument → observe → evaluate → gate → promote or roll back. One request's telemetry flows left to right into observability; that same telemetry, sampled, feeds evaluation; evaluation scores feed both alarms (for what is already in production) and the CI gate (for what is trying to ship).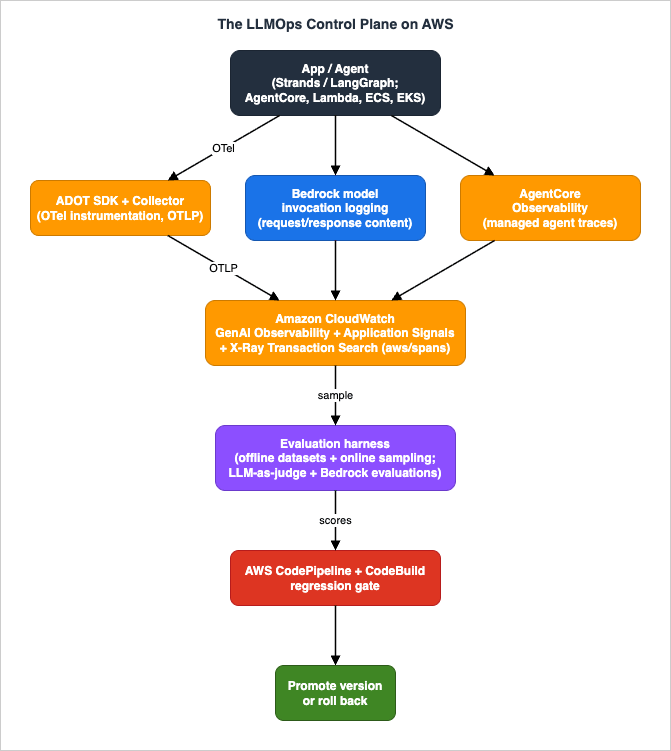
Each component plays one role:
- Application / agent. Your generative AI workload — a Strands or LangGraph agent, a custom orchestration loop, or a managed agent on Amazon Bedrock AgentCore Runtime, running on Lambda, ECS, or EKS. It emits OpenTelemetry telemetry: spans for model calls, retrievals, and tool invocations, carrying generative-AI semantic-convention attributes.
- ADOT (AWS Distro for OpenTelemetry). The instrumentation layer (SDK, embedded or framework-native) and the collection layer (the ADOT Collector). One instrumentation feeds CloudWatch and any third-party backend.
- Amazon CloudWatch generative AI observability. Curated dashboards for GenAI workloads: a Model Invocations dashboard (usage, token consumption, a curated invocation-logs table) and an Amazon Bedrock AgentCore agents dashboard (the agent primitives — Agents, Memory, Built-in Tools, Gateways, Identity).
- CloudWatch Application Signals and X-Ray Transaction Search. The span store and APM experience. Spans land in the
aws/spanslog group in OpenTelemetry semantic-convention format with W3C trace IDs, searchable and analyzable. - Amazon Bedrock model invocation logging. Content-level capture of model requests and responses — the raw material online evaluation needs, because you cannot grade an answer you did not record.
- Amazon Bedrock AgentCore Observability. Managed traces for AgentCore agents and primitives (detailed enablement is delegated to the Production Operations Guide).
- The evaluation harness. Offline dataset evaluation plus online sampling, scored with LLM-as-judge and Amazon Bedrock evaluations. This is the fourth signal.
- AWS CodePipeline and AWS CodeBuild. The regression gate. A pipeline stage runs the evaluation harness and fails the build if quality drops, so a regressing prompt or model version cannot be promoted.
- CloudWatch Alarms, Logs Insights, and dashboards. Drift detection and alerting for what is already live.
- Cross-cutting controls. Least-privilege IAM, KMS encryption, CloudWatch Logs sensitive-data protection, and tenant/data boundaries thread through every box.
The rest of this article implements each component, then walks one release end to end through the gate, then examines how the pieces fail together.
3. Instrumentation with OpenTelemetry and ADOT
Everything downstream depends on telemetry that is correlated. If a model call, the retrieval that fed it, and the tool it triggered are not stitched into one trace, you cannot reason about a request as a unit, and you cannot tie an evaluation score back to what produced it. Instrumentation is therefore the foundation, and it is worth getting the propagation details exactly right.3.1 Why OpenTelemetry, and the three layers
CloudWatch supports OpenTelemetry (OTel) natively across all three signal types — metrics queryable with PromQL, logs searchable with Logs Insights, and traces explorable with Transaction Search. Because the three share a common data model, you can pivot from a metric anomaly to the traces behind it to the logs inside them. Choosing OTel as the instrumentation layer also means one instrumentation feeds CloudWatch and any OTel-compatible third-party backend (Datadog, Dynatrace, Langfuse, Arize Phoenix, LangSmith, and others), with no second instrumentation pass.The AWS-recommended observability stack has three layers:
- Instrumentation — the OpenTelemetry SDK, either embedded directly in your code or provided by framework-native support. Agent frameworks such as Strands include built-in OTel instrumentation.
- Collection and processing — the ADOT Collector (AWS Distro for OpenTelemetry Collector), which receives telemetry over OTLP and handles sampling, filtering, batching, and routing.
- Analysis backend — Amazon CloudWatch, or a third-party tool, or both.
In development you can export telemetry directly from the SDK to a backend. In production, route through the Collector as an intermediate layer so that sampling, redaction, and fan-out are centralized rather than baked into every service.
3.2 Auto-instrumentation and the generative-AI semantic conventions
For Python agents, the fastest path is auto-instrumentation. After installing the ADOT Python packages, you launch your process underopentelemetry-instrument, which wraps supported libraries (HTTP clients, the AWS SDK, agent frameworks) and emits spans without code changes:pip install aws-opentelemetry-distro
OTEL_PYTHON_DISTRO=aws_distro \
OTEL_PYTHON_CONFIGURATOR=aws_configurator \
OTEL_EXPORTER_OTLP_PROTOCOL=http/protobuf \
OTEL_PROPAGATORS=tracecontext,baggage \
OTEL_RESOURCE_ATTRIBUTES="service.name=support-agent,deployment.environment=prod" \
opentelemetry-instrument python agent.pygen_ai.* attributes — for example the model system and request model, and token usage on the model-call span. Capturing token usage as a span attribute is what later lets you attribute usage by user, route, or tenant, and alarm on token drift.When you need attributes the auto-instrumentation does not produce — a tenant ID, a prompt version, a retrieval document count — add them on the current span, and add anything that must survive across separate traces in the same logical session as baggage:
from opentelemetry import trace, baggage, context

tracer = trace.get_tracer("support-agent")

def handle_turn(user_query: str, session_id: str, prompt_version: str):
    # Propagate the session id across every downstream trace in this session.
    ctx = baggage.set_baggage("session.id", session_id)
    token = context.attach(ctx)
    try:
        with tracer.start_as_current_span("agent.turn") as span:
            span.set_attribute("session.id", session_id)
            span.set_attribute("app.prompt_version", prompt_version)
            span.set_attribute("app.tenant_id", current_tenant())
            answer = run_agent(user_query)        # model + retrieval + tool spans nest here
            span.set_attribute("app.answer_chars", len(answer))
            return answer
    finally:
context.detach(token)runtimeSessionId. If you want to send AgentCore telemetry to a third-party platform instead of the default CloudWatch pipeline, set DISABLE_ADOT_OBSERVABILITY=true to unset those defaults.3.3 The Collector topology and trace-context propagation
The single most important detail in the whole instrumentation layer is W3C Trace Context propagation. When a request spans multiple agents, frameworks, or services, OpenTelemetry's W3C Trace Context (thetraceparent header) carries one shared trace ID across every hop, so the complete execution path appears in one view. For requests that share a logical session but produce separate traces — a multi-turn conversation, an async fan-out — OpenTelemetry Baggage propagates the session ID across those trace boundaries.This is precisely the link that breaks first and most invisibly (see §9.1). The defenses are: set
OTEL_PROPAGATORS=tracecontext,baggage everywhere; ensure every HTTP/queue client in the path injects and extracts the context; and, at async boundaries (SQS, EventBridge, threads), carry traceparent explicitly as a message attribute and re-attach it on the consumer side.Auto-instrumentation handles the synchronous HTTP hops; the boundaries it cannot see are queues and event buses, where you move the context by hand:
from opentelemetry import propagate

# Producer: inject the active trace context into an SQS message attribute.
def enqueue(sqs, queue_url, body):
    carrier = {}
    propagate.inject(carrier)                       # writes "traceparent" (+ "baggage")
    sqs.send_message(
        QueueUrl=queue_url, MessageBody=body,
        MessageAttributes={"traceparent": {"DataType": "String",
                                           "StringValue": carrier["traceparent"]}},
    )

# Consumer: extract it and run the work inside the propagated context.
def on_message(record):
    carrier = {"traceparent": record["messageAttributes"]["traceparent"]["stringValue"]}
    ctx = propagate.extract(carrier)
    with tracer.start_as_current_span("worker.process", context=ctx):
process(record)receivers:
otlp:
protocols:
grpc:
endpoint: 0.0.0.0:4317
http:
endpoint: 0.0.0.0:4318
processors:
batch:
timeout: 10s
# Drop or hash sensitive attributes before they leave your boundary.
attributes/redact:
actions:
- key: app.user_email
action: delete
probabilistic_sampler:
sampling_percentage: 20
exporters:
awsxray:
region: us-east-1
awsemf:
region: us-east-1
namespace: LLMOps/Agent
service:
pipelines:
traces:
receivers: [otlp]
processors: [attributes/redact, probabilistic_sampler, batch]
exporters: [awsxray]
metrics:
receivers: [otlp]
processors: [batch]
exporters: [awsemf]For multi-account platforms, enable CloudWatch cross-account observability: designate a monitoring account, link source accounts to it, and view traces, metrics, and logs across the estate in one place. The instrumentation does not change; only where the data is read does.
4. GenAI Observability: Traces, Metrics, and Invocation Logs
With telemetry flowing, the observability layer gives you three correlated views of every request: its trace (what happened, in order), its metrics (how much, how fast), and its invocation log (what was actually said). The job of this layer is to make those three pivotable from a single trace ID.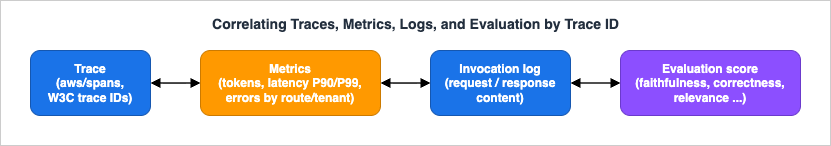
4.1 The prerequisite: enable Transaction Search
The trace view depends on CloudWatch Transaction Search, a one-time setup. When enabled, spans sent to X-Ray are ingested as structured logs in a log group calledaws/spans. X-Ray traces are automatically converted to the OpenTelemetry semantic-convention format with W3C trace IDs before they are stored there, which is what makes every span attribute searchable. Transaction Search ingests 100% of spans as structured logs (so traces are never broken by sampling) and indexes a configurable percentage as trace summaries in X-Ray for end-to-end search; you can index at 1% for free and raise it later. A single trace can hold up to 10,000 spans.In the console, enable it under Application Signals (APM) → Transaction search → Enable Transaction Search, selecting the option to ingest spans as structured logs. Via the API, you first grant X-Ray permission to write spans to CloudWatch Logs with a resource policy:
aws logs put-resource-policy \
  --policy-name TransactionSearchAccess \
  --policy-document '{
    "Version": "2012-10-17",
    "Statement": [{
      "Sid": "TransactionSearchXRayAccess",
      "Effect": "Allow",
      "Principal": { "Service": "xray.amazonaws.com" },
      "Action": "logs:PutLogEvents",
      "Resource": [
        "arn:aws:logs:us-east-1:123456789012:log-group:aws/spans:*",
        "arn:aws:logs:us-east-1:123456789012:log-group:/aws/application-signals/data:*"
      ],
      "Condition": {
        "ArnLike":      { "aws:SourceArn":     "arn:aws:logs:us-east-1:123456789012:*" },
        "StringEquals": { "aws:SourceAccount": "123456789012" }
      }
    }]
}'CreateDeliverySource, CreateDeliveryDestination, CreateDelivery), which this article does not repeat.4.2 Curated GenAI dashboards
CloudWatch generative AI observability provides two pre-built dashboards on top of this telemetry. (It reached general availability in 2025; confirm the current Regional availability before relying on it in a runbook, since it is not yet in every Region.)- Model Invocations — a metrics dashboard on model usage and token consumption, with a curated invocation-logs table that lets you drill from a request ID into the actual input prompt and model response. This dashboard works for any model you invoke in Amazon Bedrock.
- Amazon Bedrock AgentCore agents — performance and decision metrics for the AgentCore primitives (Agents, Memory, Built-in Tools, Gateways, Identity), with an Agents view, a Sessions view, and a Traces view for stepping through a trace trajectory.
The key metrics surfaced across these dashboards:
| Metric group | What it surfaces |
|---|---|
| Invocations | Total and average invocations |
| Token usage | Total, average per query, input, and output tokens |
| Latency | Average, P90, and P99 |
| Errors | Error rates and throttling events |
| Attribution | Cost-attribution dimension by application, user role, or specific user |
Treat the cost-attribution dimension as an attribution signal — which workloads and tenants consume the most tokens — not as a number to price. CloudWatch's AI monitoring is compatible with Strands, LangChain, and LangGraph, and you can send structured traces of third-party models to CloudWatch using the ADOT SDK.
4.3 Bedrock model invocation logging — capturing the content
Metrics and traces tell you that a model was called and how much it cost in tokens; they do not, by themselves, capture what was said. Online evaluation needs the content. Amazon Bedrock model invocation logging captures the full request data, response data, and metadata for model invocations in your account in a Region. It logs calls made through thebedrock-runtime endpoint — Converse, ConverseStream, InvokeModel, and InvokeModelWithResponseStream — and is disabled by default.You choose a destination: Amazon S3 only, CloudWatch Logs only, or both. Records up to 100 KB are delivered to the chosen destination; larger payloads or binary data (for example image outputs) are delivered only to S3, under a data prefix. You stay in control of modalities (Text, Image, Embedding), KMS encryption, and retention. S3-delivered logs are queryable with Amazon Athena and catalogable with AWS Glue, which makes S3 the natural store for building evaluation datasets from production traffic.
Enabling it requires a destination and a service role that Bedrock can assume. The role's trust policy scopes Bedrock to your account and Region:
{
  "Version": "2012-10-17",
  "Statement": [{
    "Effect": "Allow",
    "Principal": { "Service": "bedrock.amazonaws.com" },
    "Action": "sts:AssumeRole",
    "Condition": {
      "StringEquals": { "aws:SourceAccount": "123456789012" },
      "ArnLike":      { "aws:SourceArn": "arn:aws:bedrock:us-east-1:123456789012:*" }
    }
  }]
}aws bedrock put-model-invocation-logging-configuration \
--logging-config '{
"cloudWatchConfig": {
"logGroupName": "/aws/bedrock/model-invocations",
"roleArn": "arn:aws:iam::123456789012:role/BedrockInvocationLogging",
"largeDataDeliveryS3Config": {
"bucketName": "my-bedrock-invocation-logs",
"keyPrefix": "large-payloads/"
}
},
"textDataDeliveryEnabled": true,
"imageDataDeliveryEnabled": false,
"embeddingDataDeliveryEnabled": false
}'bedrock-runtime.4.4 Querying spans and extracting metrics
Because spans live inaws/spans as structured logs, Logs Insights becomes a query engine over your agent's behavior. You can find the heaviest requests, the slowest tool calls, or the spans that error:fields @timestamp, attributes.`session.id`, attributes.`gen_ai.usage.input_tokens`,
attributes.`gen_ai.usage.output_tokens`, attributes.`gen_ai.request.model`
| filter attributes.`gen_ai.usage.input_tokens` > 8000
| sort attributes.`gen_ai.usage.input_tokens` desc
| limit 50aws/spans, or emit it directly from the Collector as an EMF metric. Those custom metrics are what §7 alarms on. The point of this section is the pivot: a trace ID ties a request's spans to its token and latency metrics to its invocation-log record — and, next, to its evaluation score.5. Offline and Online Evaluation
Evaluation is the fourth signal and the reason this is LLMOps and not just observability. The previous section captured what happened; this section scores how good it was. There are two complementary modes — offline against a fixed dataset, and online against sampled live traffic — and one technique that powers most of it: LLM-as-judge.5.1 What to measure
Before any tooling, decide the quality dimensions that matter for your application, because they will become both the online alarms and the CI gate thresholds, and consistency across the lifecycle depends on using the same ones. A common decomposition:- Correctness — is the answer factually right against ground truth?
- Faithfulness / grounding — is the answer supported by the retrieved context, or hallucinated? (See Grounding and Hallucination in the AI Agent Engineering Glossary.)
- Relevance — does it address the question, and is the retrieved context relevant?
- Helpfulness / completeness — does it actually solve the user's problem?
- Safety / refusal — does it refuse what it should and only what it should?
- Tool and trajectory quality — for agents, did it choose the right tools in a sensible order? (See Trajectory Evaluation.)
5.2 Offline (dataset) evaluation — the CI workhorse
Offline evaluation runs a fixed golden dataset — inputs paired with ground truth, expected responses, or assertions — against a candidate configuration (a prompt version, a model version, a retrieval setting). It is deterministic and reproducible, which is exactly what a CI gate needs: the same dataset and the same candidate should produce the same score, so a change in score is attributable to the change under test.Amazon Bedrock evaluations provides managed offline evaluation for both models and RAG systems, under the console's Inference and assessment → Evaluations (see Model Evaluation in the Amazon Bedrock Glossary):
- Model evaluation offers three job types: LLM-as-a-judge (an evaluator model scores a generator model's responses on metrics such as correctness, completeness, and harmfulness, with explanations); programmatic (traditional metrics such as BERTScore, F1, and exact match); and human-based (your workforce or an AWS-managed workforce). You can evaluate a Bedrock model directly, or bring your own inference responses for a non-Bedrock model, in which case Bedrock skips the invoke step and scores the data you supply.
- RAG evaluation for Amazon Bedrock Knowledge Bases (or your own RAG source) offers Retrieval only (metrics such as context relevance and context coverage) and Retrieve and generate (faithfulness/hallucination detection, correctness, completeness). Both rely on the same LLM-as-a-judge technology under the hood.
Results land in the S3 bucket you specify, which means an evaluation job's output is itself a CI artifact you can threshold against.
5.3 Online evaluation — catching what datasets miss
A golden dataset only measures what is in it. Production traffic drifts away from your dataset over time — new question types, new tenants, new edge cases. Online evaluation closes that gap by sampling live traffic (from the invocation logs and spans captured in §4) and scoring it continuously. It will not have ground truth for most live questions, so it leans on reference-free dimensions — faithfulness against the retrieved context, relevance, safety — and on trends rather than absolute pass/fail. Its scores become CloudWatch custom metrics (§7), so a quality decline shows up as a falling line and an alarm, not as a customer complaint.The two modes are complementary, and a healthy platform runs both:
| Offline evaluation | Online evaluation | |
|---|---|---|
| Input | Fixed golden dataset | Sampled live traffic |
| Ground truth | Available (assertions / expected) | Usually absent (reference-free) |
| Determinism | Reproducible | Trend-based |
| Primary use | The CI gate (block regressions) | Drift detection in production |
| When it runs | Per change, in the pipeline | Continuously, on a sample |
5.4 Designing an LLM-as-judge
Both modes lean on LLM-as-judge — using a model to score another model's output (see LLM-as-a-Judge). Done carelessly it is noisy; done well it is the most scalable evaluation technique available. The design choices that matter:- Judge model. Use a strong current model, and prefer a judge at least as capable as the generator. On Amazon Bedrock, select it through a cross-region inference profile (for example
us.anthropic.claude-sonnet-4-6or aglobal.profile), which routes inference across Regions for resilience; see the official model catalog for current IDs and the model-selection guidance. Model evaluation is supported with global inference profiles. - Rubric. Write explicit, independently gradeable criteria, not vibes. "The answer cites a source for every factual claim" is gradeable; "the answer is good" is not. Vague criteria produce noisy scores.
- Structured output. Have the judge return a structured score plus a rationale, so results are machine-comparable and a human can audit a disagreement.
- Variance and flakiness. Judges are non-deterministic. Reduce variance with low/zero temperature, anchor with a few in-rubric examples, and for borderline cases take multiple samples and a majority vote. Measure judge variance explicitly so you can tell a flaky result from a real regression (§9.2).
A minimal judge harness calls a Bedrock model through the
Converse API with a rubric and returns a structured verdict:import json
import boto3
bedrock = boto3.client("bedrock-runtime", region_name="us-east-1")
JUDGE_MODEL = "us.anthropic.claude-sonnet-4-6" # verify against the current model catalog
RUBRIC = """You are a strict evaluator. Score the ANSWER against the CONTEXT and QUESTION.
Return ONLY JSON: {"faithfulness": 0-1, "relevance": 0-1, "rationale": "<one sentence>"}.
faithfulness = every claim in ANSWER is supported by CONTEXT (1.0) ... unsupported (0.0).
relevance = ANSWER addresses QUESTION (1.0) ... off-topic (0.0)."""
def judge(question: str, context: str, answer: str) -> dict:
resp = bedrock.converse(
modelId=JUDGE_MODEL,
system=[{"text": RUBRIC}],
messages=[{"role": "user", "content": [{"text":
f"QUESTION:\n{question}\n\nCONTEXT:\n{context}\n\nANSWER:\n{answer}"}]}],
inferenceConfig={"temperature": 0.0, "maxTokens": 512},
)
text = resp["output"]["message"]["content"][0]["text"]
return json.loads(text)5.5 Boundary with AgentCore Evaluations
Amazon Bedrock AgentCore ships its own evaluation product — a catalog of built-in evaluators (LLM-as-a-judge evaluators such as faithfulness and tool-selection accuracy, plus deterministic trajectory matchers) and an AgentCore-native gate built from its own SDK runners andEvaluate API. That product is documented end to end in the AgentCore Evaluations Practical Guide (AgentCore Observability in the Amazon Bedrock Glossary gives the term-level definition). The division of labor: reach for AgentCore's built-in evaluators when your workload runs on AgentCore and the built-in metrics fit; reach for the cross-service harness in this article when you need custom scoring logic, want to evaluate non-AgentCore components, or want the gate to live in CodePipeline/CodeBuild rather than the AgentCore SDK. The two compose: an AgentCore evaluator can be one of several scorers your CodePipeline gate aggregates.6. Evaluation Gates in CI/CD
An evaluation that nobody acts on is a dashboard. The point of LLMOps is to make a regression unable to ship. The mechanism is a CI gate: a pipeline stage that runs the offline harness against the golden dataset and fails the build when quality drops below a floor or regresses against the current baseline.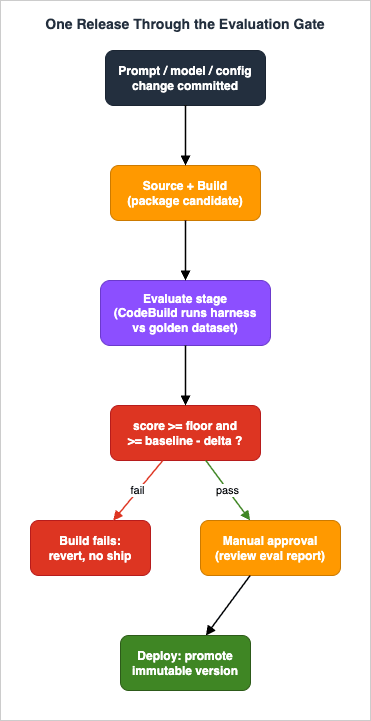
6.1 The gate as a CodeBuild step
CodeBuild produces test reports through report groups: in a project'sbuildspec, the reports section names the result files your test run produces (JUnit-style XML is the common format), and each build creates a new report in that group. A project can define up to five report groups, and reports are retained for 30 days. The build's exit code is what fails the stage — so the evaluation harness must exit non-zero when the gate fails, and also emit a JUnit report so the result is visible in the CodeBuild console and the pipeline.A buildspec that runs the harness and gates on it:
version: 0.2

phases:
  install:
    runtime-versions:
      python: 3.12
    commands:
      - pip install -r eval/requirements.txt
  build:
    commands:
      # Runs the same judge harness from section 5 over the golden dataset.
      # Compares each dimension to a floor and to the stored baseline,
      # writes JUnit XML, and exits non-zero if any dimension fails.
      - python eval/run_gate.py
          --dataset s3://my-eval-datasets/golden/v7.jsonl
          --candidate ./candidate_prompt.txt
          --baseline s3://my-eval-baselines/current.json
          --floor 0.85 --max-regression 0.03
          --junit reports/eval-junit.xml

reports:
  eval-quality:
    files:
      - reports/eval-junit.xml
file-format: JUNITXMLdef gate(results: dict, baseline: dict, floor: float, max_regression: float):
"""results / baseline: {dimension: mean_score}. Returns (passed, failures)."""
failures = []
for dim, score in results.items():
if score < floor:
failures.append(f"{dim} {score:.3f} below floor {floor}")
elif dim in baseline and score < baseline[dim] - max_regression:
failures.append(f"{dim} {score:.3f} regressed from {baseline[dim]:.3f}")
return (not failures), failures6.2 Placing the gate in a pipeline
The gate sits between build and deploy in CodePipeline. A representative shape, in AWS CDK:from aws_cdk import (
aws_codepipeline as cp,
aws_codepipeline_actions as cpa,
aws_codebuild as cb,
)
eval_project = cb.PipelineProject(
self, "EvalGate",
build_spec=cb.BuildSpec.from_source_filename("eval/buildspec.yml"),
environment=cb.BuildEnvironment(build_image=cb.LinuxBuildImage.STANDARD_7_0),
)
pipeline = cp.Pipeline(self, "PromptReleasePipeline")
pipeline.add_stage(stage_name="Source", actions=[source_action]) # prompt/model/config change
pipeline.add_stage(stage_name="Build", actions=[build_action]) # package candidate
pipeline.add_stage(stage_name="Evaluate",
actions=[cpa.CodeBuildAction(action_name="QualityGate",
project=eval_project, input=source_output)])
pipeline.add_stage(stage_name="Approve",
actions=[cpa.ManualApprovalAction(action_name="ReviewEvalReport")])
pipeline.add_stage(stage_name="Deploy", actions=[deploy_action]) # promote the versionEvaluate stage stops the pipeline; the change does not reach Approve or Deploy. The Approve stage adds a human checkpoint: a reviewer reads the eval report and per-dimension diff before a prompt or model change is promoted, which is the right place for the judgment calls automation should not make alone.6.3 Safe promotion and rollback
The gate only protects you if what it evaluates is what ships. Treat prompts and model selections as immutable, versioned artifacts: the gate evaluates version N, andDeploy promotes that exact version (a prompt stored in Parameter Store or a prompt-management store, a model ID pinned in config). Rollback is then trivial and fast — re-promote the previous version — and it is the same operation as a forward deploy, which is what you want at 3 AM.Couple the gate with a progressive deployment strategy for defense in depth: a canary or shadow rollout lets online evaluation (§5.3) score the new version on real traffic before it takes full load, catching regressions the offline dataset did not represent. The deployment strategies themselves — blue/green, canary, shadow — and the deploy-time regression evaluation are covered in the Production Operations Guide (§9), which this gate feeds rather than replaces.
7. Drift, Quality Regression, and Alerting
The CI gate protects what is trying to ship. Drift detection protects what is already live. Even with a clean release, quality erodes over time as the world changes around a frozen model: the question distribution shifts, source documents go stale, an upstream dependency changes behavior. The defense is to turn the online evaluation scores into metrics, alarm on their trends, and route a firing alarm into a runbook that closes the loop back to the dataset.7.1 Kinds of drift
- Input drift — the distribution of incoming questions moves away from what the system (and the golden dataset) was tuned for.
- Quality drift — evaluation scores trend down even though inputs look normal.
- Grounding drift — faithfulness scores fall; the model hallucinates more, often after a knowledge-base change.
- Token / cost drift — input or output token usage creeps up (longer prompts, more verbose answers), which is an operational and budget signal even though this article quotes no prices.
- Latency drift — P90/P99 climbs, often alongside token drift.
7.2 Emitting evaluation scores as metrics and alarming
The online evaluator publishes each dimension's score as a CloudWatch custom metric, dimensioned by prompt version, route, or tenant:import boto3
cw = boto3.client("cloudwatch", region_name="us-east-1")
def publish_scores(scores: dict, prompt_version: str):
cw.put_metric_data(
Namespace="LLMOps/Quality",
MetricData=[
{"MetricName": dim, "Value": value, "Unit": "None",
"Dimensions": [{"Name": "PromptVersion", "Value": prompt_version}]}
for dim, value in scores.items()
],
)from aws_cdk import aws_cloudwatch as cw, Duration
faithfulness = cw.Metric(
namespace="LLMOps/Quality", metric_name="faithfulness",
dimensions_map={"PromptVersion": "v7"},
period=Duration.minutes(15), statistic="Average",
)
cw.Alarm(
self, "FaithfulnessFloor", metric=faithfulness,
threshold=0.85, evaluation_periods=3,
comparison_operator=cw.ComparisonOperator.LESS_THAN_THRESHOLD,
treat_missing_data=cw.TreatMissingData.BREACHING,
)aws/spans give you error- and token-spike alarms straight from the trace store.7.3 Dashboards and the regression runbook
Build one LLMOps dashboard that places the curated GenAI Observability widgets next to your custom quality-score metrics and the alarm states, so an on-call engineer sees behavior and quality together. When a quality-regression alarm fires, the runbook is short and reuses everything already built: pull the trace IDs from the affected window inaws/spans; pull the matching invocation-log records for the actual content; re-run the offline harness on the suspect change to confirm the regression is reproducible; and add the failing production cases to the golden dataset so the gate catches this class of failure on the next release. That last step is what makes the system improve rather than merely alert. The detailed quality-regression runbook and alarm-design principles are in the Production Operations Guide (§10.4–§10.5); this section feeds it the quality signal it needs.8. Cross-Cutting: IAM, Log Privacy, and Data Boundaries
LLMOps telemetry is unusually sensitive: spans and invocation logs contain the actual prompts and answers, which means they contain whatever your users typed and whatever the model said back. The observability and evaluation pipeline therefore has to be governed as carefully as the production path — arguably more so, because it concentrates content from every request into a few queryable stores.8.1 Least-privilege across the pipeline
Separate the roles by job and scope each to the minimum:- The production inference role invokes models; it does not need to read the trace store or the evaluation datasets.
- The online-evaluator role reads invocation logs and
aws/spans, invokes the judge model, and publishes custom metrics — and nothing else. - The CI gate role (CodeBuild) reads the golden dataset and baseline from S3, invokes the judge model, and writes reports; it cannot deploy.
- The deploy role promotes versions; it cannot change the threshold or the baseline.
- The ability to change the gate threshold or the baseline is itself privileged — otherwise the gate can be silently weakened — and should be separated from the ability to author prompts.
A least-privilege policy for the online-evaluator role, scoped to specific resources:
{
  "Version": "2012-10-17",
  "Statement": [
    { "Sid": "ReadInvocationLogs", "Effect": "Allow",
      "Action": ["logs:GetLogEvents", "logs:FilterLogEvents", "logs:StartQuery", "logs:GetQueryResults"],
      "Resource": [
        "arn:aws:logs:us-east-1:123456789012:log-group:/aws/bedrock/model-invocations:*",
        "arn:aws:logs:us-east-1:123456789012:log-group:aws/spans:*"
      ] },
    { "Sid": "InvokeJudgeModel", "Effect": "Allow",
      "Action": ["bedrock:InvokeModel", "bedrock:Converse"],
      "Resource": "arn:aws:bedrock:*:123456789012:inference-profile/us.anthropic.claude-sonnet-4-6" },
    { "Sid": "PublishScores", "Effect": "Allow",
      "Action": "cloudwatch:PutMetricData", "Resource": "*",
      "Condition": { "StringEquals": { "cloudwatch:namespace": "LLMOps/Quality" } } }
  ]
}
8.2 Privacy of logged content
Because invocation logging is account-and-Region wide and spans capture request content, the pipeline can accumulate PII at scale. Layer the controls:- Redact at the Collector before content leaves your boundary (the
attributes/redactprocessor in §3.3 is the first line) — and never put raw secrets, credentials, or full PII into span attributes in the first place. - Mask in CloudWatch Logs with sensitive-data-protection data-protection policies on the
aws/spansand invocation-log groups, which detect and mask sensitive data; Transaction Search supports data masking on spans. - Encrypt and expire. Use KMS for invocation logging and for the log groups and S3 buckets, and set retention deliberately — telemetry that exists forever is a liability, not an asset.
- Restrict reads. The roles in §8.1 are the access-control half of privacy: the fewer principals that can read raw content, the smaller the exposure.
8.3 Data boundaries
In a multi-tenant platform, tag spans and metrics with a tenant ID (via baggage, §3.2) and ensure the evaluation pipeline never reads across tenant boundaries — the judge call for tenant A must not see tenant B's content, and the golden datasets are tenant-scoped where the data is sensitive. Remember that the judge call is itself a model invocation: it is logged, it consumes tokens, and it is governed by the same boundaries — evaluating sensitive content sends that content to the judge model, which must be in-boundary. Tenant isolation as a whole is its own subject; this section only insists that the observability and evaluation plane respect the same boundaries the production plane does.9. Failure Modes
A Level 400 architecture is defined as much by how it fails as by how it works. The failures below are the ones that emerge specifically from connecting the pieces — each is a seam between two components. For each: the symptom, the root cause, how to isolate it, and the fix.9.1 Missing or broken traces
Symptom. Traces show gaps — a model call with no parent, a tool span that never links to the request that triggered it — or a multi-service request appears as several disconnected traces. Evaluation cannot tie a score back to a request.Root cause. W3C Trace Context was not propagated across a hop: a custom HTTP client that does not inject
traceparent, an async boundary (SQS, EventBridge, a thread pool) that drops it, a missing or misconfigured propagator, or Transaction Search not enabled so spans never reach aws/spans.Isolation. Search
aws/spans for the trace ID and see where the chain stops; confirm OTEL_PROPAGATORS=tracecontext,baggage is set on every service; check that the Collector is receiving from the broken hop; verify Transaction Search is enabled and the resource policy grants X-Ray logs:PutLogEvents.Fix. Propagate context explicitly across async and queue boundaries (carry
traceparent as a message attribute, re-attach on the consumer); standardize the propagator across services; ensure framework-native instrumentation is actually active. This is the most common and most invisible failure, which is why §3.3 treats propagation as the central instrumentation concern.9.2 Flaky evaluations
Symptom. The same candidate scores pass on one CI run and fail on the next, with no change to the input. The gate becomes a coin flip and the team starts ignoring it.Root cause. Judge non-determinism amplified by an ambiguous rubric, or a judge model whose variance is high on borderline cases.
Isolation. Run the judge N times on the disputed cases and measure score variance; high variance on a specific subset points at rubric ambiguity for those cases.
Fix. Tighten the rubric into independently gradeable criteria; lower temperature; anchor with in-rubric examples; take multiple samples and a majority vote for borderline items; and explicitly separate "flaky" (high variance) from "real regression" (a consistent score drop) before you trust either. Track judge variance as its own metric so flakiness is visible rather than mistaken for a regression.
9.3 Drift that the gate cannot see
Symptom. Every release passes the gate, but users report worse answers and online scores sag.Root cause. The golden dataset is stale or unrepresentative — production has moved on to question types the dataset does not contain — or online sampling is too sparse to detect the shift.
Isolation. Compare the distribution of live questions against the dataset; check whether the sagging online dimension is even represented in the offline set.
Fix. Continuously refresh the dataset from production failures (§7.3 closes this loop); raise online sampling on the affected segment; add the newly-seen failure classes as dataset rows so the gate gains coverage. A gate is only as good as the dataset behind it.
9.4 False judgments
Symptom. The judge fails a genuinely good answer, or passes a bad one. The gate blocks a good release or lets a regression through.Root cause. The judge is weaker than the generator, the rubric does not match what "good" means for this task, or the judge exhibits position or verbosity bias.
Isolation. Have a human spot-check the cases where the judge and the prior baseline disagree; a pattern (always preferring the longer answer, always preferring the first option) reveals a bias.
Fix. Use a judge at least as capable as the generator; switch to pairwise comparison for preference-style decisions; debias by randomizing option order and controlling for length; and calibrate the judge against a small human-labeled set so you know its agreement rate before you trust it to gate releases.
9.5 A gate that is too strict or too loose
Symptom. The build is always red (nobody can ship) or never red (regressions sail through).Root cause. A miscalibrated threshold — a single absolute floor set too high or too low, with no baseline-relative component.
Fix. Use the two-part threshold from §6.1 (absolute floor and regression delta from baseline), set per dimension, and recalibrate periodically as the baseline improves. A floor alone goes stale; a delta alone lets slow erosion through. Both together track quality without blocking healthy iteration.
9.6 Telemetry volume getting away from you
Symptom. Ingestion and storage grow faster than traffic; queries slow down.Root cause. 100% span indexing, verbose invocation logging across every modality, and online evaluation scoring every request.
Fix (qualitative — no figures). Index a representative fraction of spans (Transaction Search indexes a configurable percentage; sample at the Collector); scope invocation logging to the modalities you actually evaluate; sample online evaluation rather than scoring every request; and set retention deliberately. The Production Operations Guide (§4.5) covers telemetry-cost triage in depth.
10. Frequently Asked Questions
How is this different from AgentCore Evaluations?AgentCore Evaluations is the AgentCore-native product: a catalog of built-in evaluators and a gate built from the AgentCore SDK and
Evaluate API, documented in the AgentCore Evaluations Practical Guide. This article builds the cross-service layer above it: custom evaluation logic, Amazon Bedrock evaluations, and a CodePipeline/CodeBuild gate that can score components outside AgentCore. They compose — an AgentCore evaluator can be one scorer your pipeline aggregates.Is LLM-as-judge reliable enough to gate releases?
Yes, when designed deliberately: an explicit rubric, a judge at least as capable as the generator, low temperature, variance measurement, and calibration against a human-labeled set. Gate on a two-part threshold (absolute floor plus regression delta) rather than a single number, keep a human approval step for promotion, and treat the judge's own variance as a tracked metric. The combination is far more reliable than any single judged score.
Do I still need invocation logging if I already have spans?
They serve different purposes. Spans give you structure, timing, and token metrics; invocation logging gives you the verbatim request and response content. Online evaluation needs the content — you cannot grade an answer you did not record — and large or binary payloads only land in S3 via invocation logging. Use both.
How do GenAI Observability, Application Signals, and Transaction Search relate?
Transaction Search is the span store (spans in
aws/spans, converted to OTel semantic-convention format with W3C trace IDs). Application Signals is the APM experience built on those spans. CloudWatch generative AI observability adds curated, GenAI-specific dashboards (Model Invocations and AgentCore agents) on top. You enable Transaction Search first; the others build on it.How do I keep PII out of the telemetry?
Layer it: redact at the ADOT Collector before data leaves your boundary, apply CloudWatch Logs sensitive-data-protection policies and Transaction Search data masking, encrypt with KMS, set short retention, and restrict which roles can read the raw content. Never place secrets or full PII into span attributes to begin with. See §8.2.
Can I send this telemetry to a third-party backend like Datadog or Langfuse?
Yes — that is a primary reason to standardize on OpenTelemetry. AgentCore Observability is OTEL-compatible and integrates with Arize Phoenix, Braintrust, Dynatrace, Datadog, Langfuse, LangSmith, and others. For AgentCore-hosted agents, set
DISABLE_ADOT_OBSERVABILITY=true to redirect from the default CloudWatch pipeline, or fan out from the Collector to both.Should I start with offline or online evaluation?
Start offline. A small golden dataset and a CI gate give you the highest leverage first — they stop regressions before they ship. Add online evaluation once the gate is in place, to catch the drift that a fixed dataset cannot represent. The two share one judge harness, so the second is incremental once the first exists.
How do I watch token usage without quoting cost?
Token usage is a first-class span attribute (
gen_ai.usage.input_tokens / output_tokens) and a GenAI Observability metric. Trend it, attribute it by route and tenant, and alarm on upward drift — all as an operational signal. For the monetary side, link to the official Amazon Bedrock and CloudWatch pricing pages rather than computing figures in your application or your article.11. Summary
Generative AI quality fails silently, and ordinary observability is blind to it. The fix is to treat quality as a measured, gated signal — the discipline of LLMOps — and to implement it as one cross-service control plane on AWS.This article built that plane. You instrument once with OpenTelemetry and ADOT, getting correlated spans whose W3C Trace Context and baggage stitch a request together across agents and services. You observe in CloudWatch — generative AI observability dashboards, Application Signals, X-Ray Transaction Search over
aws/spans, and Bedrock model invocation logging for the verbatim content. You evaluate in two modes that share one judge harness: offline against a golden dataset, the reproducible workhorse that powers the gate, and online over sampled live traffic, which catches drift. You gate every prompt and model change in CodePipeline, where a CodeBuild stage runs the harness, fails the build on a regression, and a human approves before promotion — with versions immutable so rollback is just a re-promote. You watch the live system for drift by emitting evaluation scores as CloudWatch metrics and alarming on their trends, then feed failing production cases back into the dataset so the gate keeps improving. And you govern the whole plane with least-privilege roles, redaction and masking of logged content, and tenant data boundaries, because the telemetry concentrates everything your users said and everything the model answered.The architecture is deliberately the layer above the single-agent and AgentCore-native tools it delegates to: the cross-service platform that turns four signals — metrics, logs, traces, and evaluations — into a release that cannot regress and a production system that tells you when it starts to.
12. References
AWS official documentation- Generative AI observability - Amazon CloudWatch
- Transaction Search - Amazon CloudWatch
- Enable Transaction Search
- OpenTelemetry on Amazon CloudWatch
- Amazon CloudWatch Application Signals
- Monitor model invocation using CloudWatch Logs and Amazon S3
- Evaluate the performance of Amazon Bedrock resources
- Evaluate model performance using another LLM as a judge
- Amazon Bedrock AgentCore Observability
- Add observability to your Amazon Bedrock AgentCore resources
- Report groups - AWS CodeBuild
- Test reporting - AWS CodeBuild
- What is AWS CodePipeline?
- Increase throughput with cross-region inference - Amazon Bedrock
- Supported Regions and models for inference profiles
OpenTelemetry and ADOT
- AWS Distro for OpenTelemetry (ADOT)
- OpenTelemetry Semantic Conventions for Generative AI
- W3C Trace Context
AWS blogs and What's New
- AgentOps: Operationalize agentic AI at scale with Amazon Bedrock AgentCore
- Generative AI observability now generally available for Amazon CloudWatch
- Observing Agentic AI workloads using Amazon CloudWatch
- New RAG evaluation and LLM-as-a-judge capabilities in Amazon Bedrock
- Amazon Bedrock Evaluations
Anthropic / Claude
Related Articles on This Site
- Amazon Bedrock AgentCore Evaluations Practical Guide
The built-in evaluators and the AgentCore-native CI gate that this article delegates to and composes with. - Amazon Bedrock AgentCore Production Operations Guide
The four-signal model, AgentCore telemetry-pipeline setup, deployment strategies, and quality-regression runbooks this architecture aligns with. - AI Agent Engineering Glossary
Definitions for tracing, spans, LLM-as-judge, regression testing, and trajectory evaluation. - Amazon Bedrock Glossary
Definitions for model evaluation, AgentCore Observability, and LLM-as-a-judge. - Agentic RAG Architecture on Amazon Bedrock
The retrieval-quality control loop whose evaluation depends on this LLMOps plane. - Responsible-AI Guardrails Architecture on AWS
The content-safety layer whose decisions this plane observes and evaluates.
References:
Tech Blog with curated related content
Written by Hidekazu Konishi