Synthetic Monitoring and Real User Monitoring on AWS - What a Canary Run Proves, What a Real Session Proves, and What Neither One Can Tell You
First Published:
Last Updated:
No matter how closely you examine the server-side telemetry, you will not find the answer. The reason is simple: server-side metrics only know about the requests the server received and how it responded to them. Requests that did not reach the server are not recorded. Events that occur in the browser after a response is sent are not recorded either. What happens during periods of inactivity also is not recorded.
Two kinds of fact are missing: the fact you manufacture by probing, and the fact your users bring with them. AWS provides a separate tool for each. The first is the canary in Amazon CloudWatch Synthetics, and the second is the app monitor in Amazon CloudWatch RUM.
This article is not an introduction or setup guide for these tools. The setup instructions are available in the AWS user guides, and there are already published resources on implementing them for smaller websites. This article focuses on what each tool can prove, and what it cannot. Furthermore, it addresses what ongoing maintenance you will need to perform after implementing them.
One distinction belongs up front. A canary that succeeded is not a user who succeeded. What a canary measures is how the system handles the traffic you send, along a path you define. The same principle applies in reverse: the absence of data in RUM does not mean nothing is happening. RUM only knows about the sessions that occurred and were sampled.
The technical details in this article were verified against the Amazon CloudWatch user guide, Amazon CloudWatch Synthetics API reference, CloudWatch Application Signals API reference, Amazon CloudWatch Internet Monitor, and Network Synthetic Monitor documentation, as well as the AWS Cloud Operations Blog and AWS What's New, as of September 7, 2026. Availability, supported platforms, and deprecation dates are subject to change. You must always verify this information at the time of reading. This article does not discuss pricing.
Table of Contents
- 1. The Alarm Is Green and the User Is Not
- 2. Two Ways to Manufacture a Fact
- 3. Manufacturing the Fact Yourself with Synthetics Canaries
- 4. What a Single Run Leaves Behind
- 5. That Canary Is Now Something You Maintain
- 6. The Facts Your Users Bring with CloudWatch RUM
- 7. What Neither One Can Answer
- 8. How the Two Connect Under Application Signals
- 9. Where to Put the Canary
- 10. Adjacent Tools and Where They Stop
- 11. Failure Modes
- 12. Frequently Asked Questions
- 13. Summary
- 14. References
1. The Alarm Is Green and the User Is Not
1.1 The Situation This Article Assumes
This article assumes that the reader is already operating a production web application or API and has implemented metrics, logs, and traces. It does not address the initial setup of monitoring; rather, it focuses on a stage where questions remain even after monitoring has been implemented.These questions fall into two categories: Does this path still function during periods with no users? And what is happening to the users who are currently using the system? Neither of these questions can be answered using server-side telemetry alone. The first is unanswerable because there is no input, and the second is unobservable because the monitoring points sit inside the server itself.
1.2 The Boundary With the Existing Articles
This article will not cover the following areas. The existing articles below already own them.| Existing article | What it owns |
|---|---|
| AWS Observability Architecture Guide - End-to-End Tracing, Metrics, and Logs with CloudWatch, X-Ray, Application Signals, and OpenTelemetry | How to integrate cross-service telemetry. In particular, Section 6 (SLOs, Alarms, and Application Signals) includes two types of SLOs, error budgets, alarms that combine multiple windows and multiple burn rates, and definitions within CloudFormation. This article stops at the point where it discusses using canary and RUM as sources for SLIs, and does not describe how to determine thresholds. |
| AWS Observability Glossary - CloudWatch, X-Ray, Application Signals, and OpenTelemetry Explained | Definitions of terms. Includes sections on Synthetics, canary, CloudWatch RUM, Internet Monitor, and Network Synthetic Monitor. This article does not rewrite any of the definitions. |
| Web Performance Checklist for Core Web Vitals - LCP, INP, and CLS | Methodologies for measuring from the browser's perspective. Distinguishes between lab data and field data, defines Core Web Vitals thresholds and improvement methods, and defines evaluation based on the 75th percentile. This article does not describe either the thresholds or the improvement methods. |
| Route 53 Health Check and Failover - Common Pitfalls and Designs | Design of health checks and DNS failover. This also includes the configuration that connects canary metrics to health checks via alarms. This article does not describe the design of health checks. |
| Load Testing on AWS - Which Policy Actually Applies, Why the Load Generator Runs Out First, and What a One-Minute Metric Hides | The load testing process itself. Covers AWS policies, limitations of the load generator, and differences in aggregation granularity. This article only includes the distinction that canary should not be repurposed for load generation. |
| OpenTelemetry-Native Observability on AWS - OTLP Ingestion, PromQL, and the X-Ray SDK Transition | OTLP ingestion and transition from the X-Ray SDK. This article only mentions the fact that RUM on mobile devices uses OpenTelemetry, and does not include any implementation details. |
| Incident Triage Flowcharts - Network, DB, and Application Layer | Procedures for isolating issues across layers. This article only states that neither measurement method points to the root cause, and does not describe the isolation procedures. |
| Indie Dev Guide: From Domain Acquisition to Live Site with AWS Route 53, S3, CloudFront, and ACM | Steps for implementing RUM on small, static websites. Describes creating an app monitor and embedding a snippet. This article does not describe the implementation steps. |
| Safe Foundation Model Rollout Strategies on AWS - Canary Traffic Shifting, Evaluation Gates, and Automated Rollback | Deployment methods for gradually shifting traffic. The term canary carries a different meaning there. Section 2.2 draws the line. |
| Self-Hosted Static Site Analytics - A Privacy-First Implementation Guide | Self-hosted analytics and privacy design. This article does not delve into general measurement concepts or privacy design. |
| AWS History and Timeline regarding Amazon CloudWatch - Overview, Functions, Features, Summary of Updates, and Introduction | Timeline of feature additions for CloudWatch. This article does not present a timeline. |
| Continuous Profiling on AWS | Understanding where time is being spent within a process. This article focuses on what can be observed from the outside. |
| Orchestrating Regional Failover with Amazon Application Recovery Controller Region Switch | Mechanisms for executing a switchover. This article only addresses the aspects related to determining whether a switchover should occur. |
1.3 What Server-Side Telemetry Structurally Cannot See
The server-side measurement points focus on the period between a request reaching the application and the server returning a response. From this vantage point, there are four things that are fundamentally impossible to observe.- Requests that never reach the application. Issues such as DNS resolution failures, unsuccessful TLS handshakes, or dropped requests along the way will not generate any application metrics.
- Events occurring after the response is sent. This includes JavaScript exceptions, rendering delays, and periods of inactivity while waiting for fonts. The server simply returns a 200 status code and completes its task.
- The state of the system when there is no traffic. When there are zero requests, metrics like success rate and response time are undefined. Problems caused by faulty configurations during the late hours will remain undetected until the first user encounters them in the morning.
- Variations between individual users. Average and median values represent the behavior of the majority. A degradation confined to one geography, one network, or one class of device disappears inside the overall aggregate.
Synthetic monitoring addresses items 1 and 3. Real user monitoring addresses items 2 and 4. These two approaches do not address the same problem from different angles; they address entirely separate problems.
2. Two Ways to Manufacture a Fact
2.1 Facts You Manufacture and Facts Your Users Bring
Synthetic monitoring generates its own traffic. You decide when, from where, along which paths, and at what frequency that traffic is sent. The result is a fact that arrives even when no user does. What arrives, though, is limited to the paths you defined.Real user monitoring only yields a fact when a user is actually there. Nobody chooses who arrives, when, or from where. What that buys is the distribution as it actually is. What it costs is any knowledge of the hours nobody came.
This asymmetry is a central theme throughout this article. What one approach excels at, the other inherently lacks.
| Synthetic Monitoring (Synthetics canary) | Real User Monitoring (CloudWatch RUM) | |
|---|---|---|
| Who generates the traffic | You | Your users |
| Observable time | The whole schedule you define | Only while users are present |
| Observable paths | Only the paths you define | The paths users actually take |
| Where the observation point sits | An AWS-managed execution environment | The user's device |
| With no users present | Still runs | Produces nothing |
| Reveals the distribution | No | Yes |
2.2 A Synthetics Canary and a Deployment Canary Are Different Things
The most frequent use of the termcanary on this site is not the synthetic monitoring sense. It refers to a gradual deployment technique, where traffic is incrementally shifted to a new version. The existing article Safe Foundation Model Rollout Strategies on AWS carries that sense of canary in its own title.While they share the same name, these two concepts are fundamentally different in their purpose and scope.
| Synthetics canary | Deployment canary | |
|---|---|---|
| What it does | Regularly tests predefined paths and records the results. | Directs a portion of traffic to the new version to observe its performance. |
| Traffic source | Traffic your own synthetic tests generate. | Traffic from real users. |
| When it runs | Continuously, according to a schedule. | Only during a release. |
| What happens on failure | Metrics degrade, and alarms are triggered. | The switch to the new version is halted, or a rollback is initiated. |
Throughout this article,
canary used on its own means a Synthetics canary. Where the deployment sense is meant, this article says so explicitly.2.3 What Each Measurement Sees
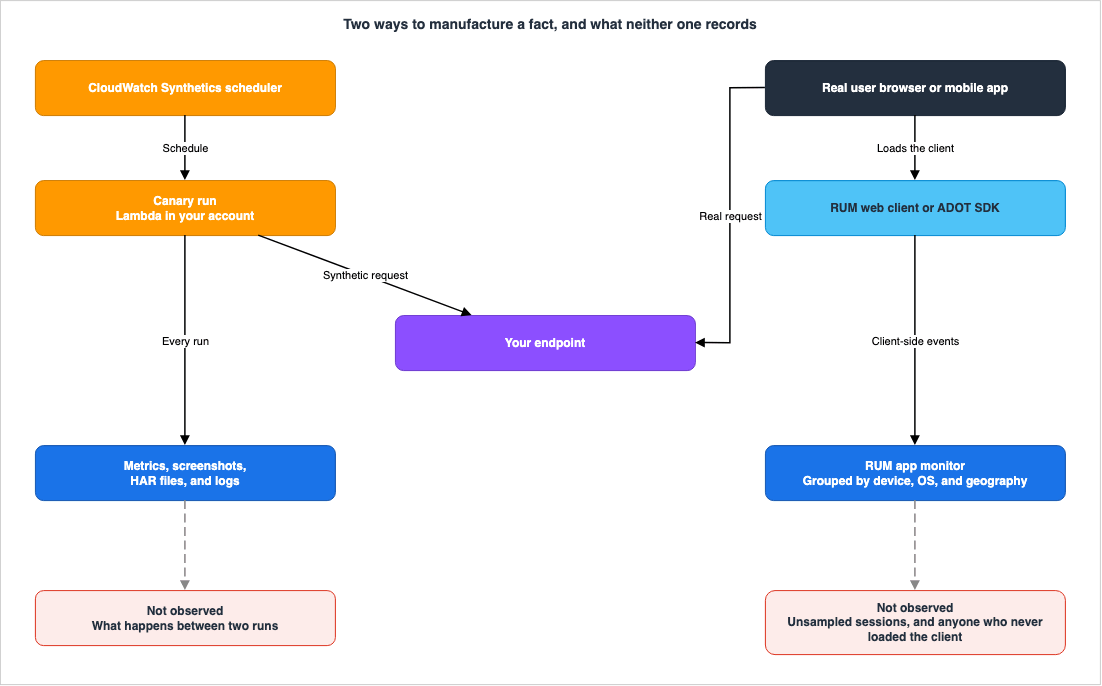
The right side of the diagram represents real user monitoring. A client runs inside the user's browser or mobile app, and observed data is sent to the RUM app monitor. This segment only operates when a user is actively using the application.
The central portion of the diagram represents a segment that neither system observes. If a user encounters an issue while the canary is not running, that failure may not be recorded by either system. Sessions that RUM sampling never captured are even less likely to leave a trace.
3. Manufacturing the Fact Yourself with Synthetics Canaries
3.1 What a Canary Is Made Of
The CloudWatch Synthetics user guide describes a canary as follows:You can use Amazon CloudWatch Synthetics to create canaries, configurable scripts that run on a
schedule, to monitor your endpoints and APIs. Canaries follow the same routes and perform the
same actions as a customer, which makes it possible for you to continually verify your customer
experience even when you don't have any customer traffic on your applications.The last clause of the second sentence is the reason synthetic monitoring exists. Even without user traffic, you can execute the same steps as a user and check the result. As Section 7 argues, that is not the same as measuring the user's experience. However, what AWS is asserting here is correct: the verification process remains uninterrupted.
A canary is composed of four components:
| Component | What it determines |
|---|---|
| Script | Which steps to execute, in what order, and what constitutes success. |
| Runtime version | The combination of language, libraries, and browser used to run the script. |
| Schedule | How frequently the script is executed. |
| Artifact location and execution role | Where the results are written, and what permissions are required to do so. |
You can write scripts in Node.js, Python, or Java. Node.js and Python runtimes allow you to interact with headless browsers through Playwright, Puppeteer, and Selenium WebDriver. Browsers supported include Chrome and Firefox. Canaries using Selenium are limited to Chrome only. The Java runtime does not include a browser and is intended for monitoring that does not require a browser.
Canaries operate by creating and running Lambda functions within your own account. This fact becomes relevant in Section 5. The runtime version becomes a unit of maintenance precisely because the execution environment sits inside your account.
3.2 Blueprints Put Names on Recurring Questions
You can write a canary script from scratch. The user guide also provides blueprints: templates that generate a Node.js script once you fill in the fields in the console.You do not need to memorize blueprints as a list of features. The key takeaway is that a blueprint allows you to define what constitutes success before anything else. The most challenging aspect of monitoring is defining failure, not the run itself.
| What do you want to verify? | Corresponding Blueprint | Definition of Success |
|---|---|---|
| Is that URL still active? | Heartbeat monitoring | The page loads, and a screenshot and HAR file are captured. |
| Is that API still responding as expected? | API canary | The specified HTTP steps succeed in sequence. |
| Is the number of broken links increasing? | Broken link checker | Every link, up to the number you specify, is still alive. |
| Has the appearance changed? | Visual monitoring | The difference between the current run and a baseline screenshot is below a specified threshold. |
| Do the recorded actions still work? | Canary recorder | The recorded sequence of clicks and inputs can be reproduced. |
| Does the flow from login to purchase still work? | GUI workflow builder | The specified element selections, inputs, transitions, and string validations succeed in sequence. |
| Are several different checks all still passing? | Multi checks | Up to a maximum of 10 configured checks succeed in sequence. |
You define multi checks with a JSON configuration covering HTTP, DNS, SSL, and TCP checks. Up to 10 can be included in a single canary.
Blueprints select a runtime. This is discussed in Section 5.4. For now, it is sufficient to know that selecting a blueprint may sometimes limit your runtime options.
3.3 The Range of Schedules
You schedule a canary with either a rate expression or a cron expression. The range of options for a rate expression is clearly defined in the API reference, ranging from once per minute to once per hour. To run a canary only in specific time windows, on specific days of the week, or on specific dates, use a cron expression. The maximum wait time that can be specified with a cron expression is one year.There is no single correct way to determine the frequency. However, there are three factors to consider when making your decision:
- The acceptable delay between a failure in the path and its detection. A canary that runs every five minutes might detect a failure with a delay of up to five minutes in the worst-case scenario.
- The potential side effects of exercising the path itself. A path involving logins, payments, or inventory allocation makes something happen on every run.
- The load placed on the target. The next section takes it up.
3.4 A Canary Adds Traffic to Its Target
A canary sends genuine HTTP requests. That means traffic to the monitored target increases. If you run 20 canaries every minute, that alone will generate a constant stream of 20 requests per minute. If a canary launches a browser, a single run can generate numerous requests, including those for images and scripts.Two things follow.
- Increasing the frequency increases the impact on the target. For sites with low traffic volume, canary traffic can even affect access analytics figures.
- A canary must not be repurposed as a load generator. The shortest interval a rate expression accepts is one minute, and a canary was never designed to apply load. Load testing follows a different design and different guidelines. The existing article Load Testing on AWS covers this area.
4. What a Single Run Leaves Behind
4.1 Metrics
A canary publishes metrics into theCloudWatchSynthetics namespace. You do not need to memorize all of them. It is worth knowing that more than one metric reports whether a run succeeded.| Metric | Description |
|---|---|
SuccessPercent | The percentage of runs that succeeded without encountering any failures. |
SuccessPercentWithRetries | The percentage of runs that ultimately succeeded, including those that passed after retries. |
Duration | The duration, in milliseconds, of a single run. |
Failed | The number of runs the canary was unable to complete due to its own issues. |
Failed requests | The number of HTTP requests sent to the target site that did not receive a response. |
2xx / 4xx / 5xx | Breakdown of HTTP response codes received for requests sent by the canary. |
VisualMonitoringSuccessPercent | The percentage of visual comparisons that matched the baseline screenshot. |
The difference between
SuccessPercent and SuccessPercentWithRetries becomes important when configuring alarms. Whether a run that passed only after a retry counts as a success is a design decision for your monitoring. The former can detect temporary failures but may result in more notifications. The latter reduces notifications but may make it harder to detect intermittent degradation.Duration, SuccessPercent, and SuccessPercentWithRetries all have a Location dimension, which is used with runs from multiple Regions, as described in Section 9.3.4.2 Artifacts
A canary saves logs, screenshots, and HAR files to Amazon S3 on every run. The API reference makes the storage location for those artifacts a required field at canary creation.These artifacts are the greatest value synthetic monitoring delivers. While metrics may indicate a decline, they do not reveal what happened. Screenshots captured at the moment of failure, along with HAR files containing records of all HTTP requests at that time, provide that crucial information.
- The Heartbeat monitoring canary saves screenshots, HAR files, and logs of the URLs accessed.
- The Broken link checker canary, when used with runtimes
syn-nodejs-2.0-betaand later, saves reports that include the links checked, status codes, reasons for failure, and screenshots of both the originating page (where the link was found, with an indicator marking its location) and the destination page. - The Visual monitoring canary saves both screenshots from the baseline run and screenshots from subsequent runs.
Artifacts capture exactly what you show your users. A canary that captures screenshots after login will store the content visible to that specific account in S3. Treat access permissions for that S3 location as a data protection setting, not a monitoring configuration. The user guide's security considerations section likewise recommends keeping tight permissions on the S3 bucket that holds those artifacts.
4.3 The Execution Role
Each canary has its own IAM role. When created through the console, a role with the necessary permissions is automatically created. When creating a role yourself, the trust policy the user guide shows nameslambda.amazonaws.com as the principal. That is the fact that a canary runs as a Lambda function, showing through.The permissions required for a canary's execution role fall into three main categories:
- Permissions for writing artifacts to S3:
s3:PutObject,s3:GetBucketLocationands3:ListAllMyBucketsfor the bucket where artifacts are stored. Canaries that perform visual monitoring also requires3:GetObjectto read baseline screenshots. - Permissions for writing logs to CloudWatch Logs:
logs:CreateLogGroup,logs:CreateLogStream, andlogs:PutLogEvents. - Permissions for publishing metrics using
cloudwatch:PutMetricData. The example in the user guide attaches a condition that limitscloudwatch:namespacetoCloudWatchSynthetics. If you enable X-Ray tracing, you will also need to addxray:PutTraceSegments.
Additional permissions may be required depending on the configuration. The user guide provides four example scenarios. If you encrypt artifacts using a customer-managed key, you will need
kms:Decrypt and kms:GenerateDataKey. If you run the canary within a VPC, you will need permissions to create, retrieve, and delete network interfaces. The two combine, and the user guide's fourth example covers both at once.When a canary fails, it is not uncommon for the issue to stem from incorrect permissions assigned to the canary, rather than the target itself. The user guide's troubleshooting section dedicates a specific section to cases where artifact uploads fail due to permission issues. If you are using a customer-managed key for encryption, a lack of permissions on that key will result in similar symptoms. Similarly, inconsistencies between the bucket policy and the canary's encryption method can also cause failures.
4.4 What One Run Produces, and What It Costs
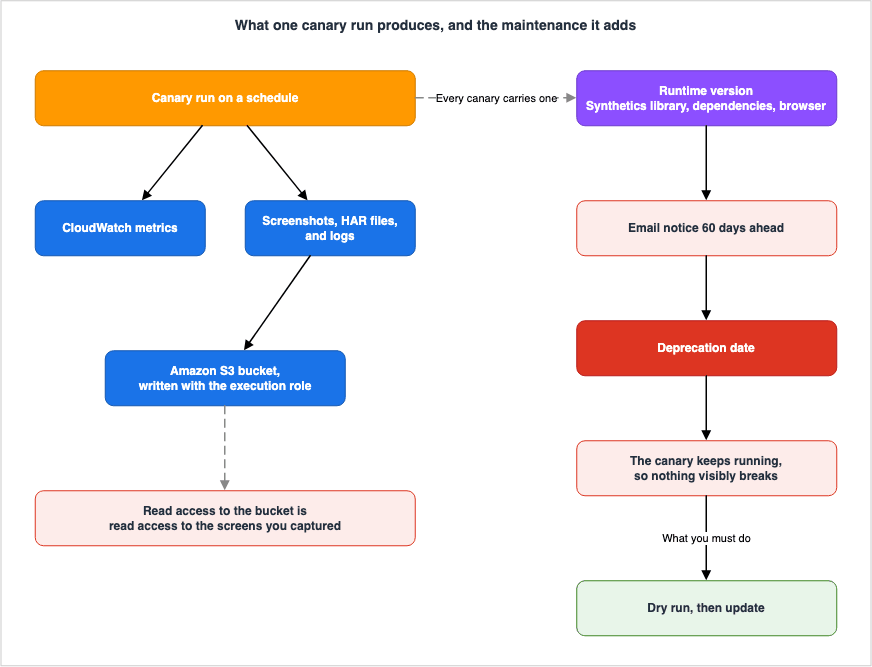
The right half of the diagram is the price. Placing a canary means acquiring one more thing to maintain: a runtime version. The following section will address this in more detail.
5. That Canary Is Now Something You Maintain
5.1 The Runtime Version as a Unit of Maintenance
Synthetics runtimes consist of a combination of Synthetics library code and its dependencies, packaged as a Lambda layer. You choose a runtime version both when you create a canary and when you update one.Runtime versions are named to include the language and framework. There are series that begin with
syn-nodejs-puppeteer-, syn-python-selenium-, syn-nodejs-playwright-, and syn-java-. No version list appears here, as they are subject to change. The current list can be found in the Synthetics runtime versions section of the user guide.5.2 What Happens When a Runtime Is Deprecated
If any component of the runtime is no longer supported, that runtime version becomes deprecated. The user guide clearly explains the behavior at that time.You can't create canaries using deprecated runtime versions. Canaries that use deprecated
runtimes continue to run. You can stop, start, and delete these canaries. You can update an
existing canary that uses a deprecated runtime version by updating the canary to use a
supported runtime version.This second sentence explains why this section was written. Even when deprecated, the canary will continue to run. Therefore, you might not notice. You only discover that your canary is still running on an older version when you attempt to create a new canary, or when something stops working.
There is a notification system in place.
CloudWatch Synthetics notifies you by email if you have canaries that use runtimes that are
scheduled to be deprecated in the next 60 days.
It is an email. It arrives 60 days prior. Whether mail sent to the account's registered address actually reaches whoever watches the monitoring is not something AWS can arrange for you. In addition to this, the troubleshooting section recommends checking AWS What's New, the AWS Health Dashboard, and the runtime version section itself.
Deprecation is not a hypothetical scenario. The user guide's table of deprecation dates lists nine runtime versions under the dates January 22, 2026, and February 3, 2026. Given that you are reading this article, there is a significant possibility that your canary is currently running on a deprecated runtime.
5.3 Testing Before You Update
You can perform runtime version updates from the console, AWS CloudFormation, AWS CLI, or AWS SDK. From the console you can select canaries and update up to five of them at once.However, updating involves moving the canary's scripts to a new runtime environment. Changes in the browser version may alter how elements are identified, and changes in library versions may affect APIs. You often only discover monitoring failures when the production environment experiences issues.
To mitigate this, a dry run is available. This allows you to execute the canary with the updated configuration once, review the results, and then apply those changes to the production canary. The user guide lists
SuccessPercentDryRun and DurationDryRun in the metrics section, specifically for dry runs. When using CloudFormation, setting DryRunAndUpdate to true will trigger a dry run with each update. If the dry run fails, the canary will not be updated, and the deployment will fail.⛔ Here is the most ironic limitation. The section on limitations in the user guide begins with:
Supports runtime versions - syn-nodejs-puppeteer-10.0+, syn-nodejs-playwright-2.0+,
syn-python-selenium-5.1+, and syn-nodejs-3.0+
Dry runs themselves are only supported on relatively recent runtime versions. This means that the very canaries running on older runtimes, the ones you are most cautious about updating, are the ones that cannot use this safety mechanism. The longer a runtime version remains unchanged, the fewer validation methods are available when you eventually need to update it.
There are three other limitations.
You can only execute one dry run per canary at a time
When a dry run fails, you cannot update the canary
Dry run cannot test any Schedule field changes
The third limitation presents a practical challenge. Changes to schedules cannot be verified using a dry run. Issues related to increased frequency or errors in cron expressions will only become apparent after the changes are applied.
An alternative is available when dry runs are not possible. You can duplicate the canary, update the runtime version on the duplicate, and then update the original canary and delete the duplicate once you are confident. A canary subject to the runtime version limitation above will need to use this procedure.
5.4 Blueprints Constrain the Runtime
There are limitations to the combinations of blueprints and runtimes. The user guide states the following regarding visual monitoring:Visual monitoring is supported in canaries running syn-puppeteer-node-3.2 and later. It is not
currently supported in canaries running Python and Selenium, or using Playwright runtimes.The same section also notes that blueprints for API canary and Broken link checker are not compatible with the Playwright runtime. The canary recorder is also not compatible with Playwright.
This limitation conflicts with the updates described in Section 5.2. It is possible to have the desire to move to a new runtime while simultaneously facing the reality that the blueprint you are currently using is not compatible with that runtime. When planning a migration, you need to consider not only the version of the runtime but also the compatibility of your blueprints.
5.5 Two Places Where the User Guide Disagrees With Itself
Cross-referencing the primary sources turns up two discrepancies inside the CloudWatch user guide. Both can affect a reader's decision, so this article records them as they stand.The first concerns the notation of identifiers. The quote in Section 5.4 writes the runtime as
syn-puppeteer-node-3.2. However, in other sections of the same user guide, as well as on the AWS What's New page, this series is consistently referred to as syn-nodejs-puppeteer-. The above quote is presented as it appears in the original document; no corrections have been made. While the intended meaning is clear, using this string directly in configurations will likely result in errors.The second discrepancy relates to version specifications. The chapter on performing safe canary updates lists
syn-python-selenium-5.1+ as a supported runtime for dry runs. However, the chapter on runtime version support policies includes a table indicating that syn-python-selenium-5.1 is deprecated as of February 3, 2026. Neither of these entries is inherently incorrect; the term "5.1 and later" includes versions 5.2 and beyond. However, the situation where a specifically mentioned version is already deprecated can be confusing.One general rule follows: pages describing feature compatibility and those detailing the lifecycle have different update cycles. When making decisions related to versions, do not rely solely on the feature compatibility pages.
6. The Facts Your Users Bring with CloudWatch RUM
6.1 The App Monitor
To use CloudWatch RUM, you need to create an app monitor. The app monitor generates a code snippet that you integrate into your application. Once that code loads, measurement begins.An app monitor is also a unit of scope. For each app monitor, you define which application to monitor, what fraction of sessions to sample, and what data to collect. If multiple applications reside within a single domain, whether or not you group them together will directly determine the granularity of your data aggregation.
6.2 What Web Applications Report
Web applications generate data related to page load times, client-side errors, and user behavior. In addition to the overall aggregated data, it is possible to analyze breakdowns based on device type, operating system, and other characteristics of user activity.The app monitor's settings decide what gets collected. The
AppMonitorConfiguration API reference defines three possible values for Telemetries:| Value | Data Collected |
|---|---|
errors | Unhandled JavaScript exceptions thrown by the application. |
performance | Performance data on how the application and its assets are loaded and rendered, including Core Web Vitals. |
http | HTTP errors thrown by the application. |
It is important to note that Core Web Vitals are included in this data. The existing article Web Performance Checklist for Core Web Vitals addresses how to interpret browser-side metrics and which thresholds to target. This article covers only that those values land in an AWS-side receiver.
6.3 What Mobile Applications Report
RUM supports both iOS and Android applications. This support was announced in November 2025.What gets collected on mobile differs from what gets collected on the web: screen loading times, app startup times, network errors, crashes, and platform-specific interruptions. The interruptions are the state called Application Not Responding on Android and App Hang on iOS.
The implementation approach also differs. The mobile RUM solution incorporates the AWS Distro for OpenTelemetry SDK and sends data to a dedicated endpoint using the OpenTelemetry Protocol. The client for web applications and the SDK for mobile devices are separate components. When creating a mobile app monitor, it is necessary to configure the mobile platform setting. Details regarding the OpenTelemetry configuration are covered in the existing article OpenTelemetry-Native Observability on AWS.
6.4 The Default Samples Only 10 Percent of Sessions
This is the setting that is most easily overlooked in this article. The app monitor configuration includes a session sample rate. The API reference forAppMonitorConfiguration explicitly states the default value for SessionSampleRate.If you omit this parameter, the default of 0.1 is used, and 10% of sessions will be sampled.This is the value used when this parameter is omitted. If you do not explicitly set this value when creating an app monitor, only 1 session in 10 is measured.
It is worth working out what that default means in concrete numbers. For a site that receives 300 sessions per day, only about 30 sessions land in the sample. If a browser-specific defect affects 5% of all sessions, the expected number of sampled sessions that hit the defect is about 1.5 a day. Even after observing data for several days, it may not be possible to determine whether the issue is actually occurring.
Sites with lower traffic volumes need to increase their sample rate. The existing article Web Performance Checklist for Core Web Vitals also recommends setting the sample rate to 100% for sites with low traffic. RUM analysis can be unreliable with small sample sizes, and sampling further exacerbates this issue.
6.5 The Data Disappears After 30 Days
The user data collected by RUM is retained for 30 days and then automatically deleted.End user data that you collect for CloudWatch RUM is retained for 30 days and then automatically
deleted.If you need to retain the data for a longer period, you can configure the app monitor to send copies of the telemetry to CloudWatch Logs. You can then set your own retention period for that log group.
The 30-day timeframe is not ideal for quarterly reviews. It is natural to want to compare data from three months prior. Changing the settings at that point will not recover any historical data.
7. What Neither One Can Answer
The core of this article lies in this section. Adding both measurements does not simply make everything visible. Some things stay invisible with both in place.7.1 Synthetic Monitoring Does Not Reveal the User Distribution
A canary returns a result for the conditions under which it ran. You chose those conditions, and they do not represent the distribution of your users.Specifically, the following information is unavailable:
- Which devices are struggling. A canary runs in the browser you name. It does not reproduce the performance of a user's device, nor whatever extensions are running there.
- Which network paths are degraded. A canary leaves from the AWS network, which is a different thing from a user's connection.
- Which geographies are affected. A canary returns the result seen from the Region it ran in. Probing from several Regions adds vantage points, but a set of vantage points is still not a distribution.
- How many people are affected. A canary failure is one failure. Whether it touched one user or one hundred thousand is not something a canary knows.
This last point makes impact assessment difficult. When a canary goes red, it does not report how many users were affected, which makes it hard to set a priority.
7.2 Real User Monitoring Says Nothing About What Did Not Happen
RUM only reports on sessions that actually occurred and were included in the sample. This creates three blind spots.- Periods when users did not visit are lost. For example, if a deployment breaks something during the late hours, RUM will record nothing until morning. These gaps cannot be distinguished from normal behavior.
- Users who could not reach the site will not generate sessions. RUM clients only become active after a page has loaded. In situations where DNS resolution fails, TLS connections fail, or a CDN returns 5xx errors, the client will not even start. The most serious failures are the ones least likely to reach RUM.
- Sessions that were not included in the sample are effectively ignored. As described in Section 6.4, by default, only 10% of sessions are recorded.
Increasing the sample rate will not resolve issues related to points 1 and 2. By its very nature, RUM only provides information about events that actually happened.
7.3 Neither One Points at a Cause
When a canary fails, all it knows is that a failure occurred, together with the screen and the traffic recorded at that moment. Why it failed lies outside the canary.When RUM indicates a decline in load times, all it knows is the time observed on the client-side. It does not know what portion of that time is due to server-side processing, what portion is due to the network, and what portion is due to the browser's rendering.
To pinpoint the root cause, it is necessary to correlate this data with other telemetry. Both a canary and RUM can turn on X-Ray active tracing, and once enabled, those traces can be correlated on the Application Signals side. Being able to correlate is not the same as knowing the cause. Correlation narrows the candidates. It does not produce the answer. The existing article Incident Triage Flowcharts provides the procedure for isolating issues across layers.
7.4 The Gap That Remains When You Add Both
There are situations where, even after adding both, the gap remains. This occurs when a user who fell outside the sample hits a failure between two canary runs. The canary then returns a successful result, and nothing is left in RUM. That single request may survive in the server-side logs, but the logs cannot say whether it was a failure from the user's point of view.This gap cannot be filled. Knowing that it cannot be filled will determine how much trust you place in monitoring. Being green does not prove that there is no problem; it simply records that no problem was detected.
| Question | canary | RUM | What neither one answers |
|---|---|---|---|
| Does the path still work during hours when nobody is using the system? | Answerable | Not answerable | |
| How many users are currently experiencing issues? | Not answerable | Answerable | |
| On which devices or connections are issues occurring? | Not answerable | Answerable | |
| Are there users who were unable to reach their destination? | Partially answerable | Not answerable | Complete understanding |
| Why is it slow? | Not answerable | Not answerable | Cause identification |
| A failure hit by one user who fell outside the sample, between two runs | Not answerable | Not answerable | Detecting the event at all |
8. How the Two Connect Under Application Signals
8.1 Both Sit Under Application Performance Monitoring
The CloudWatch user guide lists five items under the chapter on Application performance monitoring (APM): Application Signals, Service level objectives (SLOs), Transaction Search, Synthetic monitoring (canaries), and CloudWatch RUM.This list is not an organizational chart; it is a sequence of questions to be addressed. Application Signals reveals the state of services and their dependencies, SLOs measure progress toward defined goals, Transaction Search provides insights into individual transactions, a canary reports what probing from outside found, and CloudWatch RUM offers user-side observations.
A canary and CloudWatch RUM both appear on the Application Signals application map when X-Ray active tracing is turned on. The canary is displayed connected to the services it calls, while RUM clients are displayed as the callers of those services.
8.2 Both Can Supply a Service Level Indicator
When creating SLOs, you must choose where to obtain the metrics. The Application Signals API reference lists the possible values for theMetricSourceType field of the ServiceLevelObjective.Valid Values: ServiceOperation | CloudWatchMetric | ServiceDependency | AppMonitor | Canary | ServiceBoth
AppMonitor and Canary are included in this list. This means a RUM app monitor and a Synthetics canary can supply an SLO indicator on the same footing as a service operation or a dependency.This connects to the discussion in Section 7. If you use a canary as an SLI, the SLO will measure whether the canary is succeeding at the frequency you define. It is not designed to measure user experience. Similarly, if you use an app monitor as an SLI, the SLO will measure the values observed in actual sessions included in the sample. It makes no guarantees about periods when there is no activity.
The choice depends on what you want the SLO to promise to whom. The SLO will only be able to answer questions that the chosen source can answer.
8.3 Enablement Is Independent
The user guide describes the relationship between two features as follows:It is not necessary to enable Application Signals to use CloudWatch Synthetics, or CloudWatch
RUM. However, Synthetics and CloudWatch RUM work with Application Signals to provide benefits
when you use these features together.A canary and RUM both work on their own. Not having Application Signals enabled is no reason to skip synthetic monitoring. Having it enabled is no reason to skip a canary.
8.4 Threshold Design Is Outside This Article
The design of SLOs stops here. The two SLO types (period-based and request-based), the concept of error budgets, alarms that combine multiple windows and multiple burn rates, and how to write the definition in CloudFormation are all owned by Section 6 (SLOs, Alarms, and Application Signals) of the existing article AWS Observability Architecture Guide.This article adds only one point: what attainment means changes depending on whether the indicator comes from a canary or from an app monitor. No matter how carefully you define the thresholds, you will not get meaningful results if the source data cannot answer the question.
9. Where to Put the Canary
9.1 Public Endpoints
If an endpoint is reachable from the internet, a canary can probe it directly. CloudWatch Synthetics is available in all commercial AWS Regions and the GovCloud Regions. However, the user guide includes notes regarding two Regions. AWS PrivateLink is not available in Asia Pacific (Osaka), and neither AWS PrivateLink nor X-Ray is available in Asia Pacific (Jakarta).9.2 Endpoints Inside a VPC
A canary can probe endpoints that live inside a VPC as well. Three prerequisites apply.- Ensure that DNS resolution and DNS hostnames are both enabled on the VPC.
- Add network interface permissions to the canary's execution role. The user guide includes examples for VPCs, such as
ec2:CreateNetworkInterface,ec2:DescribeNetworkInterfaces, andec2:DeleteNetworkInterface. If you are modifying an existing canary to support VPCs, you will also need to add the same permissions. Forgetting this will result in configuration passing but the run failing. - Ensure that the canary has a way to output results.
The third point is often overlooked. The canary runs inside the VPC, but it needs to send metrics to CloudWatch and artifacts to S3. If the VPC has access to the internet, no additional configuration is required. However, if the VPC is configured without internet access, you will need to provision a CloudWatch interface endpoint and an S3 gateway endpoint.
When using an S3 gateway endpoint, ensure that the endpoint's policy also includes the necessary permissions to write artifacts. Simply modifying the execution role will not be sufficient. The troubleshooting chapter explicitly addresses this point.
9.3 Probing From More Than One Location
It is possible to run a single canary from multiple AWS Regions simultaneously. This feature was announced in June 2026. By creating a canary in the primary Region and selecting the replica Regions, CloudWatch Synthetics automatically creates replicas. Run data, metrics, and artifacts are consolidated in the primary Region.This feature relaxes the limitations outlined in Section 7.1, but does not eliminate them. While the number of locations increases, it still represents a collection of locations, not a distribution of users. As the user guide itself points out, the benefits include establishing baseline metrics for each location, identifying Region-specific issues, and reducing false positives by only triggering notifications when issues are detected across multiple locations.
The operational constraints are worth knowing.
| Constraint | Description |
|---|---|
| Runtime version | syn-nodejs-puppeteer-16.0 or later, or syn-nodejs-playwright-7.0 or later. Canaries using older runtimes cannot have replica Regions added. |
| Availability | Available only in commercial Regions. While Synthetics itself can be used in GovCloud, it is not available in the GovCloud (US) or China Regions. |
| Number of replica Regions | Maximum 50 |
| Script size | 50 MB or less (compressed) |
| Name | No canary of the same name may already exist in any replica Region. |
| Where changes originate | All create, update, start, stop, and delete operations are performed from the primary Region and propagate asynchronously. |
| VPC settings | VPC settings are configured individually for each replica Region; they are not inherited from the primary Region. |
| Tags | Tags are not replicated. They must be applied individually in each replica Region. |
| Groups | A multilocation canary cannot belong to a group at all. |
The fact that VPC settings are not inherited becomes relevant when probing internal endpoints from multiple locations.
If your canary requires VPC connectivity, you must configure VPC settings for each replica
Region separately. VPC settings are not inherited from the primary.
Replication runs asynchronously. A state of
InSync indicates that all replicas are synchronized. A replica that fails to provision does not stop the primary canary from being created. The state in that case is Inconsistent, so the state has to be checked after creation.9.4 Mobile
For mobile applications there is no counterpart on the synthetic monitoring side. A canary does not drive the screens of a mobile app. On mobile, the only facts available come from the RUM side.This is the area where the asymmetry described in Section 7 is most pronounced. For mobile applications, there is no way to verify, using these tools, whether the app is still running during periods when it is not actively being used. A canary can call the APIs the app invokes. That is not the same as verifying the app's own path.
10. Adjacent Tools and Where They Stop
CloudWatch includes several monitoring features that share similar names but serve different purposes. This section says only what each one fills in, and where it stops. This is not a comparison table, and it is not a section for ranking the options against each other.10.1 Internet Monitor
Internet Monitor analyzes the performance and availability of the internet segment between an application and its users, using connectivity data drawn from the AWS global network. By creating a monitor and associating it with a VPC, Network Load Balancer, CloudFront distribution, or WorkSpaces directory, you can obtain measurements specific to the locations and Autonomous System Numbers (ASNs) through which your application's traffic flows.The focus is the mirror image of a canary's.
Internet Monitor focuses monitoring on just the subset of the internet that's accessed by the
users of your AWS resources, instead of broadly monitoring your website from every Region in
the world as other tools do.
A canary probes from a location you choose. Internet Monitor covers the places your users are actually coming from. In this respect, Internet Monitor behaves like RUM. It only provides data for locations where users are actually accessing the application.
10.2 Network-Side Monitoring
Under CloudWatch Network Monitoring, in addition to Internet Monitor, there are two features.| Feature | Scope | Prerequisites |
|---|---|---|
| Network Flow Monitor | Network performance information collected by lightweight agents installed on your instances. Visualizes packet loss and latency. | Agent installation required. |
| Network Synthetic Monitor | Round-trip time and packet loss between VPC subnets and on-premises IP addresses. AWS manages the underlying infrastructure. | Connection via AWS Direct Connect or AWS Site-to-Site VPN. |
While the name "Network Synthetic Monitor" includes the term "synthetic," it operates on a different layer than a Synthetics canary. Network Synthetic Monitor measures round-trip time and packet loss at the network layer. A Synthetics canary operates at the application layer, monitoring HTTP and HTTPS traffic. Network Synthetic Monitor does not determine whether a user's access path is broken.
Definitions for the terminology themselves live in the existing article AWS Observability Glossary.
10.3 Route 53 Health Checks
Route 53 health checks and canaries serve different purposes. A health check is a verdict that decides where traffic goes, while a canary is a run that leaves a record. The result of a health check has the side effect of altering DNS responses. Canary results, on the other hand, simply become metrics and do not change anything on their own.You can connect the two by creating a health check that references alarms based on canary metrics. This configuration, and the potential pitfalls associated with it, are owned by the existing article Route 53 Health Check and Failover.
10.4 Load Testing
A canary is a monitoring tool, not a tool for applying load. As Section 3.4 noted, the shortest interval a rate expression accepts is one minute. You must not raise a canary's frequency to probe the target's capacity. Load testing follows separate guidelines and a different design. The existing article Load Testing on AWS covers this area.11. Failure Modes
The failures below follow from what this article has already established. Each one names the section whose facts it derives from.11.1 Treating a Green Canary as Evidence That Users Are Fine
This is the most common mistake. A canary only verifies the paths you had in mind when you wrote it. The actual paths users take will change. New features are added, older screens are removed, and unexpected usage patterns emerge. A canary script does not follow along on its own.There are two responses. Review the paths a canary covers on a regular schedule. And use the RUM side to see which paths users actually take, then compare those against the canary script.
11.2 Treating an Empty RUM Dashboard as Evidence That Nothing Happened
As described in Section 7.2, blank spaces in RUM can arise for three reasons: the user never arrived, the user could not reach the system, or the session fell outside the sample. RUM itself does not differentiate between these possibilities.The appropriate action is to examine the corresponding time window on the canary system when you observe a blank space in RUM. If the canary is green and RUM shows a blank space, it is likely the user did not arrive. If the canary is red and RUM shows a blank space, it is likely the user was unable to reach the system.
11.3 Running With the Default Sample Rate
As stated in Section 6.4, the default setting is 10 percent. On a low-traffic application, leaving this default in place means nothing becomes visible. Nobody notices that nothing is visible, and all that remains is the fact that you turned RUM on.11.4 Missing a Runtime Deprecation
As described in Section 5.2, a canary running on a deprecated runtime does not stop. Because it does not stop, nobody notices. While notifications are sent via email, there's no guarantee that those emails reach the designated personnel responsible for monitoring.The response is to build a regular inventory of runtime versions into your operations. The API provides methods for retrieving lists of both canaries and runtime versions, and the user guide includes a script that can be used to perform these updates in batches.
The longer this is left alone, the harder the remedy becomes. As described in Section 5.3, a dry run is available only on relatively recent runtime versions. Canaries stuck on older versions will require a more complex process: when updating, safety mechanisms are unavailable, necessitating the creation of duplicates for verification.
11.5 Raising the Frequency Until the Measurement Affects the Target
As described in Section 3.4, the canary sends genuine requests. The more frequently these requests are sent, the more the monitoring itself begins to affect the target's metrics. On websites with low traffic, the canary's own traffic shows up in the analytics data.11.6 Treating Artifact Permissions as a Monitoring Setting
As described in Section 4.2, canary artifacts capture the screen exactly as it appeared. A canary that takes screenshots after login stores whatever that account can see into S3. Put off tightening those permissions and the act of adding monitoring becomes an exposure of its own.11.7 Adding Replica Locations and Forgetting the VPC Settings
As described in Section 9.3, VPC settings are not inherited by the replica Regions. A primary canary that reaches an internal endpoint is no guarantee that its replicas can. If the replica remains in anInconsistent state, the monitoring you expect across multiple locations will effectively only cover a single location.11.8 Trying to Retrieve Data Older Than 30 Days
As mentioned in Section 6.5, RUM data is deleted after 30 days. Sending copies to CloudWatch Logs cannot be configured retroactively. If you plan to perform long-term comparisons, you need to configure this setting initially.12. Frequently Asked Questions
Is one of the two enough on its own?
It depends on the use case. Verifying that a path still works during hours with no users takes a canary. Learning what is happening to actual users takes RUM. The two do not answer one question from different angles; they answer different questions. The table in Section 7 also lists the questions neither one answers.If a canary succeeds, does that mean users are succeeding?
No. A canary proves that the path it executed succeeded, at the time it ran, from the environment it ran in. The user's device, network connection, location, and the path they take will all be different. Furthermore, a canary does not retain any information about events that occur between runs.Should I raise the RUM session sample rate?
It depends on the volume of traffic. The default setting is 10 percent, and with sufficient traffic, this rate provides a clear distribution. For smaller sites, maintaining this default setting will make meaningful analysis impossible. Section 6.4 works that out in concrete numbers.Does a canary stop running when its runtime is deprecated?
No. The user guide clearly states that a canary running on a deprecated runtime will continue to function, and you will still be able to stop, start, and delete it. What you will not be able to do is create a new canary using that runtime version. Section 5.2 quotes the original text.Can I always run a dry run before upgrading a runtime version?
No. The dry run itself supports only a limited set of runtime versions, and a canary running on an older version may not be able to use it at all. Even on a supported version there are three limitations: only one dry run per canary at a time; a canary cannot be updated while its dry run has failed; and schedule changes cannot be validated with a dry run. Section 5.3 quotes the original text.Does visual monitoring work on every runtime?
No. The user guide explicitly states that visual monitoring is supported only on specific versions of Puppeteer-based runtimes, and is not supported on Python and Selenium runtimes, nor on Playwright runtimes. The API canary and broken link checker blueprints are also not compatible with Playwright runtimes. Section 5.4 quotes the original text.Can a canary monitor a mobile app?
No. A canary does not drive the screens of a mobile app. On mobile, the only facts available come from the RUM side. You can point a canary at the APIs the app calls, but that does not verify the app's own path. Section 9.4 covers this.What changes if an SLO takes its indicator from a canary instead of an app monitor?
The difference lies in what the SLO is measuring. Metrics gathered from a canary measure whether the defined path is succeeding at the frequency you specified. Metrics from an app monitor, on the other hand, measure the values observed in the real sessions that landed in the sample. If the source of the data cannot answer a particular question, the SLO will not provide an answer either. Section 8.2 covers this.Can I use canaries and RUM without enabling Application Signals?
Yes. The user guide states plainly that enabling Application Signals is not necessary to use CloudWatch Synthetics or CloudWatch RUM. The relationship is that using them together brings additional benefits. Section 8.3 quotes the original text.Is Network Synthetic Monitor the same thing as a Synthetics canary?
No. Network Synthetic Monitor measures round-trip time and packet loss between a VPC subnet and on-premises destinations. A Synthetics canary, on the other hand, operates at the application layer, monitoring HTTP and HTTPS traffic. Because they monitor different layers, they cannot be used as replacements for each other. Section 10.2 covers this.Can more canaries substitute for a load test?
No. The shortest interval a rate expression accepts is one minute, and a canary is not a tool for applying load. Raising the frequency of a canary also adds traffic to the monitored target, so the measurement starts affecting what it measures. Load testing follows separate policies and a separate design.13. Summary
This article makes six claims.1. Server-side telemetry has structural blind spots. It misses requests that never arrived, events after the response, hours with no traffic, and differences between one user and another. Even with detailed measurement, these gaps remain invisible due to the limitations of observation points.
2. Synthetic monitoring can manufacture a fact with no users present. CloudWatch Synthetics' canaries execute predefined paths at specified intervals. The blueprint allows you to define what constitutes a successful outcome. Screenshots and HAR files generated as artifacts reveal information that metrics alone cannot.
3. Placing a canary means acquiring one more thing to maintain. That thing is the runtime version, and it can be deprecated. Even after deprecation, the canary keeps running, so nobody notices. Notification of deprecation is sent via email 60 days in advance. While you can perform a dry run before an update, you cannot verify schedule changes. Furthermore, dry runs are only available on relatively newer runtime versions. The longer a canary is left alone, the fewer ways there are to upgrade it safely.
4. Real user monitoring reflects the actual distribution of events. CloudWatch RUM's app monitor collects web page load times and client-side errors on the web, and screen loads and crashes on mobile devices. By default, it only samples 10% of sessions. Data is deleted after 30 days.
5. Neither approach identifies the root cause. Canaries only know about failures and the associated logs at the time of the failure. RUM only knows about the time observed on the client-side. Correlating this data with X-Ray traces can narrow down potential causes. Correlation is a process of narrowing down possibilities; it is not a process of finding a definitive answer.
6. Green does not prove that nothing is wrong. If a single user experiences a failure between canary runs, and that user is not included in the sample, neither system will record the incident. This gap cannot be filled. Knowing that these gaps exist is crucial for determining how much to trust your monitoring systems.
One more time, here is what this article did not cover. Determining appropriate SLO thresholds and configuring burn rate alerts is detailed in Section 6 of the existing article AWS Observability Architecture Guide. Guidance on interpreting browser-side metrics and how to improve them can be found in the existing article Web Performance Checklist for Core Web Vitals. The steps for implementing RUM are outlined in Step 8 of the existing article Indie Dev Guide.
14. References
- Synthetic monitoring (canaries) - Amazon CloudWatch User Guide
- Using canary blueprints - Amazon CloudWatch User Guide
- Synthetics runtime versions - Amazon CloudWatch User Guide
- Runtime versions support policy - Amazon CloudWatch User Guide
- Runtime versions update - Amazon CloudWatch User Guide
- Performing safe canary updates - Amazon CloudWatch User Guide
- Required roles and permissions for canaries - Amazon CloudWatch User Guide
- CloudWatch metrics published by canaries - Amazon CloudWatch User Guide
- Running a canary on a VPC - Amazon CloudWatch User Guide
- Multilocation canaries - Amazon CloudWatch User Guide
- Managing multilocation canaries - Amazon CloudWatch User Guide
- Monitoring and troubleshooting multilocation canaries - Amazon CloudWatch User Guide
- Troubleshooting a failed canary - Amazon CloudWatch User Guide
- Security considerations for Synthetics canaries - Amazon CloudWatch User Guide
- CloudWatch RUM - Amazon CloudWatch User Guide
- Set up a mobile application to use CloudWatch RUM - Amazon CloudWatch User Guide
- OTLP Endpoints - Amazon CloudWatch User Guide
- Application performance monitoring (APM) - Amazon CloudWatch User Guide
- Application Signals - Amazon CloudWatch User Guide
- How Internet Monitor works - Amazon CloudWatch User Guide
- How Network Synthetic Monitor works - Amazon CloudWatch User Guide
- Using Network Synthetic Monitor - Amazon CloudWatch User Guide
- What is Amazon CloudWatch?
- MultiLocationConfig - Amazon CloudWatch Synthetics API Reference
- Amazon CloudWatch real user monitoring (RUM) adds support for iOS and Android applications - AWS What's New
- Amazon CloudWatch RUM now supports an improved App Monitors overview with health, SLO, and tracing status - AWS What's New
- Amazon CloudWatch Synthetics now supports multilocation canaries - AWS What's New
- Amazon CloudWatch Synthetics now supports bundled multi-check canaries - AWS What's New
- AWS CloudWatch Synthetics adds safe canary updates and automatic retries - AWS What's New
- Amazon CloudWatch Synthetics Adds Java Runtime for Lightweight API Monitoring - AWS What's New
- Amazon CloudWatch Synthetics adds multi-browser support for application testing - AWS What's New
References:
Tech Blog with curated related content
Written by Hidekazu Konishi