OpenTelemetry-Native Observability on AWS - OTLP Ingestion, PromQL, and the X-Ray SDK Transition
First Published:
Last Updated:
That translation layer is no longer mandatory. CloudWatch now accepts OTLP directly and exposes the result to Prometheus Query Language, and AWS X-Ray has designated OpenTelemetry as its primary instrumentation standard while placing its own SDKs and daemon into maintenance mode. Two of the three things a telemetry pipeline consists of — the wire protocol and the query language — changed underneath you.
This article is about what to do with the CloudWatch assets you already have. It is not an introduction to OpenTelemetry, and it does not explain how to instrument an application. It assumes you already run CloudWatch metrics and logs in production, and it addresses one decision: whether to keep managing two metric systems in parallel, or to fold one into the other, and in what order.
Every AWS fact below was verified against AWS official documentation on 2026-08-09, with the specific page linked at the point of use. Specification versions and stability levels are stated with the same confirmation date. This article reports no measurements: no ingestion latency was timed, no query was benchmarked, and no cardinality experiment was run. Where AWS publishes a number, it is quoted as an AWS statement with the page it came from. No pricing figures appear anywhere, including in the sections where cost is the usual reason people care — the trade-offs here are argued in terms of cardinality, retention, query limits, and operational surface instead.
Table of Contents
- 1. Introduction: The Decision This Article Supports
- 2. What Changed on the Backend Side
- 3. The OTLP Data Model and Why Flattening Is Needed
- 4. Label Scope Rules in Practice
- 5. Querying with PromQL
- 6. Cardinality and Retention as Design Constraints
- 7. Shaping Data at Ingestion
- 8. Where Each Metric Should Live
- 9. Histograms and Aggregation
- 10. The X-Ray SDK Transition
- 11. Migration Playbook
- 12. Failure Modes
- 13. Frequently Asked Questions
- 14. Summary
- 15. References
1. Introduction: The Decision This Article Supports
The situation is common enough to be boring. A platform team runs CloudWatch for AWS service metrics and alarms, because that is where the vended metrics are and where the on-call rotation already looks. The same team runs a Prometheus-compatible store for application and container metrics, because those metrics carry a dozen labels each and the classic CloudWatch dimension model cannot hold them. Dashboards are split across two systems, alarms are defined twice in two syntaxes, and every new service has to be onboarded into both.The reason that split existed was a backend limitation, and the limitation is gone. That does not automatically mean you should collapse the two systems, and it certainly does not mean you should do it all at once. But it does mean the question is now live, and answering it requires knowing three things precisely: how OTLP data actually appears once CloudWatch has stored it, what the ingestion and query limits are, and which of your existing assets have to be rebuilt versus which can be left alone.
1.1 What this article covers
The scope is deliberately narrow, and it is the backend half of the pipeline.- The generational change itself — what became OTel-native in ingestion, storage, and query, and what only looks new.
- The OTLP hierarchy and its flattening — how resource attributes, instrumentation scope, and data point attributes map into a single flat label space, and why they have to.
- The label scope rules, character by character — the prefix notation, the handling of attribute names that contain dots, and the quoting rules. This is the part where being one character wrong produces an empty result rather than an error message.
- Cardinality and retention as constraints — the published limits, what they are measured against, and what they imply for label design.
- Shaping at ingestion — the server-side mechanism for adding, dropping, and renaming attributes before storage, and what it deliberately refuses to touch.
- Placement — which metric belongs in which store, and how to unwind dual management.
- The X-Ray SDK transition — the support state of the SDKs and the daemon, the migration path, and the sequencing of a parallel run.
1.2 What this article delegates
Four published articles already own adjacent territory, and this one stays out of it.- Instrumentation architecture in full — how to wire the ADOT SDK and Collector across serverless and container tiers, trace context propagation, sampling design, the Embedded Metric Format, metric filters, service level objectives, Application Signals, composite alarms, and burn rates. All of that belongs to AWS Observability Architecture Guide. Application Signals appears here only as one of the producers that lands metrics on the OTel path.
- The generative AI semantic conventions — the attribute and metric vocabulary for model calls, agents, and tool use. That is OpenTelemetry GenAI Semantic Conventions Guide, and no attribute inventory is reproduced here.
- Alarm semantics — including how a PromQL alarm behaves differently from a metric alarm. Section 11 notes that alarms are consumers that must be rebuilt, and hands the behavior itself to Amazon CloudWatch Alarm Design Guide.
- LLM operations telemetry and evaluation — LLMOps Observability and Evaluation Architecture on AWS.
Container orchestration is also out of scope. Container Insights with OpenTelemetry is mentioned once, as a producer of OTel metrics, and is not developed further. Two further neighbors stay out as well. The profiles signal that section 3 records as in Development is a subject in its own right, and what a flame graph on AWS is actually showing is covered in Continuous Profiling on AWS. Real user telemetry is the other: a CloudWatch RUM app monitor for an iOS or Android application is instrumented with an ADOT mobile SDK and ships over OTLP, and what such a monitor can and cannot establish is covered in Synthetic Monitoring and Real User Monitoring on AWS.
How the standard itself came to exist is out of scope as well. Two competing vendor-neutral specifications stood side by side before a foundation merger ended the split, and only the project the foundation actually held could be formally archived. That lineage is in Observability and OpenTelemetry History and Timeline. This article takes OpenTelemetry as given and describes what the AWS backends do with it.
1.3 How the facts were established
Every AWS behavior below comes from an AWS primary source: the Amazon CloudWatch User Guide, the AWS X-Ray Developer Guide, the Amazon Managed Service for Prometheus User Guide, the AWS CLI Command Reference, AWS What's New announcements, and the AWS Cloud Operations Blog. Specification claims come from the OpenTelemetry and Prometheus project documentation, with the version and stability label quoted rather than paraphrased. Where a value can change — a quota, a Region list, a support phase — the confirmation date is stated in the text so a later reader can tell how stale it is.No destructive or irreversible action was taken while preparing this article. OTel enrichment was not enabled, no telemetry pipeline was created, no Collector was deployed, and no metric was deleted. Where a procedure below changes account-level state, that is called out at the point of use.
2. What Changed on the Backend Side
The useful framing is not "CloudWatch now supports OpenTelemetry." It is that CloudWatch now carries two metric models side by side, and AWS documents both as fully supported rather than presenting one as a replacement for the other.2.1 Two models, compared axis by axis
The following comparison is reproduced from the CloudWatch User Guide, which presents these as a choice rather than a migration mandate.| Axis | OpenTelemetry Metrics | CloudWatch Metrics (Classic) |
|---|---|---|
| Ingestion | OTLP endpoint, via OTel SDKs and collectors | PutMetricData API, Embedded Metric Format |
| Query language | PromQL | CloudWatch Metrics Insights (SQL) |
| Identity | Metric name plus up to 150 labels per data point | Namespace, metric name, up to 30 dimensions |
| Metric types | Gauge, sum, histogram, exponential histogram | Single values, statistic sets |
| Alarms | PromQL-based alarms | Standard metric alarms |
| Console | Query Studio | CloudWatch metrics console |
| Storage | Up to 15 months | Up to 15 months with automatic rollup |
Two details in that table deserve to be read literally rather than smoothed over. First, the guide labels the OpenTelemetry column "Recommended" and describes it as the path for new workloads, high-cardinality labels, and PromQL-compatible dashboards, while describing Classic as the fit for existing integrations and low-cardinality AWS service metrics. Second, the storage row is not symmetric in the source: the Classic row says "Up to 15 months with automatic rollup" and the OpenTelemetry row says "Up to 15 months". Section 6 comes back to that asymmetry rather than resolving it by inference.
2.2 The sequence, with dates
The capability arrived in stages, and the stages matter because a document or a blog post written between them describes a different product.| Date | Event | Source |
|---|---|---|
| 2026-04 | CloudWatch OpenTelemetry metrics enters public preview, in five Regions, with no charge for OTel metrics or querying during the preview | What's New announcement |
| 2026-04 | Query Studio enters public preview in the same five Regions | What's New announcement |
| 2026-06 | Native OpenTelemetry metrics with PromQL querying reaches general availability, with a Prometheus-compatible query API | What's New announcement |
| 2026-06 | Query Studio reaches general availability | What's New announcement |
| 2026-06 | CloudWatch pipelines gains processing and enrichment for OpenTelemetry metrics | What's New announcement |
The AWS Cloud Operations Blog post that introduced the capability carries an explicit editor's note dated July 2026 saying it was updated for general availability, and lists what arrived with it: server-side telemetry pipelines, cross-account centralization into a monitoring account, EKS Container Insights with GPU and EFA monitoring, and bearer token authentication for sends from environments without AWS credentials. If you are reading a preview-era write-up, those four things are the delta.
For the longer arc of how CloudWatch got here, AWS History and Timeline of Amazon CloudWatch tracks the announcements individually.
2.3 What is genuinely new, and what only looks new
It is worth separating these, because the answer changes what you have to do.Not new: the OpenTelemetry SDKs, the Collector, ADOT, and the practice of exporting OTLP. Those have been available and supported for years. If your applications already emit OTLP to a Collector, the instrumentation side of your estate does not change at all.
New: the destination. Metrics can now be sent to a CloudWatch endpoint that speaks OTLP natively, stored with their attribute structure intact, and queried with PromQL. Traces can be sent to an X-Ray endpoint that speaks OTLP. AWS vended metrics can be projected into the same label space without an exporter.
The practical consequence is that the change is mostly a Collector configuration change and a consumer rewrite, not an application rewrite. Application code that already speaks OTLP keeps speaking OTLP. What changes is where the exporter points, and what language your dashboards and alarms are written in. That is a much smaller blast radius than "adopt OpenTelemetry," and it is also why the migration can be done workload by workload.
2.4 The producers that land on the OTel path
Four things now put data on the OTLP path in CloudWatch, and knowing which is which matters for section 7, because the ingestion-time shaping rules treat them differently.- Custom application metrics emitted by OTel SDKs or a collector to the metrics endpoint.
- AWS vended metrics, once OTel enrichment is enabled on the account and Region, republished as OTel data points with resource attributes and resource tags.
- Managed Prometheus collectors, which scrape Prometheus-compatible endpoints and deliver metrics in OpenTelemetry format for PromQL querying, announced in July 2026.
- Container Insights with OpenTelemetry and CloudWatch Application Signals, both of which the CloudWatch User Guide names as reasons to choose the OpenTelemetry model.
3. The OTLP Data Model and Why Flattening Is Needed
To understand the label rules in section 4, you need one structural fact about OTLP and one about PromQL, and the tension between them.3.1 The OTLP hierarchy
The OpenTelemetry metrics data model organizes a metric stream into nested levels. A Resource identifies the entity producing the telemetry and carries resource attributes such asservice.name or cloud.region. Within a resource, an InstrumentationScope identifies the library or module doing the instrumenting, and carries a name, a version, and its own attributes. Within a scope, a Metric has a name and a type. Within a metric, individual data points each carry their own attribute set, and it is the combination of those attributes that produces distinct time series.The same attribute name can therefore appear at more than one level, and the level is part of the meaning.
service.name set as a resource attribute says "everything under this resource came from that service." A service attribute set on a data point says something narrower and possibly different. A model that discards the level discards information.3.2 The PromQL constraint
PromQL has no such hierarchy. A time series in Prometheus is a metric name plus a flat set of key-value labels, and a query selects by matching those labels. There is no syntax for "the resource-level value ofservice.name as opposed to the data-point-level value," because in the Prometheus model there is only one level.So a backend that ingests OTLP and exposes PromQL has to choose. It can discard the levels and merge everything into one namespace, at the cost of collisions and lost meaning. Or it can encode the level into the label name itself, at the cost of a notation that the reader has to learn. CloudWatch does the second, and section 4 is that notation.
3.3 The dots problem, and why it is now solved
There is a second, more mundane collision. OpenTelemetry semantic conventions name attributes with dots —service.name, http.request.method, cloud.account.id. Prometheus, before version 3, did not allow dots in metric or label names.The historical workaround was to replace dots with underscores during translation. The CloudWatch documentation describes the consequence plainly: "Previously, these dots were replaced with underscores during translation, causing discrepancies between what was defined in OTel conventions and what was queryable in Prometheus." You instrumented
service.name and queried service_name, and every conversation about a query started by establishing which spelling was in play.Prometheus 3 removed the restriction. The CloudWatch User Guide states that CloudWatch uses PromQL based on the Prometheus 3.0 specification, including support for UTF-8 metric names and label names. The Prometheus project's own UTF-8 guide puts the change this way: "Versions of Prometheus before 3.0 required that metric and label names adhere to a strict set of character requirements. With Prometheus 3.0, all UTF-8 strings are valid names."
This is why the label names in section 4 look the way they do. Dots survive. What you instrumented is what you query. The cost is a quoting rule, which is the subject of section 4.3.
3.4 Specification versions and stability, as of 2026-08-09
Because this article makes claims about a protocol and a convention set that are both versioned, the versions and their stability labels are stated here rather than left implicit. The same discipline is applied throughout OpenTelemetry GenAI Semantic Conventions Guide, and for the same reason: a claim about a specification is only meaningful with a version attached.| Artifact | Version | Stability, as published | Confirmed |
|---|---|---|---|
| OTLP Specification | 1.11.0 | "Stable for the trace, metric and log signals. Development for the profiles signal." | 2026-08-09 |
| OpenTelemetry Semantic Conventions | 1.44.0 | Varies per convention; individual conventions carry their own stability badge | 2026-08-09 |
| OpenTelemetry maturity vocabulary | — | Development, Stable, Deprecated. The specification notes that "Development" was previously called "Experimental" and that uses of "Experimental" should be treated the same | 2026-08-09 |
Two consequences follow for a migration plan. First, the transport itself is not a risk you are taking on: OTLP is stable for the three signals you care about here. Second, the vocabulary is where the movement is. A convention that is in Development can change its attribute names, and if you have built dashboards and alarms on those names, the change lands on you. Section 12 treats that as a failure mode rather than a footnote.
The CloudWatch metrics endpoint accepts "OTLP 1.x" according to its published endpoint limits, which is a version range rather than a pinned version.
4. Label Scope Rules in Practice
This is the section that decides whether your queries return data. The notation is small, but it is unforgiving in a particular way: a wrong prefix is a valid query that matches nothing. You do not get a syntax error, you get an empty result set, and an empty result set is indistinguishable from "the metric is not being emitted."4.1 The prefix convention
CloudWatch distinguishes OTLP-scoped labels from ordinary Prometheus labels with an@ prefix, and distinguishes structural fields from attributes by doubling it. The User Guide states the rule as: fields within each scope use a double-@ prefix, for example @resource.@schema_url, while attributes use a single-@ scope prefix, for example @resource.service.name.The complete mapping, reproduced from the PromQL querying page of the CloudWatch User Guide:
| OTLP scope | Fields prefix | Attributes prefix | Example |
|---|---|---|---|
| Resource | @resource.@ | @resource. | @resource.service.name="myservice" |
| Instrumentation Scope | @instrumentation.@ | @instrumentation. | @instrumentation.@name="otel-go/metrics" |
| Datapoint | @datapoint.@ | @datapoint. or bare | cpu="cpu0" or @datapoint.cpu="cpu0" |
| AWS-reserved | N/A | @aws. | @aws.account_id="123456789" |
Read that table as three separate rules rather than one.
Rule one: the scope is the first segment.
@resource., @instrumentation., @datapoint., @aws.. This is what tells the query engine which level of the OTLP envelope you mean.Rule two: a second
@ means you are asking for a structural field, not an attribute you set. @instrumentation.@name is the instrumentation scope's name — a field of the scope itself. @instrumentation.library would be an attribute named library that somebody attached to the scope. These are different things and the extra @ is the only thing distinguishing them.Rule three: data point attributes also work bare. The documentation gives the equivalence directly:
{"http.server.active_requests"} and {"@datapoint.@name"="http.server.active_requests"} are equivalent. Bare access exists for backward compatibility with standard PromQL queries, which is what lets an existing Grafana dashboard keep working.4.2 The one place the documentation is not self-consistent
On the same User Guide page, the AWS-reserved row of the scope table gives@aws.account_id="123456789" as its example, while the table of labels available on enriched vended metrics lists "@aws.account" described as the AWS account where the metric was ingested, alongside "@aws.region" described as a system label for the ingesting Region.Both spellings appear on that page, in different tables, and AWS does not reconcile them there. Rather than pick one and present it as settled, the honest handling is: treat neither as confirmed, and discover the actual label names in your own account before you write a query against them.
The discovery endpoints exist precisely for this.
/api/v1/labels returns the available label names and /api/v1/label/label_name/values returns the values for one of them, both requiring cloudwatch:ListMetrics. One call answers the question definitively for your account and Region, and it costs nothing but a signed request. This is the general habit worth forming: for any AWS-reserved label, discover it rather than transcribe it.4.3 Quoting and the placement of the metric name
A PromQL expression here is enclosed in curly braces and specifies a metric name plus an optional set of label matchers. The quoting rule follows from Prometheus 3's UTF-8 support, and the Prometheus project's UTF-8 guide states it directly.Names that are legacy-compatible — letters, digits, underscores, colons — can be written the classic way. Names that are not must be quoted and placed inside the braces. The guide's examples are
{"my.metric"} for a metric name with a dot, and {"metric.name", "my.label.name"="bar"} when the label name also contains one. It adds a style note worth following: "The metric name can appear anywhere inside the braces, but style prefers that it be the first term."Because every CloudWatch OTLP scope prefix begins with
@, every scoped label name has to be quoted, always. There is no version of @resource.service.name that works unquoted.Putting the rules together, here is the progression from simplest to fully scoped, using the examples published in the CloudWatch User Guide.
{"http.server.active_requests"}Selects every time series for that metric. The metric name is quoted because it contains dots.
{"http.server.active_requests", "@resource.service.name"="myservice"}Adds a matcher on a resource attribute. Both the metric name and the label name are quoted.
{"http.server.active_requests",
 "@resource.service.name"="myservice",
 "@aws.region"=~"us-.*"}
Combines matchers, and uses the regex-match operator on an AWS-reserved label.
avg_over_time(
  {"http.server.active_requests",
   "@resource.service.name"="myservice"}[5m]
)
Wraps the selector in a range and applies a function, which is ordinary PromQL from that point on.
By contrast, an enriched vended metric whose name and dimension are both legacy-compatible needs no quoting at all:
{Invocations, FunctionName="my-api-handler"}That asymmetry is worth internalizing, because it means queries against AWS vended metrics and queries against convention-conformant application metrics look different, and a reader who has only seen one will write the other wrong.
4.4 The mapping, visualized
The figure below shows the same telemetry twice: on the left as OTLP structures it on the wire, on the right as it appears once CloudWatch has flattened it into a label space you can match against.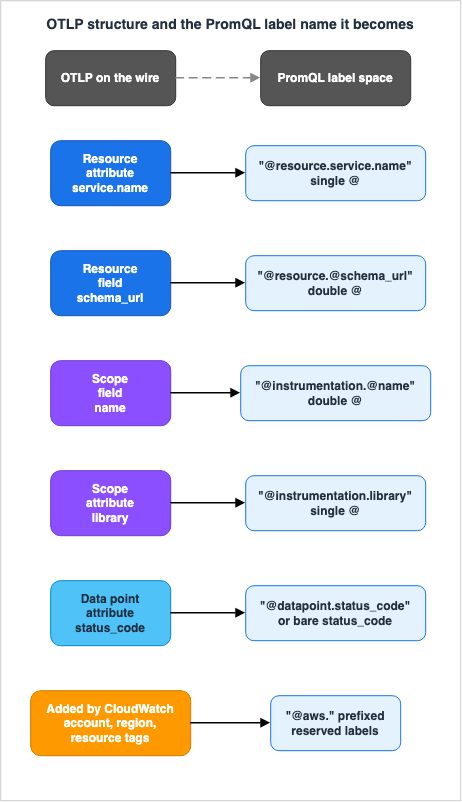
4.5 A habit that prevents most of the mistakes
Three practices remove the majority of prefix errors.- Discover before you write. Call
/api/v1/labelsagainst your own account and Region, or use the label-values tool in Query Studio, and read the actual label names off the result rather than reconstructing them from documentation. - Verify the selector before you build the expression. Run the bare selector first and confirm it returns series. If it returns nothing, the problem is the selector, not the aggregation you were about to wrap around it.
- Write the scope explicitly even where bare access works.
@datapoint.status_codeandstatus_codeselect the same thing, but the first one tells the next reader which level the attribute lives at, and it keeps working if a resource-level attribute with the same name is introduced later.
5. Querying with PromQL
With the label rules settled, the remaining questions are what you can ask, where you can ask it from, and where the ceiling is.5.1 What is selectable
The CloudWatch User Guide describes PromQL support as covering selection by metric name and label matchers, mathematical functions and operators across time series, aggregation across dimensions such as service, Region, or account, and computation of rates, histograms, quantiles, and moving averages. Label matchers support exact match, not-equal, regex match, and negative regex match. Aggregation operators named in the guide includesum, avg, min, max, count, and topk.Metric types map onto PromQL in the way a Prometheus user would expect: a counter is queried through
rate() or increase(), a gauge is queried directly, and a histogram is queried through histogram_quantile().5.2 Vended metrics, and the label that disambiguates them
Once OTel enrichment is enabled — section 8.2 covers what that does and does not change — AWS vended metrics become queryable with the same syntax. The enriched metric keeps its original CloudWatch metric name, and the original CloudWatch dimensions become data point attributes, which is why they can be matched bare.The enrichment adds a set of labels documented with an EC2 instance as the worked example:
@resource.cloud.resource_id holds the full ARN, @resource.cloud.provider, @resource.cloud.region, and @resource.cloud.account.id hold the obvious things, @instrumentation.@name identifies the source service as something like cloudwatch.aws/ec2, @instrumentation.cloudwatch.source holds a source identifier such as aws.ec2, @instrumentation.cloudwatch.solution marks it as produced by the enrichment layer, and resource tags appear under @aws.tag..One of those is more useful than it first appears.
@instrumentation.@name is how you disambiguate metric names that several AWS services share. The User Guide makes the point with CPUUtilization, which EC2 and RDS both publish:histogram_avg({CPUUtilization, "@instrumentation.@name"="cloudwatch.aws/ec2"})Without that matcher, the selector spans every service that publishes a metric by that name. This is a direct consequence of dropping namespaces: in the Classic model,
AWS/EC2 and AWS/RDS kept the two apart structurally, and in the OTel model the instrumentation scope is what does that job.Being able to reach vended metrics in the same language as application metrics is what makes a certain class of question answerable in one query, and load balancer scaling is the canonical example: the scaling behavior itself, and which vended metrics actually reveal it, is the subject of a companion article in this series, How Elastic Load Balancing Scales. This article stops at the query mechanics.
Resource tags becoming query labels is the other capability worth planning around, because it lets ownership and environment be query dimensions without any instrumentation change:
sum by ("@aws.tag.Team")(
    {Invocations, "@instrumentation.@name"="cloudwatch.aws/lambda"}
)
5.3 Where queries run
Four surfaces execute the same PromQL, and the choice is about ergonomics rather than capability.| Surface | What it is for | Notes |
|---|---|---|
| Query Studio | Interactive authoring and visualization in the CloudWatch console | Generally available since 2026-06. Supports both PromQL and Metrics Insights, per-query cross-account and cross-Region selectors, guided builders, and export into dashboards |
| Prometheus-compatible HTTP API | Programmatic access | https://monitoring.<AWS Region>.amazonaws.com/api/v1/<operation>, signed with SigV4 using monitoring as the service name |
| Grafana and Amazon Managed Grafana | Existing dashboards | Add an Amazon Managed Service for Prometheus data source pointed at https://monitoring.<AWS Region>.amazonaws.com. SigV4 signing is built into the plugin and always enabled, so there is no toggle |
| CloudWatch MCP Server tools | AI assistants and development tools | execute_promql_query, execute_promql_range_query, get_promql_label_values, get_promql_series, get_promql_labels |
The Grafana route has version floors that are easy to trip over. The CloudWatch User Guide states that AMP plugin v3.0.0 requires one of four Grafana version ranges, and the Amazon Managed Grafana documentation separately asks for workspace version 12.4 or later with AMP plugin 3.0.0 or later. The four accepted ranges are these.
| Lower bound, inclusive | Upper bound, exclusive |
|---|---|
| 11.6.11 | 12 |
| 12.0.10 | 12.1 |
| 12.1.7 | 12.2 |
| 12.2.5 | none |
If a data source refuses to connect, check the plugin and Grafana versions against that table before checking the query.
5.4 IAM, precisely
Query permissions are finer-grained than "read CloudWatch," and getting them half right produces a confusing failure where charts render but autocomplete does not.| API endpoint path | Required actions |
|---|---|
/api/v1/query | cloudwatch:GetMetricData and cloudwatch:ListMetrics |
/api/v1/query_range | cloudwatch:GetMetricData and cloudwatch:ListMetrics |
/api/v1/series | cloudwatch:ListMetrics |
/api/v1/labels | cloudwatch:ListMetrics |
/api/v1/label/label_name/values | cloudwatch:ListMetrics |
GetMetricData covers instant and range queries; ListMetrics covers series and label discovery. Granting only the first gives you a working query with no autocomplete and no label browsing.On the write side, the identity publishing through the OTLP metrics endpoint needs
cloudwatch:PutMetricData — the same action as the Classic API, despite the different wire protocol.5.5 What PromQL does not replace
Adding PromQL did not remove anything. Metrics Insights remains the SQL query surface for Classic metrics,GetMetricStatistics still works, and the original classic form of a vended metric is explicitly documented as unmodified by enrichment and still available through existing CloudWatch APIs.This matters for planning, because it means the two query languages are a coexistence, not a cutover. Query Studio deliberately hosts both. A team can adopt PromQL for new application metrics while leaving years of Metrics Insights queries and metric-math dashboards untouched, and nothing forces the second half.
5.6 The query ceiling
PromQL querying carries its own published limits, separate from the ingestion limits in section 6. These are per account, and were confirmed on 2026-08-09 against the CloudWatch User Guide's PromQL limits table.| Limit | Value | Response |
|---|---|---|
| Query requests per second | 300 | 422 |
| Discovery requests per second | 10 | 422 |
| Concurrent query requests | 30 | 429 |
| Concurrent discovery requests | 30 | 429 |
| Series returned per query request | 500 | 200 with a truncated response |
| Labels returned per discovery request | 10,000 | 200 with a truncated response |
| Time range per request | 7 days | 422 |
| Series scanned per 24-hour window | 100,000 | 422 |
| Samples scanned per 24-hour window | 300,000,000 | 422 |
| Samples processed per 24-hour window | 3,000,000,000 | 422 |
| Execution timeout | 20 seconds | 422 |
Three of these change how you design, not just how you operate.
The 500-series cap returns 200, not an error. A dashboard panel that should show 900 series shows 500 of them and reports success. Section 12 treats this as a failure mode because it is silent by construction.
The 7-day maximum range includes range parameters and lookback periods. Quarter-over-quarter comparisons in a single PromQL request are not available; that shape of analysis needs recording elsewhere or a different tool.
The per-24-hour scan and process budgets are account-wide and shared by everything: dashboards on auto-refresh, alarm evaluations, ad hoc exploration, and any automation. A dashboard with a short refresh interval and wide selectors consumes that budget continuously, and the failure lands on whoever queries next.
6. Cardinality and Retention as Design Constraints
The 150-label figure gets quoted a lot, usually as a headline. It is more useful read as one row in a table of interacting limits, because the others are what you actually hit first.6.1 The metrics endpoint limits
The following is the metrics-endpoint portion of the OTLP endpoint limits table in the CloudWatch User Guide. Confirmation date: 2026-08-09. Basis for inclusion: every row AWS publishes for the metrics endpoint, transcribed without selection. This is not an exhaustive inventory of every constraint that could affect ingestion — it is one published table, quoted whole.| Limit | Value | What it is measured against | Error code |
|---|---|---|---|
| Maximum TPS | 500 | Requests per second per account | 429 |
| Maximum new series creation rate | 1,000,000 | New series in a 10-minute window. Applies only to creating new metric names, not to ingesting data points for existing metrics | 429 for a fully throttled request, 200 for a partially throttled one |
| Maximum request size | 1 MB | Uncompressed size of the request | 400 |
| Maximum datapoint count | 1,000 | Data points in a single request, summed across ResourceMetrics, ScopeMetrics and Metrics | 400 |
| Maximum metadata size | 40 KB | Combined size of all labels and label values for a series, per data point | 400 for fully invalid, 200 for partially invalid |
| Maximum label count | 150 | Labels across Resource, Scope, and Datapoint attributes, per data point | 400 for fully invalid, 200 for partially invalid |
| Metrics created timestamps | 10 minutes future, 14 days past | Timestamp on the data point | 400 |
Alongside those, the protocol constraints are worth knowing before you write a Collector config: the endpoint supports HTTP only and does not support gRPC, accepts OTLP 1.x, takes binary or JSON payloads, supports gzip or no compression, and requires the
sigv4authextension collector extension, or bearertokenauth if you are using bearer token authentication.6.2 What the numbers actually constrain
150 is a sum, not a per-level allowance. The limit is stated as labels "across Resource/Scope/Datapoint attributes per datapoint." A resource block that carries thirty attributes has spent thirty of your budget on every data point beneath it. Teams that push deployment metadata, Kubernetes metadata, and ownership tags into the resource block can consume a surprising fraction before the application adds anything.40 KB of metadata is the limit you hit before 150 labels. Labels with long values — ARNs, URLs, fully qualified pod names — hit the byte ceiling well short of the count ceiling. If ingestion is rejecting data points and the label count is nowhere near 150, check the byte size.
The new-series creation rate is the cardinality-explosion tripwire. It is scoped to creating new metric names within a 10-minute window rather than to steady-state ingestion, so a deployment that introduces a large batch of new metrics is the shape of workload that meets it.
Partial failure returns 200. This is the operationally significant one. For the metadata-size and label-count limits, AWS documents a 200 response when the metrics in a request are partially invalid, and the same pattern for partial throttling of new-series creation. A collector that only checks HTTP status will report success while dropping data. The pipeline is not healthy because the exporter is not logging errors. Whatever your collector exposes about accepted versus rejected points is the signal that matters.
The AWS best-practice guidance for the endpoint is short and points the same direction: follow OTel naming conventions, keep label cardinality reasonable and avoid request IDs or UUIDs as label values, use an export interval around 60 seconds, and put static metadata such as service name, version, and environment in resource attributes rather than on per-data-point labels.
6.3 Retention, stated exactly
Here the documentation is worth quoting rather than summarizing, because the two rows differ and inferring the reason would be guessing.The metrics concepts page presents retention for traditional CloudWatch metrics as "Up to 15 months with automatic rollup" and for OpenTelemetry metrics as "Up to 15 months". The OpenTelemetry metrics overview page says the model "includes 15 months of storage with no per-metric charges."
For Classic metrics, the rollup behavior is documented in detail elsewhere and is long-standing: one-minute data points for 15 days, five-minute for 63 days, one-hour for 455 days, with shorter periods aggregated into longer ones over time.
The OTel rows do not carry the rollup qualifier, and this article does not assert that they behave identically. If your design depends on the resolution available at a given age on the OTel path, confirm it against the documentation at the time you build, or measure it in your own account. That is a genuine open question, not a settled fact, and the honest thing is to label it as one.
For comparison, Amazon Managed Service for Prometheus takes a different approach entirely: metrics are stored for 150 days by default and automatically deleted, with the retention period configurable up to 1095 days. That difference is one of the inputs to section 8.
7. Shaping Data at Ingestion
Between "the application emits it" and "the backend stores it" there is now a server-side place to change the data. Knowing what it can and cannot do is what makes the placement decisions in section 8 tractable.7.1 The mechanism and its name
The feature is CloudWatch pipelines, and the piece relevant here is a source type named CloudWatch Metrics (OTel). It processes OpenTelemetry metrics on the OTLP ingestion path, based on selection criteria, and transforms them before they are persisted.The scoping restriction is absolute and worth stating first: the source only supports metrics ingested through the OTLP endpoint. Metrics sent through other paths, including
PutMetricData, are not processed. If your metrics still arrive by the Classic API, this mechanism is not available to them, and that is by itself an argument in the placement discussion.Both custom OTel metrics and AWS vended OTel metrics can enter a pipeline, though section 7.4 explains why the second can only be added to, not altered.
7.2 Selection criteria, and the ways they surprise you
Criteria determine which metrics enter a pipeline. Each is an expression of the form<path> == "<value>", grouped in a match_all block with AND semantics — a metric must match every expression to enter.Supported paths cover the whole OTLP envelope:
resource.attributes["key"], instrumentation_scope.name, instrumentation_scope.version, instrumentation_scope.attributes["key"], metric.name, datapoint.attributes["key"], and attributes["key"] as a short form for the data point level.pipeline:
source:
cloudwatch_metrics:
format: otlp
selection_criteria:
- match_all:
- 'resource.attributes["service.name"] == "my-service"'
- 'metric.name == "http.server.request.duration"'
processor:
- add_attributes:
attributes:
- key: resource.attributes["team"]
value: "platform-engineering"
sink:
- cloudwatch_metrics: {}The restrictions published alongside it are the part to read carefully, because several of them constrain how you organize pipelines across an organization.
- Exactly one
match_allgroup per pipeline. You cannot express alternatives within one pipeline. - At least one and at most 20 expressions in that group.
- Exact string matching only. Wildcards, regular expressions, and partial matches are not supported, and every expression must use
==. - No overlapping criteria across pipelines. Each data point must match at most one pipeline. If a data point would match both an existing pipeline and a new one, pipeline creation fails.
That last one is the organizational trap. The documented example is a pipeline selecting all metrics from
payment-service and a second selecting a specific metric name; because a data point can satisfy both, the second pipeline cannot be created. The guidance is to include at least one attribute path with distinct values in each pipeline's criteria — which in practice means an organization needs a partitioning convention agreed in advance, not a first-come pattern where each team writes whatever selector fits their case.7.3 The five processors
A pipeline can have at most 20 processors, applied sequentially in the order defined. Five are available for metrics, each documented with its OTTL equivalent.| Processor | Effect | OTTL equivalent |
|---|---|---|
add_attributes | Adds or overwrites attributes on data points | set(attributes["key"], "value") |
delete_attributes | Removes specific attributes | delete_key(attributes, "key") |
rename_attributes | Renames attribute keys | set() plus delete_key() |
rename_metrics | Renames metric names | set(name, "new.metric.name") where name == "old.metric.name" |
substitute_attribute_values | Maps attribute values through a lookup table | replace_match() |
add_attributes is additive by default; setting overwrite_if_key_exists: true on an entry makes it replace an existing value, and that turns it into a destructive operation for the purposes of the next subsection.7.4 What the pipeline refuses to do
This is the constraint most likely to produce a silent no-op, and it has two parts.Destructive processors do not apply to cumulative metrics or vended metrics. The set of destructive processors is
delete_attributes, rename_attributes, rename_metrics, substitute_attribute_values, and add_attributes with overwrite_if_key_exists: true. When such a processor meets a cumulative metric or a vended metric, the documentation states that those metrics are passed through unchanged.Vended metrics have an additional named protection. Destructive processors cannot modify metrics where
instrumentation_scope.name starts with cloudwatch.aws/, and again those metrics pass through unchanged.Neither is an error. Your pipeline is configured, active, and doing nothing to that subset of your data. If you plan to strip a high-cardinality label from a cumulative counter at ingestion, the plan does not work and does not tell you so — the removal has to happen in the SDK or the Collector instead.
7.5 The bridge between the two notations
A pipeline is written in OTTL paths and verified in PromQL labels, which means one configuration involves two different spellings of the same thing. The User Guide publishes the correspondence, and it is the single most useful table for anyone operating this.| Pipeline OTTL path | PromQL label prefix | Example |
|---|---|---|
resource.attributes["key"] | @resource. | @resource.service.name |
instrumentation_scope.name | @instrumentation.@name | @instrumentation.@name |
instrumentation_scope.attributes["key"] | @instrumentation. | @instrumentation.library |
datapoint.attributes["key"] or attributes["key"] | @datapoint. or bare | status_code |
Note the second row:
instrumentation_scope.name is a field, so it picks up the double @ on the query side. It is the same rule as section 4.1, seen from the other direction, and it is where a config author who has not internalized the field-versus-attribute distinction will write the verification query wrong.The documented verification loop is simple. Add the attribute in the pipeline, then confirm it arrived:
{"CPUUtilization", "@resource.team"="platform-engineering"}7.6 Choosing where to shape
Three places can change telemetry, and they differ in what they can do and in what it costs to change your mind.| Where | Can do | Cannot do | Cost of changing |
|---|---|---|---|
| Application SDK | Anything, including not emitting at all | Nothing centrally; every service must be changed | A deployment per service |
| Collector | Full OTTL, all metric types, drop and transform freely | Nothing for producers that do not go through your collector | A collector config rollout |
| CloudWatch pipelines | Add, delete, rename, substitute, on OTLP-path metrics | Destructive edits to cumulative or vended metrics; anything on the Classic path | A pipeline update, no fleet change |
The reasonable default follows from that table rather than from preference. Reduce cardinality as early as you can and enrich as late as you can. A label that should never exist is cheapest to prevent in the SDK, and it is the only place a cumulative counter's labels can be removed at all. Business context such as team, cost center, and environment is better added centrally, because it changes for organizational reasons rather than code reasons, and because it can then be applied to producers whose instrumentation you do not control. That is exactly the use case AWS names for the feature.
8. Where Each Metric Should Live
This is the practical crux. Everything above is input to one question: for a given metric, which store, and does anything have to move.8.1 The decision table
| What you have | Where it should live | Why, and what it costs |
|---|---|---|
| AWS vended metrics from AWS services | Stay where they are; enable enrichment to make them PromQL-queryable | Enrichment is a projection, not a migration. Nothing is rewritten and existing consumers keep working |
| New application metrics | OTel path | The recommended path per AWS, and the only one with the label headroom |
Existing application metrics on PutMetricData or Embedded Metric Format | Migrate deliberately, workload by workload | AWS documents an incremental path with no flag day. The work is in the consumers, not the producers |
| Metrics whose value is a distribution | OTel histogram or exponential histogram, or Managed Service for Prometheus native histograms | See section 9 |
| High-cardinality labels that Classic cannot hold | OTel path | 150 labels per data point against 30 dimensions per metric |
| Metrics you need at resolution beyond a 7-day query range | Keep a Classic or exported copy | The PromQL maximum range per request is 7 days |
| Metrics scraped from Prometheus-compatible endpoints | Managed collectors into CloudWatch, or an existing AMP workspace | Managed collectors deliver in OpenTelemetry format and are queryable with PromQL |
| Metrics that must be retained past 15 months | An AMP workspace with retention raised, or an exported copy past three years | CloudWatch stores up to 15 months either way. AMP defaults to 150 days and is configurable up to 1095 days, so it covers 15 months to 3 years; only a requirement beyond 1095 days needs an export |
8.2 Enrichment is not migration, and this is the point
The most common misreading of this whole capability is that AWS vended metrics need to be moved. They do not, and the documentation is explicit: the enriched metric preserves the original metric name and CloudWatch dimensions, adds resource attributes, an instrumentation scope, and resource tags, and "the original classic CloudWatch metric is not modified and remains available through existing CloudWatch APIs."So enabling enrichment is additive. Your existing metric alarms keep evaluating. Your existing dashboards keep rendering. Your
GetMetricData automation keeps working. What you gain is a second way to reach the same underlying data, one that can join it against your application metrics in a single query language.Enabling it is an account-and-Region-level change and does require permission for
cloudwatch:StartOTelEnrichment, with aws cloudwatch start-otel-enrichment as the CLI form and aws cloudwatch get-o-tel-enrichment to read the current status. In CloudFormation, AWS::CloudWatch::OTelEnrichment requires AWS::ObservabilityAdmin::TelemetryEnrichment to be configured first, and the Terraform resources have the same ordering dependency. There is no cross-Region form; the resource is created per Region.This changes account-level state and should be treated as a change, not an experiment. Nothing in this article was enabled to write it.
8.3 How to actually unwind dual management
The instinct when two systems overlap is to pick a winner and migrate everything. That is the expensive path and usually the wrong one, because most of the cost of dual management is not in the storage — it is in the duplicated human surface: two dashboard sets, two alarm definitions, two onboarding checklists, two query languages that engineers must switch between during an incident.That reframing suggests a different order of operations, because the human surface can be unified well before the storage is.
- Unify the query surface first. Enable enrichment so AWS vended metrics are reachable in PromQL. At this point one query language can reach both AWS metrics and any application metrics already on the OTel path, and Query Studio hosts both languages side by side. No producer has changed.
- Unify the dashboard surface next. Rebuild the dashboards that span both systems so they draw from one place. This is where most of the daily friction lives, and it is reversible at every step because nothing has been turned off.
- Then migrate producers, by workload. Take one service at a time through the dual-write sequence in section 11. A service that has not been touched is still working exactly as before.
- Retire the duplicated definitions last. Only after the OTel-side alarm has been observed firing correctly does the Classic one come out.
The important property is that each step is independently valuable and independently reversible. A migration that stalls after step two has still removed most of the pain, and a migration that has to be abandoned entirely leaves nothing broken.
8.4 When to keep a separate Prometheus-compatible store
Consolidation is not automatically right. Reasons to keep Amazon Managed Service for Prometheus in the picture include a retention requirement beyond what CloudWatch stores, since AMP is configurable up to 1095 days; an existing investment in Prometheus alerting rules and Alertmanager, which is a different alerting model from CloudWatch alarms; a query pattern that exceeds the CloudWatch 7-day maximum range or the per-24-hour scan budgets; and a multi-cloud estate where the store has to sit outside AWS. Native histogram support, covered next, is an AMP capability specifically.The migration reference points here are AWS Observability Architecture Guide for how the collection tier is assembled, and AWS Observability Glossary when a term in either ecosystem needs pinning down.
9. Histograms and Aggregation
Distributions are where the two models differ most, and where the choice of store has the largest structural consequence.9.1 What CloudWatch accepts
The OTel path supports gauge, sum, histogram, and exponential histogram, against the Classic model's single values and statistic sets. Exponential histograms matter because they carry a distribution whose bucket layout is derived from a formula rather than from boundaries somebody guessed in advance.On the query side, the mapping is standard PromQL: counters through
rate() or increase(), gauges directly, histograms through histogram_quantile().9.2 Temporality, and its interaction with pipelines
OpenTelemetry lets a metric be exported with delta or cumulative temporality, and the choice is usually made in the SDK or by a Collector processor.It has a consequence here that is easy to miss: destructive pipeline processors do not apply to cumulative metrics. If your exporter emits cumulative sums and histograms — the Prometheus-compatible default in many setups — then dropping or renaming their attributes at ingestion is not available to you, and the shaping has to move upstream into the SDK or the Collector.
That is worth deciding before you build a shaping strategy around server-side pipelines, not after.
9.3 Native histograms in Managed Service for Prometheus
Amazon Managed Service for Prometheus added ingestion, storage, and querying of Prometheus native histograms, announced in June 2026 and available in all Regions where the service is offered.The structural change is in the series count. A classic Prometheus histogram emits one cumulative time series per bucket boundary plus
_sum and _count, so a 20-bucket latency histogram is 22 active time series before any labels are applied. A native histogram stores the whole distribution in a single time series using exponential bucketing, with _sum and _count embedded in the sample rather than kept as separate series.The second change is resolution. Because the bucket layout comes from a schema — an integer controlling how many buckets cover each doubling of the value range — rather than from hand-picked boundaries,
histogram_quantile() interpolates over narrower ranges in the tail, where fixed boundaries are usually widest and least accurate.Three operational facts are worth carrying into a design.
- Enablement is in the instrumentation, not the workspace. AWS states plainly that "no workspace configuration change is required to ingest native histograms." In the Go client, a native histogram is enabled by setting
NativeHistogramBucketFactorwhen the histogram is created, withNativeHistogramMaxBucketNumberavailable to cap the bucket count. The scrape configuration needsscrape_native_histograms: trueand the remote-write configuration needssend_native_histograms: true. - Adoption is incremental. Native histograms run alongside classic histograms, so workloads migrate one at a time without disrupting current dashboards or alerts.
- Bucket counts are not comparable across the two forms. AWS gives the worked example: a classic histogram with 11 buckets, converted with the default
NativeHistogramBucketFactor: 1.1— which corresponds to schema 3, eight buckets per doubling — yields roughly 80 bucket positions across a typical latency range of about ten doublings, not 11. Only populated buckets are stored. If that is more resolution than you need, cap it withNativeHistogramMaxBucketNumberor raise the bucket factor for a coarser schema.
The prerequisites AWS lists for following its own walkthrough are a client library supporting native histograms such as
prometheus/client_golang v1.19.0 or later, a Prometheus server or compatible agent at 2.40.0 or later, and Amazon Managed Grafana 10.4 or later for visualization.9.4 Aggregation design, briefly
Two rules cover most cases. Aggregate over labels you did not intend to distinguish, not over labels you did —sum by (...) with an explicit list is safer than sum without (...) when the label set can grow, because a new label added by an instrumentation upgrade silently changes the meaning of the second form. And decide percentile aggregation at instrumentation time, since averaging percentiles across series is not meaningful, and only a histogram lets you compute a correct percentile over a set of series after the fact.10. The X-Ray SDK Transition
This section requires more care than any other, because the fact most likely to be misquoted is the one that matters most.10.1 What entered maintenance mode, stated exactly
The AWS X-Ray SDKs and the X-Ray daemon entered maintenance mode. The AWS X-Ray service did not.The X-Ray Developer Guide publishes the support timeline as a two-row table.
| SDK and daemon phase | Start date | End date | Support provided |
|---|---|---|---|
| General availability | Not applicable | February 25th, 2026 | X-Ray SDKs and Daemon are fully supported. AWS provides regular SDK and daemon releases that include bug and security fixes |
| Maintenance mode | February 25th, 2026 | Not applicable | AWS will limit X-Ray SDK and Daemon releases to address security issues only. The SDKs/Daemon will not receive new feature enhancements |
Three statements from AWS establish the boundary of what that means, and each is worth having verbatim.
On continued acceptance of data: "Even in maintenance mode, X-Ray will continue to accept and process traces from existing X-Ray SDKs and Daemon."
On the service: "The AWS X-Ray service remains fully supported and continues to be enhanced with new features like native OpenTelemetry support and Amazon CloudWatch Transaction Search."
On existing applications, from the AWS Distro for OpenTelemetry FAQ: "No, you can continue using the AWS X-Ray SDK and daemon/agent for applications already instrumented."
So the accurate summary is: AWS's own sources do not agree on an end-of-support date for the SDKs and daemon: the support timeline gives the end of maintenance as "N/A", while the Developer Guide's document history carries a notice dated August 22, 2025 reading "On February 25th, 2027, AWS X-Ray will discontinue support for AWS X-Ray SDKs and Daemon." They continue to work, they continue to receive security fixes, and they stop receiving new features. New development goes to OpenTelemetry. Any summary shorter than that risks saying something AWS has not said.
There is one concrete consequence for planning that follows directly from "no new feature enhancements": the blog post spells it out — "the SDKs will not receive additional Library Instrumentations or enhancements to existing Library Instrumentations." If you adopt a framework or library that the X-Ray SDK does not already instrument, no instrumentation for it is coming. That is the thing most likely to force a given team's hand.
10.2 The concept mapping
The Developer Guide publishes a translation table, and reading it before touching configuration saves a lot of confusion, because several X-Ray concepts split or merge on the way across.| X-Ray concept | OpenTelemetry concept |
|---|---|
| X-Ray Recorder | Tracer Provider and Tracers |
| Service Plugins | Resource Detector |
| Segment | Server Span |
| Sub-segment | Non-Server Span |
| X-Ray Sampling Rules | OpenTelemetry Sampling, customizable |
| X-Ray Emitter | Span Exporter, customizable |
| Annotations and Metadata | Attributes |
| X-Ray Trace Context | Span Context |
| X-Ray Trace Context Propagation | W3C Trace Context Propagation |
| X-Ray Daemon | OpenTelemetry Collector |
| Not applicable | Span Processing |
| Not applicable | Baggage |
Spans are converted to X-Ray segments and subsegments automatically, which is what keeps the existing console experience unchanged after a migration.
10.3 The row that breaks searches, and how to fix it
The Annotations and Metadata row collapses two X-Ray concepts into one OpenTelemetry concept, and the collapse has a real consequence.In X-Ray, annotations are indexed for filtering and searching, and metadata is not. In OpenTelemetry there is only "attributes." The Developer Guide states the default behavior: "By default, OpenTelemetry span attributes are converted to metadata in X-Ray raw data. To convert specific attributes to annotations instead, add their keys to the
aws.xray.annotations attributes list."So a team that migrates instrumentation faithfully and changes nothing else will find that filter expressions which used to work now return nothing, because the fields they filter on became unindexed metadata. The fix is a single list, but you have to know to set it. Inventory the annotations your existing filter expressions and saved queries depend on, and carry that list into
aws.xray.annotations as part of the migration rather than after the first incident.10.4 Replacing the daemon
Two supported replacements exist, and one of them is the mechanism for running both worlds at once.The X-Ray daemon listens on UDP port 2000 and relays segment data to the X-Ray API. The Developer Guide recommends the CloudWatch agent or the OpenTelemetry Collector in its place, and notes that "CloudWatch agent version 1.300025.0 and later can collect OpenTelemetry traces. Using the CloudWatch agent instead of the X-Ray Daemon reduces the number of agents you need to manage."
The reason the CloudWatch agent is the pragmatic choice during a transition is that its
traces_collected block can hold both receivers simultaneously:"traces_collected": {
"xray": {
"bind_address": "127.0.0.1:2000",
"tcp_proxy": {
"bind_address": "127.0.0.1:2000"
}
},
"otlp": {
"grpc_endpoint": "127.0.0.1:4317",
"http_endpoint": "127.0.0.1:4318"
}
}Those are the documented defaults. With both present, a host runs one agent that accepts X-Ray SDK traffic on the port the old daemon used and OTLP traffic on the standard ports, which means services on that host can migrate individually without a fleet-wide coordination point. The agent's IAM role needs the
AWSXrayWriteOnlyAccess policy to send trace data to X-Ray.Migration guidance for Amazon EC2 and on-premises servers, Amazon ECS, and Elastic Beanstalk is published per environment, with example task definitions and collector configurations.
AWS History and Timeline regarding AWS Elastic Beanstalk carries the date on which Beanstalk Cluster Mode arrived with managed OpenTelemetry integration.
10.5 The traces endpoint, and its one prerequisite
Traces have their own OTLP endpoint, and it differs from the metrics endpoint in two ways that will stop you if you assume symmetry.The endpoint follows the pattern
https://xray.<AWS Region>.amazonaws.com/v1/traces. It authenticates callers using Signature Version 4 only — the metrics and logs endpoints document bearer token authentication as an alternative, and the traces endpoint documentation does not.Transaction Search must be enabled before you use the OTLP endpoint for traces. The troubleshooting page lists the exact symptom: a collector throwing "The OTLP API is supported with CloudWatch Logs as a Trace Segment Destination," with the resolution being to enable Transaction Search first. That is the single most likely first-attempt failure on this path.
The traces endpoint limits, confirmed 2026-08-09, differ substantially from the metrics ones:
| Limit | Value |
|---|---|
| Maximum uncompressed bytes per request | 5 MB |
| Maximum events per request | 10,000 spans |
| Single resource and scope size | 16 KB |
| Single span maximum size | 200 KB |
| Span created timestamps | 2 hours future, 14 days past |
| Maximum time gap in events per request | 24 hours |
The 16 KB resource-and-scope limit is the sharp edge: exceeding it "will cause rejection of the entire API call," not just the offending resource. A resource block that has accumulated a large set of attributes can therefore take down a whole batch.
10.6 Choosing a collection path
Four ways exist to get telemetry to the CloudWatch OTLP endpoints, and they are not equivalent. The CloudWatch User Guide publishes the feature matrix; the rows that actually differentiate them are these.| Capability | CloudWatch agent | Upstream OTel Collector | Custom OTel Collector | Collectorless ADOT SDK |
|---|---|---|---|---|
| Search and analyze spans and trace summaries | Yes | Yes | Yes | Yes |
| Search and analyze logs summaries | Yes | Yes | Yes | No |
| CloudWatch entity correlation | Yes | No | Yes | No |
| Runtime metrics correlated with your application | Yes | No | Yes | No |
| CloudWatch Enhanced Container Insights | Yes | No | No | No |
| CloudWatch Application Signals | Yes | No | Yes | Yes |
| Telemetry supported | Logs, metrics, traces | Logs, metrics, traces | Logs, metrics, traces | Metrics, traces |
AWS describes the CloudWatch agent as an AWS-managed OpenTelemetry Collector with CloudWatch components pre-built, and recommends it for most customers.
The row worth pausing on is entity correlation — the resource linkage that makes a metric or trace resolve to a specific AWS resource in the console and the service map. It is available with the CloudWatch agent and a custom Collector, and not with the upstream Collector as shipped. If your reason for choosing upstream is portability, that is a legitimate trade, but it is a trade and not a free choice.
The migration and configuration mechanics of the collection tier itself belong to AWS Observability Architecture Guide.
11. Migration Playbook
The published migration approach is four phases, and AWS is explicit that "there is no flag day — migration happens workload by workload at your own pace."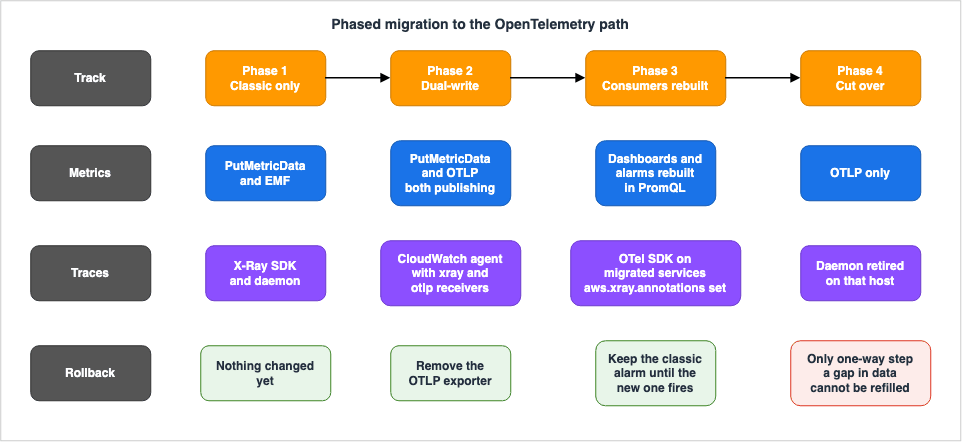
11.1 The four phases
- Dual-write. Add the OTel SDK alongside your existing
PutMetricDatacalls. AWS states directly that both paths can publish simultaneously and you do not lose data. - Validate. Confirm the OTel metrics appear, through PromQL, with the labels you expect.
- Recreate consumers. Update alarms and dashboards to use PromQL and OTel metric names.
- Cut over. Stop Classic publishing after the OTel consumers are validated.
The metric name mapping AWS suggests for step one is a change of convention as well as of transport:
RequestLatency in milliseconds becomes http_request_duration_seconds converted to seconds, RequestCount becomes http_requests_total with the _total suffix conventional for counters, ErrorCount becomes http_server_errors_total, and a gauge such as QueueDepth becomes queue_depth with no suffix. Renaming and re-basing units at the same time as changing transport is a deliberate choice, and it means step two is a real validation step, not a formality — the numbers should differ by exactly a factor you can predict, and if they do not, something else changed.For step three, alarms are the consumer with the most behavioral surface. Recreate them as PromQL alarms and run both in parallel until you are confident the new one fires correctly; AWS recommends exactly that. The semantics of a PromQL alarm differ from a metric alarm in ways that affect how you read its state, and those differences are covered in Amazon CloudWatch Alarm Design Guide rather than repeated here.
11.2 Sequencing the two tracks
Metrics and traces are independent migrations that happen to be discussed together, and treating them as one project is a common way to make both slower. A workable ordering that keeps each step reversible:- Enable OTel enrichment for vended metrics. Additive; the classic metrics are untouched.
- Point new application metrics at the OTLP endpoint. No existing metric changes.
- Dual-write one existing service. Both paths run.
- Recreate that service's dashboards and alarms in PromQL, running both.
- Stop Classic publishing for that service. The first genuinely subtractive step, and it is scoped to one service.
- Separately, on the trace side, deploy the CloudWatch agent with both
xrayandotlpreceivers. Nothing has migrated yet; the host is now capable of both. - Migrate one service's instrumentation to OpenTelemetry, carrying its annotation list into
aws.xray.annotations. - Retire the X-Ray daemon on that host once no service still sends to it.
11.3 What is reversible and what is not
| Step | Reversible | Note |
|---|---|---|
| Enabling OTel enrichment | Yes, and it is additive | Original classic metrics are unmodified throughout |
| Adding OTel publishing alongside Classic | Yes | Remove the exporter |
| Creating a telemetry pipeline | Yes | But overlapping selection criteria block creation of a second pipeline, so plan the partitioning first |
| Recreating alarms in PromQL | Yes | Keep the Classic alarm until the new one has been observed firing |
| Stopping Classic publishing | Yes for future data, no for the gap | Data not written during the gap does not exist later |
| Migrating instrumentation to OpenTelemetry | Yes, with a redeploy | The X-Ray SDKs continue to work and continue to receive security fixes |
| Retiring the X-Ray daemon on a host | Yes | Only after no service on that host still emits to UDP 2000 |
The only genuinely one-way item on that list is the gap created by stopping a publisher. That is the argument for making the parallel period longer than feels necessary: everything else can be undone, so the cost of waiting is small and the cost of a gap is permanent.
11.4 Cross-account, if you have it
Cross-account centralization of OTLP metrics arrived with general availability; the AWS Cloud Operations Blog post describes it as aggregating OTLP metrics from multiple AWS accounts into a single monitoring account. The CloudWatch user guide, checked on 2026-09-28, documents this as metrics centralization: centralization rules, which require AWS Organizations, copy metrics (OpenTelemetry metrics included) from source accounts and Regions into a destination account, which then owns the copy. That is a separate feature from CloudWatch cross-account observability, whose sinks and links let a monitoring account view source-account telemetry within a Region without copying it (traces are the exception). Query Studio adds per-query cross-account and cross-Region selectors. How Amazon CloudWatch Omni relies on these centralization rules is covered in Amazon CloudWatch Omni and CloudWatch, and for centralized logging patterns that sit next to this, see AWS Centralized Logging and Audit Architecture Guide.12. Failure Modes
Each of these has been named in passing above. Collected here, with what makes each one hard to see.12.1 A wrong prefix returns an empty result, not an error
Symptom: a query that should return data returns nothing, and nothing in the response indicates a mistake.Cause:
@resource.service.name written as @resource.@service.name, or an attribute queried at the wrong scope, or an unquoted label name that contains a dot. All are structurally valid; they simply match no series.Why it is hard to see: an empty result is also what a genuinely absent metric looks like. Teams often conclude the pipeline is broken and go debug the collector. The reverse mistake happens too — a series that really did stop, because the underlying resource was retired or replaced during scheduled maintenance, gets diagnosed as a query error. Receiving and acting on AWS Health events is what distinguishes the two, and that is the subject of a companion article in this series, Surviving Forced Maintenance on AWS.
Prevention: discover label names through
/api/v1/labels rather than transcribing them, and always run the bare selector before wrapping it in an aggregation.12.2 Partial rejection returns HTTP 200
Symptom: the exporter reports success; some data points never appear.Cause: the metadata-size and label-count limits, and the new-series creation rate, all document a 200 response for partially invalid or partially throttled requests.
Why it is hard to see: HTTP-status-based monitoring cannot detect it by construction.
Prevention: monitor the collector's own accepted-versus-refused counters rather than the transport status, and treat a rising refusal rate as an incident signal.
12.3 Cardinality explosion
Symptom: ingestion starts failing, or query budgets are exhausted, shortly after a deployment.Cause: a label carrying an unbounded value — a request ID, a UUID, a raw URL path with identifiers in it. AWS names this directly in its best practices.
Why it is hard to see: it is fine in a test environment where the value space is small.
Prevention: prohibit unbounded values as labels at review time; keep static metadata in resource attributes; and remember that the interacting ceilings are 150 labels, 40 KB of metadata per data point, and 1,000,000 new series per 10-minute window.
12.4 A destructive processor that silently does nothing
Symptom: a pipeline is configured to strip a high-cardinality label, the pipeline is active, and the label is still there.Cause: destructive processors do not apply to cumulative metrics or vended metrics, and cannot modify metrics whose
instrumentation_scope.name starts with cloudwatch.aws/. Those metrics pass through unchanged.Why it is hard to see: there is no error. The pipeline is healthy and doing exactly what it is documented to do.
Prevention: check temporality before designing server-side shaping, and move the removal into the SDK or Collector for cumulative metrics.
12.5 Overlapping pipeline criteria
Symptom: creating a new pipeline fails, and the pipeline that already exists belongs to a different team.Cause: each data point must match at most one pipeline; overlapping criteria cause creation to fail.
Why it is hard to see: it only appears once a second team tries to do the same thing, by which point the first pipeline is in production.
Prevention: agree an organization-wide partitioning attribute before the first pipeline is created, so every pipeline's criteria include a value that is distinct by construction.
12.6 Duplicate ingestion during the parallel period
Symptom: a metric reads roughly double, or an alarm fires twice.Cause: dual-write is intentional, but a consumer that aggregates across both paths counts the same event twice.
Why it is hard to see: the producers are correct; only the consumer is wrong, and only for the duration of the migration.
Prevention: keep the parallel period's consumers separate — a Classic alarm reads Classic, a PromQL alarm reads OTel — and do not build anything during the migration that sums across both.
12.7 Ad hoc attribute names
Symptom: two services emit the same concept under different attribute names, and no query spans both.Cause: inventing attribute names instead of adopting semantic conventions.
Why it is hard to see: each service is internally consistent, so it looks correct until someone tries to write a cross-service query.
Prevention: adopt the published semantic conventions, pin the version you conform to, and note that conventions in Development status can change — which is a reason to record the version, not a reason to avoid them.
12.8 Truncated query results read as complete
Symptom: a dashboard shows a plausible subset of a fleet and nobody notices the rest is missing.Cause: a query returning more than 500 unique series is truncated and returned with HTTP 200.
Why it is hard to see: nothing about the response says it was truncated in a way a chart can render.
Prevention: aggregate in the query rather than in the visualization, so the number of returned series is bounded by design; and where a fleet-wide selector is genuinely needed, verify the series count against a
count() query.13. Frequently Asked Questions
Is AWS X-Ray being discontinued?
No. The X-Ray SDKs and the X-Ray daemon entered maintenance mode on February 25th, 2026, meaning releases are limited to security issues and no new features are added. AWS states that "the AWS X-Ray service remains fully supported and continues to be enhanced with new features like native OpenTelemetry support and Amazon CloudWatch Transaction Search," and that X-Ray continues to accept and process traces from existing SDKs and the daemon even in maintenance mode.Do I have to migrate off the X-Ray SDK by a particular date?
AWS's own sources do not agree on an end-of-support date for the SDKs and daemon: the support timeline gives the end of maintenance as "N/A", while the Developer Guide's document history carries a notice dated August 22, 2025 reading "On February 25th, 2027, AWS X-Ray will discontinue support for AWS X-Ray SDKs and Daemon." The AWS Distro for OpenTelemetry FAQ says you can continue using the X-Ray SDK and daemon for applications already instrumented. The practical pressure is that the SDKs will not receive additional library instrumentations, so a framework the SDK does not already cover will not be covered later.Do I have to migrate my AWS vended metrics to OTLP?
No. Enabling OTel enrichment makes them queryable in PromQL, and the original classic metric is not modified and remains available through existing CloudWatch APIs. It is a projection, not a migration.Why does my PromQL query return nothing when the metric is definitely being emitted?
The most likely cause is a label name that is structurally valid but matches nothing — a single@ where a double @ is needed for a structural field, an attribute queried at the wrong scope, or an unquoted name containing a dot. Confirm the actual label names with /api/v1/labels, then run the bare selector before adding matchers.When do I need to quote things in a CloudWatch PromQL query?
Any metric or label name that is not legacy-compatible must be quoted and placed inside the braces. Since every CloudWatch OTLP scope prefix begins with@, scoped label names are always quoted. Legacy-compatible names, such as a vended metric name and its original dimensions, can be written bare.Can CloudWatch pipelines strip a high-cardinality label from any metric?
No. Destructive processors do not apply to cumulative metrics or vended metrics, and cannot modify metrics whoseinstrumentation_scope.name starts with cloudwatch.aws/. Those pass through unchanged, with no error. For cumulative metrics, remove the label in the SDK or the Collector.Does the CloudWatch OTLP endpoint accept gRPC?
No. The published endpoint limits state that the endpoint supports only HTTP and does not support gRPC, accepts OTLP 1.x, takes binary or JSON payloads, and supports gzip or no compression.Why is my collector getting an error about Trace Segment Destination?
Transaction Search is not enabled. The CloudWatch troubleshooting page lists this message for that cause, and enabling Transaction Search is a prerequisite for using the OTLP endpoint for traces.My filter expressions stopped working after migrating to OpenTelemetry tracing. Why?
By default, OpenTelemetry span attributes are converted to metadata in X-Ray raw data, and metadata is not indexed for search. Add the keys you filter on to theaws.xray.annotations attributes list so they become annotations.Is 150 labels per data point a per-level limit?
No. It is the count across Resource, Scope, and Datapoint attributes, per data point. Attributes on the resource block count against the same budget as attributes on the point.What is the single most useful habit from all of this?
Discover, do not transcribe. Before writing a query or a pipeline verification, call the label discovery endpoint and read the real label names out of your own account. It costs one signed request and eliminates the entire class of failures where a valid query quietly matches nothing.14. Summary
The backend changed, and the instrumentation mostly did not. CloudWatch now carries two metric models that AWS documents as both fully supported: OTLP ingestion queried with PromQL, and the Classic path queried with Metrics Insights. Because applications that already speak OTLP keep speaking OTLP, this is a Collector-configuration and consumer-rewrite problem, not an application rewrite.The technical crux is the flattening. OTLP has a resource layer, a scope layer, and per-point attributes; PromQL has one flat label space. CloudWatch resolves that by encoding the level into the label name —
@resource., @instrumentation., @datapoint., @aws. for attributes, and a doubled @ for structural fields such as @instrumentation.@name. Prometheus 3's UTF-8 support means the dots in service.name survive, at the cost of a quoting rule: non-legacy names go inside the braces, in quotes. Get a character wrong and the query is still valid and still returns nothing.The limits are what turn this from a syntax question into a design question. 150 labels per data point is a sum across all three levels, 40 KB of metadata per data point is usually the ceiling you hit first, partial rejection returns HTTP 200, and a query that spans more than 500 series is truncated and also returns 200. Two of the failure modes in this article exist purely because success and partial failure share a status code.
Server-side shaping exists through CloudWatch pipelines and is genuinely useful for adding organizational context to producers you do not control. It also has a hard boundary that is easy to plan around wrongly: destructive processors do not touch cumulative metrics or vended metrics, and say nothing when they decline.
Placement is the decision that pays. Enabling enrichment on AWS vended metrics is additive and leaves the classic metrics untouched, so the query surface can be unified long before any producer moves. That ordering — unify queries, then dashboards, then producers, then retire duplicates — makes every step independently valuable and independently reversible, and the only genuinely one-way action in the whole sequence is turning a publisher off.
On tracing, the fact to state precisely is that the X-Ray SDKs and daemon entered maintenance mode on February 25th, 2026, while the X-Ray service itself remains fully supported and is still gaining features. The transition is real, and AWS's own sources do not agree on an end-of-support date for the SDKs and daemon: the support timeline gives the end of maintenance as "N/A", while the Developer Guide's document history carries a notice dated August 22, 2025 reading "On February 25th, 2027, AWS X-Ray will discontinue support for AWS X-Ray SDKs and Daemon." What will force a given team's hand first is the absence of new library instrumentation. Two mechanics make the move manageable: the CloudWatch agent can hold X-Ray and OTLP receivers at the same time, so hosts migrate service by service, and
aws.xray.annotations is what keeps your existing filter expressions working once attributes stop defaulting to indexed fields.15. References
- Metrics in Amazon CloudWatch - Amazon CloudWatch User Guide
- Metrics concepts - Amazon CloudWatch User Guide
- CloudWatch OpenTelemetry Metrics - Amazon CloudWatch User Guide
- Send metrics using OpenTelemetry - Amazon CloudWatch User Guide
- Migrate from Classic to OTel metrics - Amazon CloudWatch User Guide
- Query metrics with PromQL - Amazon CloudWatch User Guide
- PromQL querying - Amazon CloudWatch User Guide
- Running PromQL queries in Query Studio - Amazon CloudWatch User Guide
- PromQL alarms - Amazon CloudWatch User Guide
- OTLP Endpoints - Amazon CloudWatch User Guide
- Getting started with OpenTelemetry in CloudWatch - Amazon CloudWatch User Guide
- Setting up bearer token authentication for Metrics - Amazon CloudWatch User Guide
- Troubleshooting the OTLP endpoint - Amazon CloudWatch User Guide
- AWS vended metrics in OpenTelemetry format - Amazon CloudWatch User Guide
- CloudWatch Metrics (OTel) selection criteria - Amazon CloudWatch User Guide
- Metrics pipeline processors - Amazon CloudWatch User Guide
- Supported data sources for CloudWatch - Amazon CloudWatch User Guide
- Manually create or edit the CloudWatch agent configuration file - Amazon CloudWatch User Guide
- Collect metrics and traces with OpenTelemetry - Amazon CloudWatch User Guide
- CloudWatch cross-account observability - Amazon CloudWatch User Guide
- X-Ray SDK and Daemon Support timeline - AWS X-Ray Developer Guide
- Migrating from X-Ray instrumentation to OpenTelemetry instrumentation - AWS X-Ray Developer Guide
- AWS X-Ray daemon - AWS X-Ray Developer Guide
- Ingest metrics to your Amazon Managed Service for Prometheus workspace - Amazon Managed Service for Prometheus User Guide
- Amazon Managed Service for Prometheus service quotas
- Query Amazon CloudWatch metrics using PromQL - Amazon Managed Grafana User Guide
- get-o-tel-enrichment - AWS CLI Command Reference
- Amazon CloudWatch introduces native OpenTelemetry metrics with PromQL querying
- Amazon CloudWatch Query Studio is now generally available
- Amazon CloudWatch now supports OpenTelemetry metrics in public preview
- Amazon CloudWatch introduces PromQL querying with Query Studio Preview
- Amazon CloudWatch pipelines now supports processing and enriching OpenTelemetry metrics
- Amazon Managed Service for Prometheus now supports Native Histograms
- Amazon CloudWatch announces managed Prometheus collectors
- Introducing OpenTelemetry and PromQL support in Amazon CloudWatch - AWS Cloud Operations Blog
- AWS X-Ray SDKs/Daemon migration to OpenTelemetry - AWS Cloud Operations Blog
- Introducing native histogram support in Amazon Managed Service for Prometheus - AWS Cloud Operations Blog
- AWS Distro for OpenTelemetry FAQs
- OTLP Specification 1.11.0 - OpenTelemetry
- Metrics Data Model - OpenTelemetry Specification
- Versioning and stability - OpenTelemetry Specification
- OpenTelemetry Semantic Conventions 1.44.0
- UTF-8 in Prometheus - Prometheus Documentation
- Querying basics - Prometheus Documentation
- AWS Observability Architecture Guide
- AWS Observability Glossary
- OpenTelemetry GenAI Semantic Conventions Guide
- LLMOps Observability and Evaluation Architecture on AWS
- Amazon CloudWatch Alarm Design Guide
- AWS Centralized Logging and Audit Architecture Guide
- AWS History and Timeline of Amazon CloudWatch
- Cell-Based Architecture and Shuffle Sharding on AWS
- Agent Reliability Engineering Design Guide
- AWS Multi-Region Active-Active Architecture Guide
- The Boundaries of the AWS Global Network
- CloudWatch Logs Insights Query Builder
- CloudWatch Metric Filter Tester
References:
Tech Blog with curated related content
Written by Hidekazu Konishi