Scaling Signals on AWS - Metric Resolution, Policy Type, and What Holds Scale-In Back
First Published:
Last Updated:
The core of this article explores the relationship between signal freshness and scale-in. The Amazon SageMaker AI Developer Guide notes that while high-resolution metrics, generated every 10 seconds, enable rapid scale-out, scale-in occurs at the same rate as with standard metrics. The Amazon ECS deep-dive blog says that with 20-second metrics, the time to scale down also became shorter in AWS's measurements. These two examples represent different services and different types of documentation. This article does not attempt to combine these into a single rule.
Instead of providing service-specific configuration steps, this article serves as a guide that organizes how decisions are made within each layer, based on the full list of predefined types available in Application Auto Scaling and the language used in each service's documentation. It differentiates between what the documentation states, what is not found in the documentation, and where discrepancies exist between different pieces of documentation. This article has not been tested in a real environment. It does not cover pricing, a list of Regions, or policy JSON.
Related articles on this site:
- Amazon ECS on Fargate Microservices Architecture Guide - Service Connect, Auto Scaling, Deployments, and Data-Tier Integration
- AWS Lambda Concurrency and Scaling Guide - Reserved and Provisioned Concurrency, Throttling, and Event Source Scaling
- Amazon DynamoDB Capacity and Global Tables Guide - Capacity Modes, Auto Scaling, Warm Throughput, and Multi-Region Design
- Amazon CloudWatch Alarm Design and Alert Fatigue - Composite Alarms, Anomaly Detection, Metric Math, and Metric Cardinality
- Load Testing on AWS - Which Policy Actually Applies, Why the Load Generator Runs Out First, and What a One-Minute Metric Hides
- How Elastic Load Balancing Scales - Scaling Rate, Capacity, and Load Balancer Capacity Unit Reservation
- How Amazon Aurora serverless Decides Its Capacity - What You Set, What Aurora Decides Within Your Range, What the Maximum ACU Fixes, and Where Each Shows Up
- Draining an Availability Zone for Days - What ARC Zonal Shift Moves and What Stays Pinned to the Zone
- Amazon ECS Deployment Lifecycle - Early Success Criteria, Deferred Cleanup, and Managed Daemon Rollouts
Table of Contents
- 1. Scope and Assumptions
- 2. How to Read the Tables
- 3. The Three Layers of a Signal
- 4. All Predefined Metric Types
- 5. Who Decides How Fresh the Signal Is
- 6. Which Policy Types Each Service Offers
- 7. What Holds Scale-In Back
- 8. What Can Scale to Zero
- 9. Choosing Which Layer to Look At
- 10. Where the Sources Disagree and What They Do Not Say
- 11. Failure Modes
- 12. Frequently Asked Questions About AWS Scaling Signals
- 13. Summary
- 14. References
1. Scope and Assumptions
This chapter first defines the intended audience, the scope of this article, the relevant documentation, and the terminology used. The following ten points outline the key conclusions.- The determination of auto scaling involves three layers: the layer that produces the signal, the layer that evaluates the signal, and the layer that adjusts capacity. The freshness of the signal is primarily determined by the producing and evaluating layers, while what holds scale-in back is primarily found in the evaluating and acting layers (Chapter 3).
- The Application Auto Scaling API reference lists 31 predefined metric types for target tracking. A table in the same service's user guide lists 30 types, but does not include the type for WorkSpaces pools (Chapter 4).
- ECS publishes CPU and memory metrics by default every 60 seconds, and this interval can be reduced to 20 seconds. Before selecting a 20-second type in a policy, ensure that the ECS service has enabled 20-second metric publishing (Section 5.2).
- SageMaker AI publishes the number of concurrent requests every 10 seconds. The developer guide states that scaling out becomes faster, but scaling in occurs at the same rate as the standard metrics (Sections 5.3 and 7.6).
- High-resolution scaling in EC2 Auto Scaling utilizes custom metrics, not predefined types, and periods of 10, 30, or 60 seconds. EC2 metrics are published by default every 5 minutes (Section 5.4).
- The available scaling policies vary depending on the service. The
PutScalingPolicyAPI reference indicates that target tracking is not available for Amazon EMR, that step scaling is not supported for DynamoDB, Lambda, ElastiCache, and others, and that predictive scaling is only available for ECS (Chapter 6). - Multiple target tracking policies will trigger scaling out if any single policy requests it. Scaling in only occurs when all policies with scale-in enabled are ready to scale in (Section 7.2).
- If a target tracking policy experiences missing data points, resulting in an alarm state of
INSUFFICIENT_DATA, both Application Auto Scaling and EC2 Auto Scaling are unable to increase or decrease capacity until new data points become available (Section 7.3). - During ECS deployments, Application Auto Scaling will stop scaling in and continue scaling out. This behavior does not apply to services that utilize external deployment controllers (Section 7.4).
- The SageMaker zero page states that, in SageMaker AI, real-time endpoints can scale in to zero instances only when an inference component is deployed. Calls to the endpoint while it has zero instances will result in errors until provisioning finishes (Section 8.2).
1.1 Intended Audience
This article is intended for the following audience:- Operations personnel managing resources such as ECS, EC2, and SageMaker AI, utilizing auto scaling.
- Individuals responsible for investigating why scaling out is slow, or why the number of instances does not decrease even when the load subsides.
- Designers who need to determine whether to switch to higher-resolution metrics.
This article assumes that readers are considering the following points, and each point is checked against the sources:
- Switching to higher-resolution metrics will also accelerate scaling in.
- When the load disappears, the number of instances will quickly decrease to the minimum.
- Every service has the same number of predefined types.
- If multiple scaling policies are defined, the policy that requests the largest capacity will always take precedence.
- When no data is received, it will be treated as a low utilization rate, triggering scaling in.
- Real-time endpoints in SageMaker AI cannot scale in to zero instances.
1.2 What This Article Covers and What It Does Not
This article covers the following topics: all predefined types, signal resolution and the layer where it is enabled, correspondence of policy types, what holds scale-in back, default cooldown settings, and the targets and conditions for scaling in to zero. It will focus heavily on ECS, EC2 Auto Scaling, and SageMaker AI, while addressing Lambda, DynamoDB, Aurora, ElastiCache, and EMR in table rows.This article does not cover the following:
- How to create ECS policies, the JSON for
ALBRequestCountPerTarget, or settings that disable the scale-in portion. This site's Amazon ECS on Fargate Microservices Architecture Guide covers this. - Lambda provisioned concurrency thresholds and preparation for burst traffic. This site's AWS Lambda Concurrency and Scaling Guide covers this.
- DynamoDB capacity modes and delays in table updates. This site's Amazon DynamoDB Capacity and Global Tables Guide covers this.
- Designing high-resolution alarms. This site's Amazon CloudWatch Alarm Design and Alert Fatigue covers this.
- Creating load tests and measuring what a one-minute metric can obscure. This site's Load Testing on AWS covers this.
- Scaling the load balancer itself. This site's How Elastic Load Balancing Scales covers this.
- The ACU capacity of Amazon Aurora Serverless. This site's How Amazon Aurora serverless Decides Its Capacity covers this. In this article, Aurora refers specifically to the automatic scaling of Aurora replica counts.
- Amazon EKS's Horizontal Pod Autoscaler and Karpenter. These are mechanisms outside of Application Auto Scaling.
- Pricing, cost reduction strategies, a list of Regions, or a comparison of products based on AWS measurements.
1.3 Date of Review and Materials Reviewed
This article was written after reviewing the following materials on November 10, 2026 (Japan Standard Time). This article uses the name at the start of each line.- target tracking page: The "How target tracking scaling for Application Auto Scaling works" page in the Application Auto Scaling User Guide.
- metrics page: The "Monitor usage of scalable resources using CloudWatch" page in the same guide.
- services page: The "AWS services that you can use with Application Auto Scaling" page in the same guide.
- Application Auto Scaling API reference: The pages for
PredefinedMetricSpecification,RegisterScalableTarget,PutScalingPolicy, andSuspendedState. - EC2 target tracking page: The "Target tracking scaling policies" page in the Amazon EC2 Auto Scaling User Guide.
- EC2 high-resolution page: The "Create a target tracking policy using high-resolution metrics for faster response" page in the same guide.
- EC2 Auto Scaling API reference: The pages for
TargetTrackingMetricStatandPredefinedMetricSpecification. - EC2 cooldowns page, EC2 protection page, EC2 predictive page, EC2 warm pools page, EC2 zonal shift page: The pages on cooldowns, protection from scaling in, predictive scaling, warm pools, and zonal shift in the same guide.
- ECS auto scaling page: The "Automatically scale your Amazon ECS service" page in the Amazon ECS Developer Guide.
- ECS high-resolution page: The "Faster auto scaling with high-resolution metrics" page in the same guide.
- ECS task protection page, ECS predictive page: The pages on task protection from scaling in and predictive scaling in the same guide.
- SageMaker metrics page: The "Define a scaling policy" page in the Amazon SageMaker AI Developer Guide.
- SageMaker zero page, SageMaker policy page, SageMaker async page: The pages on scaling to zero, policy overview, and automated scaling for asynchronous inference in the same guide.
- Lambda PC page: The "Configuring provisioned concurrency for an Event Function" page in the AWS Lambda Developer Guide.
- DynamoDB metrics page, ElastiCache target tracking page, ElastiCache policies page, EMR scaling page, Aurora auto scaling page: The auto scaling pages of each service.
- CloudWatch concepts page: The "Metrics concepts" page in the Amazon CloudWatch User Guide.
- What's New: Announcements on June 18, 2026, regarding high-resolution metrics for ECS, and on November 19, 2025, regarding the configurable scale-in delay for ECS Managed Instances.
- ECS deep-dive blog: A blog post from the AWS Containers Blog on November 3, 2026, titled "Deep dive: Auto scaling response times on Amazon ECS."
- SageMaker blogs: A blog post from July 25, 2024, on high-resolution metrics, and a blog post from December 2, 2024, on scaling to zero.
1.4 Terms, and Different Things with the Same Spelling
This article will consistently use the following terms:- Signal: A sequence of values used to determine scaling decisions.
- Producing Layer: The component that publishes signal values to CloudWatch. This includes services, CloudWatch agents, and user applications.
- Evaluating Layer: The component that aggregates signals over time and compares them against thresholds. CloudWatch alarms fall within this layer. In a target tracking policy, Application Auto Scaling and EC2 Auto Scaling create and manage these alarms.
- Acting Layer: The component that calculates the amount to add or subtract and adjusts capacity. This includes policy calculations, cooldown, warmup, protection, minimum and maximum capacity, and suspension settings.
- Resolution: The interval at which signal points are published.
- Publishing Delay: The time elapsed between measuring a value and when it becomes available in CloudWatch.
- Scale Out: The action of increasing capacity. Scale In: The action of decreasing capacity. While some materials may use "scale down," this article will use "scale in." However, the term "scale down duration" in the ECS deep-dive blog is written as "the time to scale down."
- Policy Type: This refers to target tracking, step, simple, scheduled, and predictive – five different types. This article will use the English names for these types.
Application Auto Scaling and EC2 Auto Scaling are similar but distinct services. Application Auto Scaling scales targets other than EC2, such as ECS services, DynamoDB tables, and SageMaker AI endpoints. EC2 Auto Scaling scales EC2 Auto Scaling groups. The two services utilize different APIs and have different predefined types.
Cooldown and warmup are separate mechanisms. Cooldown refers to the waiting period after a scaling action before the next scaling action is initiated. Warmup, in the context of EC2 Auto Scaling, refers to the period during which newly launched instances are excluded from the group's metric aggregation.
In SageMaker AI, variants and inference components represent different units. A variant is the production variant of an endpoint and has an associated number of instances. An inference component is the unit of a model hosted on an endpoint and has a number of model copies.
WorkSpaces also has a similar name that refers to a different product. Amazon WorkSpaces Applications is the new name for Amazon AppStream 2.0. The type names and the API reference keep the AppStream name. WorkSpaces pools, on the other hand, refer to Amazon WorkSpaces Pools, which has a separate type.
The developer guide for Lambda now refers to Lambda functions as Event Functions. This article writes Lambda's provisioned concurrency as Lambda PC.
This article sometimes shortens SageMaker AI to SageMaker. The type names and URLs in the documentation will retain their original spelling.
2. How to Read the Tables
This chapter defines the terminology used in the tables within this article, specifically the terms for the state of the sources, as well as the format for values and dates.2.1 Terms for the State of the Sources
This article uses six terms to describe the state of the documentation. These terms, including their English spellings, will also be used in the tables.- Stated: The documentation contains a statement regarding the matter.
- Stated as not supported: The documentation explicitly states that the matter is not supported or cannot be used.
- Documentation does not list: While a list or table exists, the specific item is not included. This does not necessarily indicate that the matter is unsupported or unavailable.
- No statement found: Despite searching using different keywords and categories of the sources in Section 1.3, no relevant statement could be found. This does not indicate that the matter is absent or does not occur.
- Sources disagree: The documentation from two different sources provides conflicting statements regarding the same matter. This includes cases where the statements directly contradict each other, as well as cases where the scope, strength, or subject matter differs, and the text alone does not settle which one applies. This article presents both statements and their sources without designating either as incorrect.
- Inference: This represents an inference made by this article, and is not a statement found in any of the documentation. This article says in the same sentence that it is an inference.
This article distinguishes between "Stated as not supported" and "No statement found." The former refers to a statement in the documentation, while the latter indicates that this article was unable to find a relevant statement.
2.2 How This Article Writes Values and Dates
The types, default values, and limits mentioned in this article are the values in the sources read on November 10, 2026. Two ECS types were also added to the predefined types in June 2026. Readers need to recheck the values against the sources at the time they use them.For AWS measurements, this article names the source of the value in the same sentence. This article does not treat measurements as the superiority of products or services.
3. The Three Layers of a Signal
This chapter divides the determination of auto scaling into three layers. Defining what is decided in each layer will make the tables in Chapters 4 through 8 easier to understand.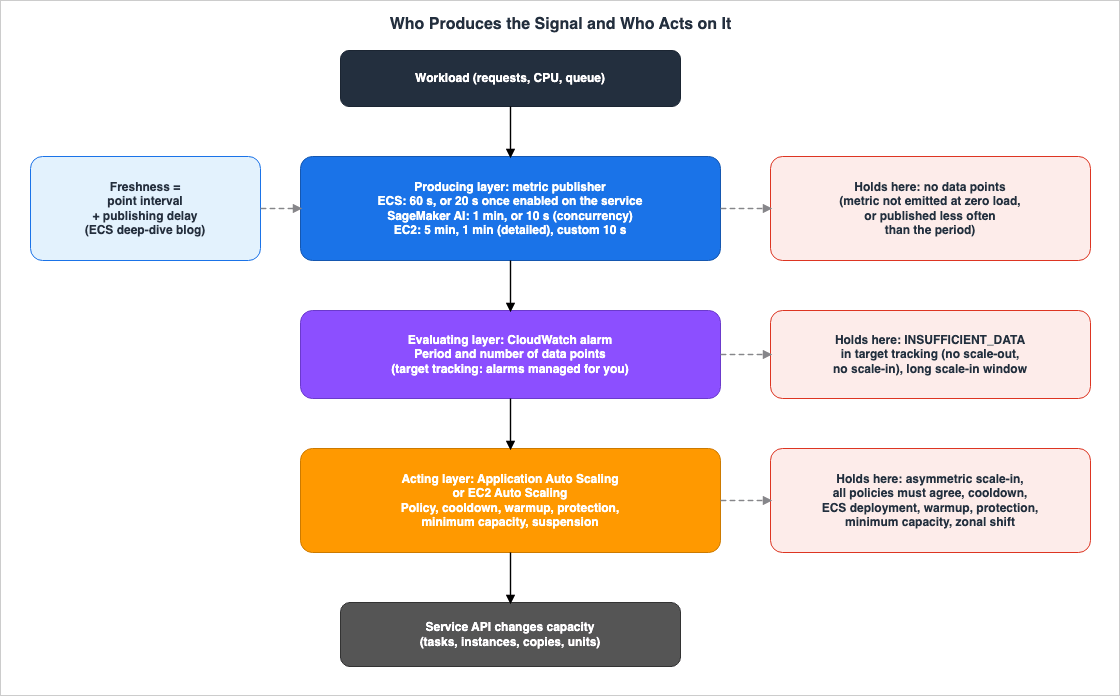
| Layer | Decision Made | Who Configures | What Can Hold It Back |
|---|---|---|---|
| Producing layer | Which metrics to publish, at what resolution, and with what delay. | Each service, user applications, and CloudWatch agents. | Periods with no metric data, coarse resolution. |
| Evaluating layer | Over what time period, examining how many data points, and when to trigger a threshold. | For target tracking, the service creates the alarm. For step and simple scaling, the user creates the alarm. | INSUFFICIENT_DATA, long windows watched by the scale-in alarm. |
| Acting layer | How much to add or remove, how long to wait before the next activity, and capacity that must not be removed. | Policies, cooldown, warmup, protection, minimum capacity, and suspension settings. | Cooldown, warmup, protection, deployments, minimum capacity, zonal shift. |
For target tracking, the service creates the alarms in the evaluating layer; users do not. The target tracking page states that Application Auto Scaling creates and manages CloudWatch alarms, and asks users not to create, edit, or delete those alarms. The EC2 target tracking page makes the same point regarding EC2 Auto Scaling.
This article divides signal freshness into two parts: resolution (the interval between data points) and publishing delay (the time it takes for data points to become available). The ECS deep-dive blog, describing the ECS high-resolution metrics, describes these two aspects as separate changes (Section 5.2).
What holds scale-in back is present across all three layers. Chapter 7 lists all of it, with the layer of each item.
4. All Predefined Metric Types
This chapter lists all the predefined metric types available when using target tracking scaling policies in Application Auto Scaling.The Valid Values of
PredefinedMetricSpecification in the Application Auto Scaling API reference listed 31 types on November 10, 2026. This article uses that API reference list as the definitive source.The table on the metrics page correlates each metric type with its corresponding original CloudWatch metric. This table lists 30 types and does not include
WorkSpacesAverageUserSessionsCapacityUtilization. ALBRequestCountPerTarget appears in two locations: for ECS and Spot Fleet. The metrics page describes the values of the predefined metrics as averages calculated over one minute, and unless otherwise noted, expresses them as percentages.| Service | Predefined Type | Original CloudWatch Metric | Unit |
|---|---|---|---|
| ECS | ECSServiceAverageCPUUtilization | CPUUtilization | Percent |
| ECS | ECSServiceAverageMemoryUtilization | MemoryUtilization | Percent |
| ECS | ECSServiceAverageCPUUtilizationHighResolution | CPUUtilization | Percent |
| ECS | ECSServiceAverageMemoryUtilizationHighResolution | MemoryUtilization | Percent |
| ECS, Spot Fleet | ALBRequestCountPerTarget | RequestCountPerTarget | Count |
| Spot Fleet | EC2SpotFleetRequestAverageCPUUtilization | CPUUtilization | Percent |
| Spot Fleet | EC2SpotFleetRequestAverageNetworkIn | NetworkIn | Count |
| Spot Fleet | EC2SpotFleetRequestAverageNetworkOut | NetworkOut | Count |
| SageMaker AI | SageMakerVariantInvocationsPerInstance | InvocationsPerInstance | Count |
| SageMaker AI | SageMakerInferenceComponentInvocationsPerCopy | InvocationsPerCopy | Count |
| SageMaker AI | SageMakerVariantProvisionedConcurrencyUtilization | ServerlessProvisionedConcurrencyUtilization | Percent |
| SageMaker AI | SageMakerVariantConcurrentRequestsPerModelHighResolution | ConcurrentRequestsPerModel | Count (Inference) |
| SageMaker AI | SageMakerInferenceComponentConcurrentRequestsPerCopyHighResolution | ConcurrentRequestsPerCopy | Count (Inference) |
| DynamoDB | DynamoDBReadCapacityUtilization | ProvisionedReadCapacityUnits, ConsumedReadCapacityUnits | Percent |
| DynamoDB | DynamoDBWriteCapacityUtilization | ProvisionedWriteCapacityUnits, ConsumedWriteCapacityUnits | Percent |
| Amazon Keyspaces | CassandraReadCapacityUtilization | ProvisionedReadCapacityUnits, ConsumedReadCapacityUnits | Percent |
| Amazon Keyspaces | CassandraWriteCapacityUtilization | ProvisionedWriteCapacityUnits, ConsumedWriteCapacityUnits | Percent |
| Aurora | RDSReaderAverageCPUUtilization | CPUUtilization | Percent |
| Aurora | RDSReaderAverageDatabaseConnections | DatabaseConnections | Count |
| Neptune | NeptuneReaderAverageCPUUtilization | CPUUtilization | Percent |
| ElastiCache | ElastiCacheEngineCPUUtilization | EngineCPUUtilization | Percent |
| ElastiCache | ElastiCachePrimaryEngineCPUUtilization | EngineCPUUtilization | Percent |
| ElastiCache | ElastiCacheReplicaEngineCPUUtilization | EngineCPUUtilization | Percent |
| ElastiCache | ElastiCacheDatabaseMemoryUsagePercentage | DatabaseMemoryUsagePercentage | Percent |
| ElastiCache | ElastiCacheDatabaseMemoryUsageCountedForEvictPercentage | DatabaseMemoryUsageCountedForEvictPercentage | Percent |
| ElastiCache | ElastiCacheDatabaseCapacityUsageCountedForEvictPercentage | DatabaseCapacityUsageCountedForEvictPercentage | Percent |
| Lambda | LambdaProvisionedConcurrencyUtilization | ProvisionedConcurrencyUtilization | Percent |
| Amazon MSK | KafkaBrokerStorageUtilization | KafkaDataLogsDiskUsed | Percent |
| Amazon Comprehend | ComprehendInferenceUtilization | InferenceUtilization | Percent |
| WorkSpaces Applications | AppStreamAverageCapacityUtilization | CapacityUtilization | Percent |
| WorkSpaces Pools | WorkSpacesAverageUserSessionsCapacityUtilization | Documentation does not list | Documentation does not list |
This table's units column follows the notes on the metrics page. The metrics page does not mark the two concurrent-request types as counts. The SageMaker metrics page describes these two metrics as representing the number of concurrent requests. This article will interpret them as counts (Inference).
Two notes in the API reference bear on this table. One specifies that
ALBRequestCountPerTarget is only applicable to Spot Fleet and ECS services. This type takes a ResourceLabel to identify the load balancer and target group. The other is the following sentence about the two ECS high-resolution types:You must enable high-resolution metrics in Amazon ECS before creating a scaling policy with this metric type.EC2 Auto Scaling's predefined types are not included in these 31. The EC2 Auto Scaling API reference's
PredefinedMetricSpecification includes four types: ASGAverageCPUUtilization, ASGAverageNetworkIn, ASGAverageNetworkOut, and ALBRequestCountPerTarget. The two API references both use ALBRequestCountPerTarget, but refer to different types.SageMaker AI's asynchronous inference metric,
ApproximateBacklogSizePerInstance, is not a predefined type. The SageMaker async page provides an example of how to use this metric with custom metric specifications.5. Who Decides How Fresh the Signal Is
This chapter organizes the freshness of signals, by service, based on which layer's settings determine it.| Service | Default Interval | How to Speed Up | Configuration Layer |
|---|---|---|---|
| ECS | 60 seconds | Enable publishing at 20 seconds and select a high-resolution type. | Producing and evaluating layers |
| SageMaker AI | 1 minute (InvocationsPerInstance) | Select the concurrent-request types, emitted every 10 seconds. | Evaluating layer |
| EC2 Auto Scaling | 5 minutes; 1 minute with detailed monitoring | Publish custom metrics at a high resolution and specify a 10-second or 30-second period. | Producing and evaluating layers |
| Spot Fleet | 5 minutes; 1 minute with detailed monitoring | The metrics page recommends using detailed monitoring. | Producing layer |
The "Configuration Layer" in this table is this article's mapping onto the three layers in Chapter 3 (Inference). DynamoDB and EMR will be discussed in Section 5.6.
5.1 Granularity of Target Tracking Evaluation
The target tracking page describes the granularity of evaluation as follows:Target tracking will evaluate metrics aggregated at a one-minute granularity for all predefined metrics and custom metrics, but the underlying metric might publish data less frequently.The page also states that each service determines the interval at which the original metrics are provided. For example, it notes that EC2 metrics are, by default, sent every 5 minutes, and that detailed monitoring allows sending every minute.
This statement regarding a 1-minute granularity conflicts with the Application Auto Scaling API reference, specifically the note regarding ECS high-resolution types (Sources disagree). The API reference describes ECS high-resolution types as follows:
Use this metric for target tracking scaling policies that evaluate metrics every 20 seconds.This article does not claim that either source is incorrect. Instead, it suggests that when selecting ECS high-resolution types, it is best to follow the wording in both the API reference and the ECS high-resolution page (Inference).
5.2 ECS at 20 Seconds
The ECS high-resolution page states that ECS by default publishes CPU and memory utilization metrics every 60 seconds, but can also do so every 20 seconds. The ECS auto scaling page indicates that ECS sends metrics to CloudWatch at one-minute intervals.A 20-second signal works only when both the producing layer and the evaluating layer are configured. In the producing layer, in the service monitoring settings, set the
resolutionSeconds value for CPUUtilization and MemoryUtilization to 20. In the evaluating layer, select in the policy either ECSServiceAverageCPUUtilizationHighResolution or ECSServiceAverageMemoryUtilizationHighResolution.The ECS high-resolution page describes switching existing services in two steps. First, change the monitoring resolution. This change creates a new service revision and triggers a service deployment. Once the deployment is complete and all tasks are reporting metrics every 20 seconds, you can configure the high-resolution policy. Until then, the console does not let you select a high-resolution type.
The ECS high-resolution page also lists the following limitations:
- High-resolution metrics are available for services using Application Load Balancer and Network Load Balancer. They are not available for services using Classic Load Balancer without target groups.
- High-resolution metrics are not supported for services managed by a deployment controller configured to
CODE_DEPLOYorEXTERNAL. - Monitoring settings can be viewed using
DescribeServiceRevisions. The responses fromCreateServiceandUpdateServicedo not return monitoring settings.
This article infers that during the deployment that changes the resolution, the scale-in stop during deployments in Section 7.4 applies (Inference). The two pages do not explicitly state this in the same sentence.
In a "What's New" announcement dated June 18, 2026, AWS announced the availability of high-resolution metrics for ECS. The announcement states that this feature is available across all ECS compute options, including Fargate, ECS Managed Instances, and EC2. As AWS benchmarking values, the announcement says the time to trigger scale-out fell from 363 seconds to 86 seconds, and the time including placing new tasks fell from 386 seconds to 109 seconds. These are AWS measurements.
The ECS deep-dive blog details two key changes. One is publishing CPU and memory utilization every 20 seconds. The other is shortening the delay on the path until a task's measurement can be read as a CloudWatch metric.
A lower-latency publishing path – More frequent data points help only if they also arrive quickly.From this, this article reads that the freshness of signals is not determined by resolution alone (Inference). The publishing delay is not a setting configured by the user; it is a change in the producing layer on the ECS side.
5.3 SageMaker AI at 10 Seconds
The SageMaker metrics page listsConcurrentRequestsPerModel and ConcurrentRequestsPerCopy as high-resolution metrics. The former is the number of concurrent requests that a model's container receives, while the latter is the number of concurrent requests that an inference component receives. This includes requests that are waiting in the container. For models that stream their response as tokens, a request is counted until the final token is returned.The same page describes the relationship between resolution and direction as follows:
Standard metrics, such as the InvocationsPerInstance metric, emit data once every minute. However, these high-resolution metrics emit data every 10 seconds. Therefore, as the concurrent traffic to your models increases, your policy reacts by scaling out much more quickly than it would for standard metrics. However, as the traffic to your models decreases, your policy scales in at the same speed as it would for standard metrics.The types used are
SageMakerVariantConcurrentRequestsPerModelHighResolution for variants and SageMakerInferenceComponentConcurrentRequestsPerCopyHighResolution for inference components. The SageMaker metrics page does not describe a producing-layer setting that enables these 10-second metrics (No statement found).A blog post on the SageMaker blogs, dated July 25, 2024, says that with these types, the time to start scaling out became shorter than one minute. This is a value from an AWS blog.
5.4 EC2 Auto Scaling at 1 Minute and 10 Seconds
The EC2 target tracking page states that EC2 metrics are published every 5 minutes by default, but this interval can be reduced to 1 minute if detailed monitoring is enabled. It recommends enabling detailed monitoring if you are using predefined metric types, such as CPU utilization.The EC2 high-resolution page indicates that CloudWatch metrics published at intervals shorter than 1 minute can be used with target tracking. The process involves specifying a custom metric name and configuring target tracking to monitor that metric for a period shorter than 60 seconds.
Currently the lowest supported interval is 10 seconds.The EC2 Auto Scaling API reference for
TargetTrackingMetricStat states that the default value for Period is 60, and that accepted values are 10, 30, and 60. The EC2 high-resolution page clarifies that periods longer than 60 seconds are not supported.With EC2 Auto Scaling high resolution, the user owns the producing layer. The EC2 high-resolution page notes that to publish EC2 metrics, such as CPU utilization, at a higher resolution, you may need to use the CloudWatch agent. The same page also states that if the metric is not published at the same or a higher resolution than the period you specify, data points go missing. Missing data points cause the data shortage in Section 7.3.
The same page further explains that target values should be defined as values per instance, per minute. This is because metrics counted as sums, such as the number of requests, will produce different values if the period is changed.
5.5 How CloudWatch Describes Sub-Minute Periods
The CloudWatch concepts page states that metrics emitted by AWS services are, by default, at a standard resolution, with a granularity of one minute. The same page says the following about periods shorter than one minute.Only custom metrics that you define with a storage resolution of 1 second support sub-minute periods.This statement conflicts with information found on the ECS high-resolution page and the SageMaker metrics page (Sources disagree). The ECS high-resolution page details how to verify data points at intervals of 20 seconds for metrics in the
AWS/ECS namespace. In contrast, the SageMaker metrics page states that metrics are emitted every 10 seconds. This article reads "by default" on the CloudWatch concepts page as not covering cases switched on the service side (Inference). This article does not decide that either source is incorrect.The period for high-resolution alarms can be either 10 seconds or 30 seconds. This site's Amazon CloudWatch Alarm Design and Alert Fatigue covers the design of high-resolution alarms.
5.6 DynamoDB and EMR
The DynamoDB metrics page indicates that DynamoDB outputs consumed throughput for one-minute periods. Auto scaling is triggered when consumption exceeds a target utilization rate for two consecutive minutes. Scale-in may occur when the utilization falls below the target for 15 consecutive data points. In either case,UpdateTable is invoked, and it may take several minutes for the capacity change to take effect. This site's Amazon DynamoDB Capacity and Global Tables Guide covers DynamoDB operations in detail.The EMR scaling page states that EMR managed scaling evaluates metrics every 5 to 10 seconds. Custom automatic scaling is only available for instance groups and allows you to define evaluation periods only in 5-minute increments. EMR managed scaling is a system where EMR itself determines capacity, and it is not an Application Auto Scaling policy.
6. Which Policy Types Each Service Offers
This chapter lists which types of policies are available for which targets.The
PutScalingPolicy API reference for Application Auto Scaling includes the following note:TargetTrackingScaling—Not supported for Amazon EMR.
StepScaling—Not supported for DynamoDB, Amazon Comprehend, Lambda, Amazon Keyspaces, Amazon MSK, Amazon ElastiCache, or Neptune.
PredictiveScaling—Only supported for Amazon ECS.When presented in a table, categorized by service, this information is as follows:
| Target | Target Tracking | Step | Predictive |
|---|---|---|---|
| ECS services | Stated | Stated | Stated |
| Spot Fleets, Aurora, SageMaker AI, WorkSpaces Applications, WorkSpaces pools, custom resources | Stated | Stated | Stated as not supported |
| EMR instance groups | Stated as not supported | Stated | Stated as not supported |
| DynamoDB, Amazon Keyspaces, Lambda PC, Amazon MSK, ElastiCache, Neptune, Amazon Comprehend | Stated | Stated as not supported | Stated as not supported |
| EC2 Auto Scaling groups | Stated | Stated | Stated |
The term "Stated" in this table is this article's reading that the target is not excluded by the
PutScalingPolicy notes (Inference). The row for EC2 Auto Scaling groups reflects information from the EC2 Auto Scaling user guide. EC2 Auto Scaling supports three dynamic scaling policies: target tracking, step, and simple, as well as predictive and scheduled scaling.Scheduled scaling policies are not a target of
PutScalingPolicy. In Application Auto Scaling, scheduled actions are created using a separate API called PutScheduledAction. The services page indicates that WorkSpaces Applications, ElastiCache, and Spot Fleets are the only services where scheduled scaling can be configured through the console.The "simple" policy is specific to EC2 Auto Scaling. The EC2 cooldowns page recommends using either target tracking or step policies instead of the simple policy.
6.1 Predictive Scaling Does Not Scale In
Predictive scaling is available in both ECS and EC2 Auto Scaling. Both sets of documentation state that predictive scaling alone does not trigger scaling in. The EC2 predictive scaling page states:If the forecast expects a decrease in load, it will not scale in to remove capacity. If you want to remove capacity that is no longer needed, you must create dynamic scaling policies.The ECS predictive scaling page explicitly states that predictive scaling alone will not scale in tasks. Both pages indicate that a 24-hour history is required to begin making predictions. The EC2 predictive scaling page further states that it creates hourly predictions for the next 48 hours, based on metrics from up to the past 14 days, and updates these predictions every 6 hours.
6.2 Considerations When Combining Policies
The target tracking page allows you to apply both target tracking and step policies to the same target, subject to certain considerations. If a step policy begins scaling in, that scale-in is not blocked even if the target tracking policy is not yet ready to scale in. After scaling in, the target tracking policy may subsequently request scaling out.It is also possible to disable the scale-in portion of the target tracking policy and let a step policy handle scale-in instead. This site's Amazon ECS on Fargate Microservices Architecture Guide covers the procedure for configuring this.
7. What Holds Scale-In Back
This chapter is central to this article. When load decreases but capacity does not, it lists, for each layer, what holds scale-in back.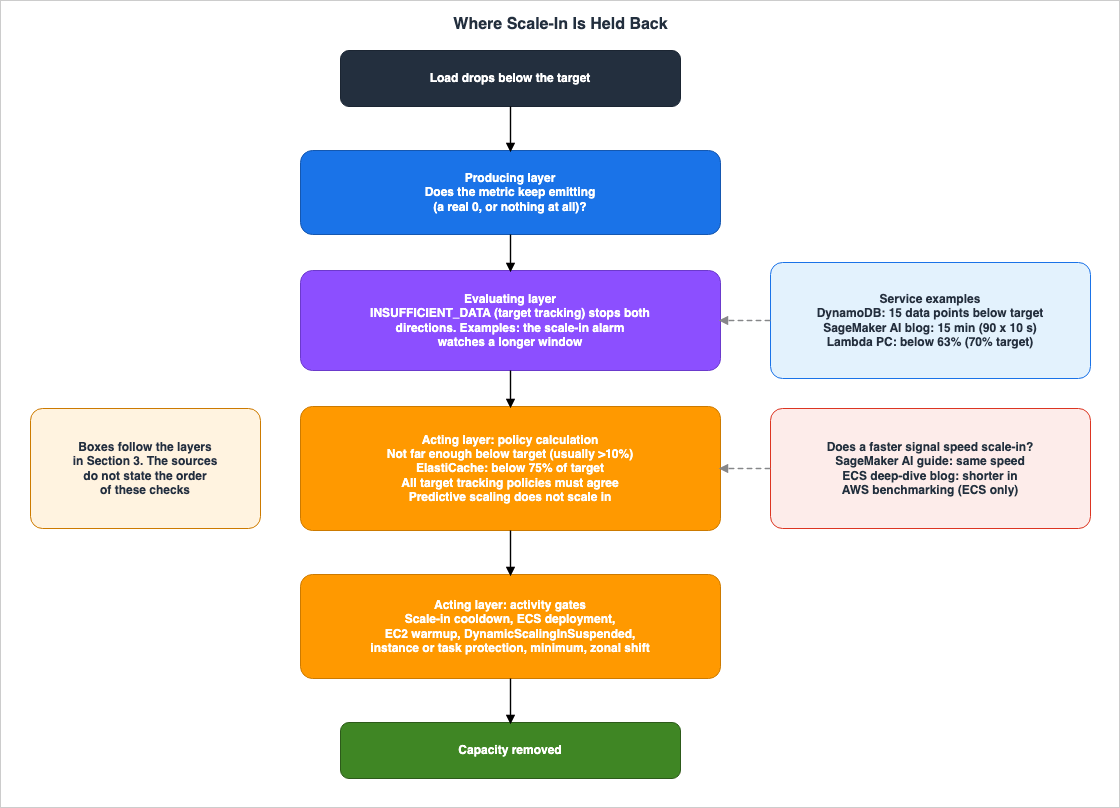
| Layer | What Holds It Back | Direction Held | Target | Source Status |
|---|---|---|---|---|
| Acting layer | Asymmetrical target tracking calculations | Scale-in | Application Auto Scaling, EC2 Auto Scaling | Stated |
| Acting layer | Multiple target tracking policies | Scale-in | Application Auto Scaling, EC2 Auto Scaling | Stated |
| Acting layer | Predictive scaling | Scale-in | ECS, EC2 Auto Scaling | Stated |
| Acting layer | ElastiCache condition (75%) | Scale-in | ElastiCache | Stated |
| Evaluating layer | INSUFFICIENT_DATA | Both | Target tracking policies | Stated |
| Evaluating layer | Long window watched by the scale-in alarm | Scale-in | DynamoDB, SageMaker AI, Lambda PC | Stated (the SageMaker AI value is from a blog, Section 7.6) |
| Acting layer | Scale-in cooldown | Scale-in | Application Auto Scaling | Stated |
| Acting layer | ECS deployment | Scale-in | ECS service | Stated |
| Acting layer | Warmup | Scale-in | EC2 Auto Scaling | Stated |
| Acting layer | Protection from scale-in for instances and tasks | Scale-in | EC2 Auto Scaling, ECS tasks | Stated |
| Acting layer | DynamicScalingInSuspended | Scale-in | Application Auto Scaling | Stated |
| Acting layer | Minimum capacity | Scale-in | Application Auto Scaling, EC2 Auto Scaling | Stated |
| Acting layer | Zonal shift | Scale-in | EC2 Auto Scaling | Stated |
| Acting layer | scaleInAfter | Instance scale-in | ECS Managed Instances | Stated |
This table lists only what holds scale-in back. Only
INSUFFICIENT_DATA also holds back scaling out.7.1 Target Tracking Is Cautious About Removing Capacity
The target tracking page states that a target tracking policy is more cautious when removing capacity than when adding it.When the metric falls below the target value, the policy won't scale-in if it calculates that removing a minimum unit of capacity would likely bring the metric back above the target value.The same page also indicates that in this scenario, the policy does not reduce capacity until utilization falls significantly below the target, typically by more than 10%. For scalable targets with small capacity, the difference between the target value and the actual value may appear more pronounced.
The EC2 target tracking page also states that the target tracking policy gradually scales in when traffic decreases.
7.2 Multiple Policies Must Agree on Scale-In
The target tracking page states that you can assign multiple target tracking policies to a single target, provided they use different metrics. You cannot assign multiple policies using the same metric. The page describes the behavior of multiple policies as follows:It will scale out the scalable target if any of the target tracking policies are ready for scale out, but will scale in only if all of the target tracking policies (with the scale-in portion enabled) are ready to scale in.When multiple policies simultaneously request scaling in or scaling out, Application Auto Scaling will follow the policy that requests the largest capacity. The EC2 target tracking page also describes the same behavior regarding EC2 Auto Scaling. The ElastiCache policies page states that you can only create one policy per metric for a single cluster.
7.3 When No Data Arrives
The target tracking page describes the behavior when data points are missing, as follows:If the metric is missing data points, this causes the CloudWatch alarm state to change to INSUFFICIENT_DATA. When this happens, Application Auto Scaling cannot scale your scalable target until new data points are found.This behavior is not specific to ECS. The target tracking page, as a note regarding the target tracking policy within Application Auto Scaling, describes this behavior without limiting the target. The EC2 target tracking page also contains the same text regarding the target tracking policy. This article does not cover the behavior related to alarms for step-based policies. The ElastiCache target tracking page states that when data is unavailable, the policy does not scale, and does not interpret the shortage as low utilization.
The Lambda PC page states that Lambda only provides the
ProvisionedConcurrencyUtilization metric when the function is receiving requests. When there are no requests, no data points are emitted, the alarm status becomes INSUFFICIENT_DATA, and Application Auto Scaling cannot adjust the provisioned concurrency. This site's AWS Lambda Concurrency and Scaling Guide covers the behavior of Lambda PC in detail.The target tracking page also notes that for metrics that are sparsely reported by design, the
FILL function in metric math can be helpful.7.4 ECS Deployments
The ECS auto scaling page describes the behavior during deployment as follows:Application Auto Scaling turns off scale-in processes while Amazon ECS deployments are in progress. However, scale-out processes continue to occur, unless suspended, during a deployment. This behavior does not apply to Amazon ECS services using the external deployment controller.If you also want to prevent scaling out during deployment, the same page describes steps to specify
DynamicScalingInSuspended and DynamicScalingOutSuspended with RegisterScalableTarget, and to revert these settings after the deployment is complete.7.5 Cooldowns
The target tracking page states that during the scale-in cooldown period, scaling in is blocked. However, if another alarm initiates scaling out during the cooldown period, Application Auto Scaling will immediately begin scaling out, and the scaling in cooldown will end at that point.The default cooldown duration varies depending on the target. The target tracking page details this as follows:
| Default Value | Target |
|---|---|
| 600 seconds | ElastiCache |
| 300 seconds | WorkSpaces Applications fleets, Aurora DB clusters, ECS services, Neptune clusters, SageMaker AI endpoints (variants), SageMaker AI inference components, SageMaker AI serverless provisioned concurrency, Spot Fleets, WorkSpaces pools, custom resources |
| 0 or null | Amazon Comprehend endpoints, DynamoDB tables and global secondary indexes, Amazon Keyspaces tables, Lambda provisioned concurrency, Amazon MSK broker storage |
A value of "null" is treated the same as 0. The default cooldown for EC2 Auto Scaling is 300 seconds, and the EC2 cooldowns page describes it as the wait for simple scaling policies.
The Aurora auto scaling page states that the cooldown period for scaling out Aurora replicas will be ignored if subsequent requests require a larger number of replicas.
7.6 When the Signal Gets Faster, Does Scale-In Get Faster Too?
This section answers the central question of this article with the statements in the sources. The answer is that the sources say different things for different services.Regarding SageMaker AI, the developer guide states that scale-in happens at the same speed even with high-resolution metrics (Section 5.3). A SageMaker blog post from December 2, 2024, describes two alarms for target tracking as follows:
The first triggers scale-out actions after 1 minute (using one 1-minute data point), and the second triggers scale-in after 15 minutes (using 90 10-second data points).This is a value from the blog; no corresponding statement was found in the SageMaker AI developer guide. This article reads that as long as the scale-in alarm watches a long window, a shorter interval between data points does not shorten the time to scale in (Inference).
For ECS, the ECS deep-dive blog states that the same high-resolution metrics also help scale-in.
The same higher-resolution, lower-latency metrics also help on the way down.The ECS deep-dive blog, referencing AWS benchmarks, notes that the time to scale down, when gradually increasing and decreasing load, was reduced from 1,943 seconds to 42 seconds on Fargate, and from 2,343 seconds to 37 seconds on ECS Managed Instances. These are median values across 24 trials. For two other load patterns, the reduction ranged from 20% to 49%. The ECS deep-dive blog further states that in these two load patterns, the load stops more abruptly, meaning that faster metrics have a shorter window to make a difference. This is based on AWS measurements. No statements regarding scale-in speed were found on the ECS high-resolution page or the ECS auto scaling page (No statement found).
Regarding EC2 Auto Scaling, no statements regarding scale-in speed were found on the EC2 high-resolution page (No statement found).
This article does not treat these two as a disagreement. This is because they are different types of sources, a developer guide and a blog, about different services. Readers should verify, within their own services, how long a window the scale-in alarm watches, and which of the sections from 7.1 to 7.9 apply. This article infers that the time to scale in is not solely determined by the interval between data points (Inference).
The 15 consecutive data points for DynamoDB also represent an example where the scale-in side watches a long window (Section 5.6). The Lambda PC page states that when utilization consistently falls below 63%, another alarm reduces provisioned concurrency. 63% represents 90% of the target of 70%.
7.7 EC2 Auto Scaling Warmup and Protection
The EC2 target tracking page describes instance warmup as follows:While the scale-out activity is in progress, all scale in activities initiated by scaling policies are blocked until the instances finish warming up.During the warmup period, instances are not included in the group's metric aggregation. If the policy does not set a warmup value, it uses the group's default instance warmup; if that is also not set, it uses the default cooldown.
The EC2 protection page states that if a scale-in event occurs while all instances are protected, the desired capacity will decrease, but the instances cannot be terminated until the protection is removed. This protection does not safeguard against instance replacement due to health checks, interruptions of Spot Instances, or manual termination.
The EC2 warm pools page explains that while instances are in the warm pool, scaling out only occurs if the metric of the instances in the
InService state exceeds the high threshold of the alarm. This is a condition for scaling out, not scaling in.7.8 ECS Task and Instance Protection
The ECS task protection page explains that tasks with theprotectionEnabled setting will not be terminated by scale-in from service auto scaling or deployments. The protection period can range from 1 minute to 2,880 minutes (48 hours), with a default setting of 120 minutes (2 hours). This site's Amazon ECS Deployment Lifecycle covers the relationship between protected tasks and deployments in detail.For ECS Managed Instances, you can delay scale-in at the instance layer using the
scaleInAfter setting. According to the "What's New" update from November 19, 2025, this delay can be set up to a maximum of 60 minutes. Setting it to -1 will disable infrastructure optimization. This setting applies to the instance layer that hosts the tasks, not the number of tasks themselves.7.9 Suspension Settings, Minimum Capacity, and Zonal Shift
SettingDynamicScalingInSuspended in SuspendedState to true will halt scale-in operations based on target tracking and step scaling policies. DynamicScalingOutSuspended stops scale-out operations, and ScheduledScalingSuspended halts scheduled actions.The ECS auto scaling page states that when the desired count of a service falls below the minimum capacity, scale-in activity will not adjust the desired count.
The ElastiCache target tracking page indicates that scale-in will not occur until the overall metric falls below 75% of the target. If the target is 60%, scale-in will not occur until the metric is 45% or lower. The same page also states that scale-in does not remove shards whose slots hold items larger than 256 MB after serialization, or shards whose removal would leave too little memory.
The EC2 zonal shift page explains that during a zonal shift, EC2 Auto Scaling will prevent any reduction in the desired capacity based on scaling policies across all Availability Zones, but does not prevent increases. This site's Draining an Availability Zone for Days covers the details of a zonal shift.
8. What Can Scale to Zero
This chapter lists the targets whose minimum capacity can be zero, along with the conditions to come back from zero.8.1 Targets That Accept a Minimum of 0
The Application Auto Scaling API reference'sRegisterScalableTarget supports the following 10 targets when specifying a minimum capacity of 0:- AppStream 2.0 fleets
- Aurora DB clusters
- ECS services
- EMR clusters
- Lambda PC
- SageMaker endpoint variants
- SageMaker inference components
- SageMaker serverless endpoint provisioned concurrency
- Spot Fleets
- Custom resources
The same page strongly recommends using a value greater than 0 for the minimum capacity. This is because with a value greater than 0, data points keep being reported to CloudWatch for the scaling policies to use.
The target tracking page states that if a metric emits real 0 values, it can scale in to 0. An example provided is
ALBRequestCountPerTarget. To achieve this, the minimum capacity must be set to 0.Accepting a minimum capacity of 0 and scaling in to 0 are separate things. If a metric stops emitting instead of emitting 0, the alarm state will transition to
INSUFFICIENT_DATA, and scaling will stop (see Section 7.3). While Lambda PC is supported as a target that can accept a minimum capacity of 0, utilization metrics will not be generated when there are no requests.The ECS auto scaling page states that if you want to scale in to zero tasks, you should set the minimum capacity to 0. When the actual capacity is 0 and a metric indicates demand, the target tracking policy will wait for a single data point before scaling out by the minimum amount. This article infers that a metric that shows demand even while there are zero tasks is required (Inference).
The Aurora auto scaling page states that you can configure the minimum and maximum number of Aurora replicas between 0 and 15. However, if the DB cluster does not have any reader instances and the minimum is set to 0, Aurora auto scaling will not function.
8.2 Three Cases for SageMaker AI
Whether you can scale a SageMaker AI endpoint to zero depends on the type of endpoint, categorized into three scenarios.| Type | Scaling to Zero | Scaling Back Up | Documentation Status |
|---|---|---|---|
| Real-time endpoint with an inference component | Possible | A step scaling policy and the NoCapacityInvocationFailures alarm | Stated |
| Real-time variant without an inference component | The SageMaker policy page sets the minimum at 1 or more | No statement found | Sources disagree |
| Asynchronous endpoint | Possible | Comes back based on the queue length. An additional step scaling policy that scales out from zero is also described. | Stated |
The SageMaker zero page outlines the conditions under which an endpoint can be scaled to zero.
An endpoint can scale to and from zero instances only if it hosts inference components.The same page also lists, as a condition, setting
MinInstanceCount to zero in the ManagedInstanceScaling of the production variant. To scale back up from zero, you create a step scaling policy and attach it to a CloudWatch alarm on NoCapacityInvocationFailures. SageMaker AI emits this metric when an endpoint with no instances receives an inference request. The page also states that startup can take several minutes, and calls during that time will result in errors.Be aware that the provisioning process takes several minutes. During that time, any attempts to invoke the endpoint will produce an error.The SageMaker policy page sets the minimum value at 1 or more. However,
RegisterScalableTarget lists SageMaker endpoint variants as accepting a minimum of zero instances. These two disagree (Sources disagree). The SageMaker async page states that asynchronous endpoints can scale in to zero instances, providing an example that uses the sagemaker:variant:DesiredInstanceCount dimension. This article reads the "at least 1" on the SageMaker policy page as a statement about real-time variants (Inference).The SageMaker async page describes how requests received when no instances are running are placed in a queue and processed after scaling out. Without an additional policy, the endpoint does not scale out from zero until the queue length exceeds the target tracking target value. The same page also provides an example of a step scaling policy that scales out when there are requests in the queue and the number of instances is zero.
A blog post on the SageMaker blogs, dated December 2, 2024, also describes an example that uses a scheduled action to set inference component copies to zero over the weekend.
9. Choosing Which Layer to Look At
This chapter aims to help you determine which layer to focus on in common scenarios.| Scenario | Layer to Focus On | What to Observe |
|---|---|---|
| Scaling out is starting slowly | Producing and evaluating layers | Metric resolution and publishing delay, alarm periods, and detailed EC2 monitoring (Chapter 5). |
| Scaling out has started, but capacity is not being reached quickly enough | Acting layer and service startup | Task and instance startup times. Refer to Load Testing on AWS for guidance on how to measure this. |
| Load decreases, but capacity remains high | All three layers | Refer to the table in Chapter 7, starting from the top: asymmetric calculation, multiple policies, INSUFFICIENT_DATA, cooldown, deployment, protection, and minimum capacity. |
| Load disappears, and scaling does not react at all | Evaluating layer | Whether the metric emits 0 or stops emitting (Section 7.3, Section 8.1). |
| High-resolution metrics have been enabled, but scaling in is not happening faster | Evaluating and acting layers | The window of the scale-in alarm, and what holds scale-in back in Chapter 7 (Section 7.6). |
| Capacity increases too much during ECS deployments | Acting layer | Scaling out continues even during deployment. If you want to stop it, use DynamicScalingOutSuspended (Section 7.4). |
| Aiming to scale in to zero | Acting and producing layers | Does the target accept a minimum of zero? Does the metric emit zero? Is there a policy to come back from zero? (Chapter 8). |
| Unable to select high-resolution types for ECS | Producing layer | Has the monitoring configuration deployment completed? What are the types of the deployment controller and load balancer? (Section 5.2). |
10. Where the Sources Disagree and What They Do Not Say
This chapter collects the items in this article that carry a term for the state of the sources.10.1 Where the Sources Disagree
- Granularity of target tracking evaluation: The target tracking page states that all predefined types and custom metrics are evaluated at a 1-minute granularity, while the Application Auto Scaling API reference indicates that high-resolution ECS types are evaluated every 20 seconds (Sources disagree - Section 5.1).
- Shorter than 1-minute intervals: The CloudWatch concepts page specifies that only custom metrics support them, while the ECS high-resolution page and the SageMaker metrics page describe 20-second and 10-second data points for metrics emitted by services (Sources disagree - Section 5.5).
- Minimum for SageMaker AI variants: The SageMaker policy page states that the minimum value is 1, while
RegisterScalableTargetlists endpoint variants among the targets that accept 0 (Sources disagree - Section 8.2).
This article does not treat the following two points as disagreements.
- Scale-in speed when the signal gets faster: The SageMaker AI developer guide and the ECS deep-dive blog are different types of sources about different services (Section 7.6).
- Number of predefined types: The API reference lists 31 types, while the metrics page lists 30. The difference is that the table does not list one type. This article considers the API reference to be the authoritative source (Chapter 4).
10.2 What the Documentation Does Not List
- The
WorkSpacesAverageUserSessionsCapacityUtilizationtype in the metrics page table, and its original metric (Documentation does not list, Chapter 4).
10.3 Items with No Statement Found
- Statements regarding the speed of scaling in on the ECS high-resolution page, the ECS auto scaling page, and the EC2 high-resolution page (Section 7.6).
- A 15-minute value for the scale-in alarm, in the SageMaker AI developer guide (Section 7.6).
- The producing-layer setting that enables the 10-second metrics, on the SageMaker metrics page (Section 5.3).
The fact that an item is not found does not necessarily mean that the item does not exist.
10.4 Important Notes When Reading
- The types, default values, and limits mentioned in this article reflect the values from the documentation as of November 10, 2026. The predefined types may increase over time.
- AWS measurements and blog values are values under the conditions described in those sources. This article does not treat these measurements as the superiority of products.
- This article has not been tested in a real-world environment.
- Sentences marked with "Inference" are not statements in the documentation.
11. Failure Modes
This chapter gathers common failures from the statements in the sources in Chapters 3 through 8.- The assumption that high-resolution metrics also make scale-in faster: The SageMaker AI developer guide states that scale-in occurs at the same rate as with standard metrics. The values in the ECS deep-dive blog represent AWS measurements related to ECS (Section 7.6).
- The assumption that choosing a high-resolution type in a policy gives a 20-second signal: In ECS, you first enable 20-second publishing in the service's monitoring settings. This change triggers a deployment (Section 5.2).
- Looking for high-resolution predefined types in EC2 Auto Scaling: EC2 Auto Scaling high resolution uses custom metrics and periods of 10, 30, or 60 seconds (Section 5.4).
- Specifying a period in an EC2 Auto Scaling policy shorter than the publishing interval: Data points go missing, and the data shortage follows (Sections 5.4, 7.3).
- The assumption that scale-in happens when no data arrives: Alarms configured with target tracking policies will transition to a state of
INSUFFICIENT_DATA, preventing both scaling in and scaling out (Section 7.3). - The assumption that a minimum capacity of 0 brings capacity down to 0 when the load disappears: If the metric stops instead of emitting 0, scaling will cease (Section 8.1).
- The assumption that, among multiple policies, the one that asks for scale-in decides: Scale-in only happens when all policies with scale-in enabled are ready (Section 7.2).
- Combining target tracking and step policies without care: Scale-in by a step policy does not wait for target tracking to be ready (Section 6.2).
- The assumption that predictive scaling alone can reduce capacity: Predictive scaling does not trigger scaling in; dynamic policies are required (Section 6.1).
- The assumption that all scaling stops during ECS deployments: Only scaling in stops; scaling out continues. This does not apply to external deployment controllers (Section 7.4).
- The assumption that the default cooldown period is the same for all targets: ElastiCache has a 600-second cooldown, while ECS and SageMaker AI have a 300-second cooldown. DynamoDB and Lambda PC have a cooldown of 0 (Section 7.5).
- Counting the predefined types from the user guide's table: The table lists 30 types, while the API reference lists 31 (Chapter 4).
- Deciding that a SageMaker AI real-time endpoint cannot scale to zero instances: By hosting inference components, it can. However, calls to an endpoint with zero instances will result in errors until provisioning finishes (Section 8.2).
- Using AWS measurements as an estimate for your own environment or as a measure of product superiority: Measurements are based on the conditions described in the relevant documentation (Section 2.2).
12. Frequently Asked Questions About AWS Scaling Signals
This chapter answers the reader assumptions in Section 1.1 with the statements in Chapters 3 through 8.Q1. If you switch to high-resolution metrics, does scale-in get faster too?
The sources say different things depending on the service. The SageMaker AI developer guide states that using a 10-second metric can speed up scaling out, but scaling in occurs at the same rate as using standard metrics. The ECS deep-dive blog, based on AWS benchmarks, mentions that the time it takes for ECS to scale down has also been reduced. No statement regarding the speed of scaling in was found on the ECS high-resolution page, the ECS auto scaling page, or the EC2 high-resolution page (No statement found, Section 7.6).Q2. Why does capacity not go down to the minimum even after the load disappears?
What holds scale-in back sits in all three layers. A target tracking policy does not remove capacity if removing one unit would likely bring the metric back above the target. Furthermore, multiple policies do not scale in until all of them are ready. In addition, the cooldown period, ECS deployments, EC2 warmup, instance and task protection, and zonal shifts all hold scale-in back (see Chapter 7).Q3. How many predefined metric types are there?
The Application Auto Scaling API reference'sPredefinedMetricSpecification listed 31 types as of November 10, 2026. The table on the metrics page lists 30 types. EC2 Auto Scaling has a separate API with four types (see Chapter 4).Q4. When you attach multiple policies, which one wins?
Scale-out occurs when any one policy asks for it. Scale-in only occurs when all policies with scale-in enabled are ready. When requests are made simultaneously, the policy requesting the largest capacity takes precedence. You cannot attach two target tracking policies that use the same metric (see Section 7.2).Q5. When no data arrives, does it scale in?
With target tracking policies, it does not. If data points are missing and the alarm changes toINSUFFICIENT_DATA, neither Application Auto Scaling nor EC2 Auto Scaling will adjust capacity until new data points are received. The ElastiCache target tracking page states that a data shortage is not interpreted as low utilization (see Section 7.3).Q6. Can a SageMaker AI real-time endpoint scale to zero instances?
Yes, it is possible if the endpoint hosts inference components. You setMinInstanceCount to zero and prepare a step scaling policy and an alarm that bring it back from zero. It takes several minutes for the endpoint to provision instances, and calls during that time will result in errors. Asynchronous endpoints queue requests and come back from zero (see Section 8.2).Q7. Does auto scaling stop during an ECS deployment?
Scaling in will pause, but scaling out will continue. This behavior does not apply to services that use external deployment controllers. To pause scaling out during a deployment, useDynamicScalingOutSuspended (see Section 7.4).Q8. Can EC2 Auto Scaling use 20-second or 10-second signals?
10 seconds is possible, but 20 seconds is not. Instead of using predefined types, you will need to publish custom metrics with a high resolution and set thePeriod to either 10 or 30. The shortest possible interval is 10 seconds. The EC2 metrics themselves are sent every 5 minutes by default, and every minute with detailed monitoring (see Section 5.4).13. Summary
When designing auto scaling signals, ensure the following:- Clearly document where the metrics used for scaling are determined – whether in the producing layer, evaluating layer, or acting layer.
- Verify the predefined types using the API reference documentation, rather than the user guide table.
- If using high-resolution metrics, ensure that both the producing-layer setting and the evaluating-layer type or period are in place. In ECS, have a process to configure the policy after the deployment finishes.
- Differentiate between what you expect from high-resolution metrics – faster scale-out or faster scale-in – and verify the scale-in alarm and what holds scale-in back.
- Assume that scaling will stop when the metric data points are missing.
- If using multiple policies, assume that scale-in will only occur when all of them are ready.
- Verify the impact of the target's default cooldown, warmup, protection, deployment, and zonal shift.
- If scaling in to zero, verify whether the target accepts a minimum of zero, whether the metric emits zero, and whether there is a policy to come back from zero.
- Ensure there is a process to re-evaluate the types, default values, and AWS measurements after the verification date.
14. References
- How target tracking scaling for Application Auto Scaling works - Application Auto Scaling
- Monitor usage of scalable resources using CloudWatch - Application Auto Scaling
- PredefinedMetricSpecification - Application Auto Scaling
- RegisterScalableTarget - Application Auto Scaling
- PutScalingPolicy - Application Auto Scaling
- SuspendedState - Application Auto Scaling
- AWS services that you can use with Application Auto Scaling - Application Auto Scaling
- Target tracking scaling policies for Amazon EC2 Auto Scaling - Amazon EC2 Auto Scaling
- Create a target tracking policy using high-resolution metrics for faster response - Amazon EC2 Auto Scaling
- TargetTrackingMetricStat - Amazon EC2 Auto Scaling
- PredefinedMetricSpecification - Amazon EC2 Auto Scaling
- Scaling cooldowns for Amazon EC2 Auto Scaling - Amazon EC2 Auto Scaling
- Use instance scale-in protection to control instance termination - Amazon EC2 Auto Scaling
- How predictive scaling works - Amazon EC2 Auto Scaling
- Decrease latency for applications with long boot times using warm pools - Amazon EC2 Auto Scaling
- Auto Scaling group zonal shift - Amazon EC2 Auto Scaling
- Scheduled scaling for Amazon EC2 Auto Scaling - Amazon EC2 Auto Scaling
- Automatically scale your Amazon ECS service - Amazon Elastic Container Service
- Faster auto scaling with high-resolution metrics - Amazon Elastic Container Service
- Protect your Amazon ECS tasks from being terminated by scale-in events - Amazon Elastic Container Service
- Use historical patterns to scale Amazon ECS services with predictive scaling - Amazon Elastic Container Service
- Define a scaling policy - Amazon SageMaker AI
- Scale an endpoint to zero instances - Amazon SageMaker AI
- Auto scaling policy overview - Amazon SageMaker AI
- Autoscale an asynchronous endpoint - Amazon SageMaker AI
- Configuring provisioned concurrency for an Event Function - AWS Lambda
- DynamoDB Metrics and dimensions - Amazon DynamoDB
- Target tracking scaling policies - Amazon ElastiCache
- Auto Scaling policies - Amazon ElastiCache
- Use Amazon EMR cluster scaling to adjust for changing workloads - Amazon EMR
- Amazon Aurora Auto Scaling with Aurora Replicas - Amazon Aurora
- Metrics concepts - Amazon CloudWatch
- Amazon ECS announces faster service auto scaling
- Amazon ECS Managed Instances adds configurable scale-in delay
- Deep dive: Auto scaling response times on Amazon ECS
- Amazon SageMaker inference launches faster auto scaling for generative AI models: up-to 6x faster scale-up detection
- Unlock cost savings with the new scale down to zero feature in SageMaker Inference
References:
Tech Blog with curated related content
Written by Hidekazu Konishi