Where the Logs Come From on AWS - The Network, What Each Source Actually Records, and Which Traffic Never Appears in Any of Them
First Published:
Last Updated:
The first thing that stops you at the console is not which log to open. It is whether the line you are looking for is emitted by anything at all. You open the load balancer access logs and find nothing for that time. At this point, three possibilities exist: the traffic did not reach the load balancer, logging was not enabled, or the source simply does not record that type of traffic at all. If the third scenario is true, no matter how long you wait or how many settings you review, that particular record will never appear.
The documentation for AWS network log sources splits into pages that state this third case outright and pages that do not. The VPC Flow Logs user guide lists ten types of traffic that are not captured. Network Load Balancer access logs are not generated unless a TLS listener is configured. Amazon Route 53 public DNS query logging says outright that in some cases only one query in several thousand is logged. These are all characteristics of the log sources themselves, not configuration issues.
This article is an inventory, built so that each network log source can be looked up by four questions. What is the unit of a record? Under what circumstances are logs generated? Where can the logs be sent? And, most importantly, what is not recorded? This is not a design guide for log infrastructure. It stops at the source, and does not take up what happens to the logs after they are collected.
This article is a continuation of Where the Logs Come From on AWS - Identity and the Control Plane. The previous article covered services that record who did what, specifically CloudTrail and sign-in activity. This one covers the network only. It explores the question of where packets, requests, and DNS queries are transformed into log entries.
Table of Contents
- The Questions This Article Answers, and Those It Does Not
- The Source and the Destination, and Why One Service Now Has Two Routes
- The Inventory - Sources Lined Up by the Unit of a Record
- The Unit of Enablement
- What Choosing a Destination Decides
- What Is Not Recorded, and What Covers It Instead
- When the Same Event Reaches Two Sources, Which One Is Authoritative
- Delivery Delay - Not Here Yet Is Not the Same as Never Coming
- What This Inventory Does Not Cover
- Failure Modes
- Frequently Asked Questions
- Summary
- References
1. The Questions This Article Answers, and Those It Does Not
When readers encounter this topic, their question is one of three. First, they want to tell whether a line an investigation needs is missing because the source never emitted it, or because it was simply never enabled. Second, they are seeking records for a specific communication but are unsure which source to consult. Third, they are faced with discrepancies in values across multiple logs for the same communication and need to decide which log to trust.This article addresses these three questions. Conversely, here is what it does not cover.
It does not cover data aggregation, storage, or query design. Layers of aggregation, such as organization trails, a log archive account, and querying with Athena or OpenSearch, are detailed in Centralized Logging and Audit Architecture on AWS. This article focuses on the sources themselves. The procedures for what to do with the collected data – how to query and analyze it – are documented in CloudWatch Logs Insights Query Cookbook.
It does not cover troubleshooting procedures. The decision tree for determining the order in which to examine security groups, network ACLs, and route tables is found in Chapters 3 through 6 of AWS VPC Network Troubleshooting Guide. That guide uses VPC Flow Logs as one step in its procedure, in Chapter 8. This article will not provide step-by-step procedures; it sets out an inventory of sources.
It does not cover the creation of detection rules. Detection Engineering on AWS holds how to build a detection from a collected source. ⚠ The two are close enough in wording that the split is worth stating. Chapter 2 of that guide sets the unit of a source at an event class, and it addresses the conditions that the sources must meet before detection rules can be created. The unit of a record, in this article, is what one log line stands for. Is it a packet, a flow, a request, a connection, a single DNS query, or a single health check result? These are distinct concepts, so keep them apart when reading.
It does not cover the design of Resolver and hybrid DNS. Where endpoints are located and how traffic is routed is detailed in Amazon Route 53 DNS Architecture Guide. This article only addresses what information is contained within a single line of a query log.
It does not redefine terminology. The definitions of VPC, Transit Gateway, PrivateLink, and VPC Lattice are maintained by AWS Networking Glossary. This article will not cover a timeline of when these features were introduced; that information is available in AWS History and Timeline regarding Amazon VPC. This article only describes the current state.
It does not cover the sources in Identity and the Control Plane. The management events, data events, network activity events, sign-in records, and IAM credential reports from CloudTrail are all covered in the first article in this series. There is one place, though, where this article hands off to the first one: the record of an API call that passes through a VPC endpoint, which Chapter 6 names.
It does not cover which endpoint to create. Which endpoint type each data service supports, and what that endpoint actually carries, is covered in Private Connectivity by Service on AWS Data Services.
All official documentation referenced in this article was verified on September 23, 2026. Specifications are subject to change, so please always re-check the relevant pages before using this information for decision-making.
2. The Source and the Destination, and Why One Service Now Has Two Routes
Two foundations come before the table, so that it is not misread. The first is a distinction in terminology carried over from the first article. The second is a shape that the first article did not have.2.1 The Source and the Destination Are Separate Questions
One term is fixed first. In this article, the entity that turns activity into records is the source, and the place where those records are received and accumulated is the destination. This is the same terminology the first article in this series uses. In the context of VPC Flow Logs, the VPC Flow Logs themselves, which transform the flow data into records, are the source, while the S3 bucket is simply the destination.The importance of this distinction lies in the fact that the same symptom – a lack of logs – can arise from issues on either the source side or the destination side. A problem on the destination side usually yields to a configuration change. This might mean changing a bucket policy, adding a Region, or granting a permission. Past data does not come back, but records arrive from then on.
On the other hand, if the source is not generating logs, no amount of configuration on the destination side will yield any results. And as the main subject of this article, the reasons why the source is not generating logs can be divided into two categories: Is it simply that the logging feature is disabled, or is there no mechanism in place to generate logs in the first place? Chapters 3 through 5 answer the former. Chapter 6 answers the latter.
2.2 One Service, Two Routes, One of Them Called Legacy
Before the inventory, there is one shape that will make the table read wrong if you do not know it. In some services, two different mechanisms for delivering the same logs coexist.Amazon CloudFront is a prime example. Its distribution settings offer two standard logging options: standard logging (v2) and standard logging (legacy). Enabling one does not affect the other, as the user guide explicitly states.
If you enable standard logging (v2), this doesn't affect or change standard logging (legacy). You can
continue to use standard logging (legacy) for your distribution, in addition to using
standard logging (v2).
The key point is that these are coexisting options, not a replacement of one by the other. While standard logging (legacy) is referred to as the "previous version," there's no announcement of its discontinuation. You can even enable both options simultaneously. The same guide recommends sending both to separate Amazon S3 buckets or different paths when both are sent to S3. This is to avoid ambiguity and potential overwrites, as it can be difficult to determine which logs are being generated when they are sent to the same location.
A similar situation exists with Elastic Load Balancing. The pages describing access logs for Application Load Balancer and Network Load Balancer refer to their own system as traditional "legacy" logs, and then state that there is another mechanism that runs through CloudWatch Logs.
While traditional "legacy" logs (described in this section) remain available,
Application Load Balancer now offers enhanced logging options through CloudWatch Logs. CloudWatch Logs provide
more flexible delivery options, including to Amazon CloudWatch Logs, Amazon Data Firehose, and Amazon Simple Storage Service.
For Application Load Balancer, the two routes handle the same log types. The route through CloudWatch Logs handles these three.
* Access logs
* Connection logs
* Health check logs
On the legacy route too, the user guide lists these three in separate sections. The third one, health check logs, is delivered to Amazon S3 on the legacy route as well. For Network Load Balancer, the route through CloudWatch Logs carries access logs and nothing else. Inside one Elastic Load Balancing, what is on offer does not line up between Application Load Balancer and Network Load Balancer.
Without knowing this shape, you will make mistakes in two places when reading the documentation. The first is misinterpreting a setting as inactive when, in fact, it is enabled through a different route. With Application Load Balancer, legacy settings are found in the "Attributes" tab, while CloudWatch Logs settings are in the "Integrations" tab. You must check both tabs to determine if a setting is active. The second mistake is remembering the destination options based on the legacy configuration. On the legacy route you can only select Amazon S3. On the new route you can choose CloudWatch Logs, Amazon Data Firehose, or Amazon S3.
The inventory in this article gives these two their own rows. Put them on one row and the destination column would have to carry two answers at once.
2.3 Terminology Used in This Article
Three terms are fixed here, so that the table can be read.| Term | Meaning in This Article |
|---|---|
| Unit of a record | What a given source counts as a single record. This could be a packet, flow, request, connection, DNS query, or health check result. |
| Unit of enablement | The resource for which enabling a setting will trigger the generation of records. |
| Destination | Where the records are delivered. This could be Amazon S3, Amazon CloudWatch Logs, Amazon Data Firehose, or Amazon Kinesis Data Streams. |
⚠ The unit of a record is not the same thing as the number of fields. The number of fields a record contains is a separate issue from what that record represents. For the same traffic, a source whose line stands for a ten-minute flow sits next to a source whose line stands for one request. The unit is what decides an investigation, not the field count. If you are searching for individual requests, opening a table of flows aggregated over ten minutes gets you nowhere, as the granularity you are seeking may not even exist.
3. The Inventory - Sources Lined Up by the Unit of a Record
This is the main body of the article.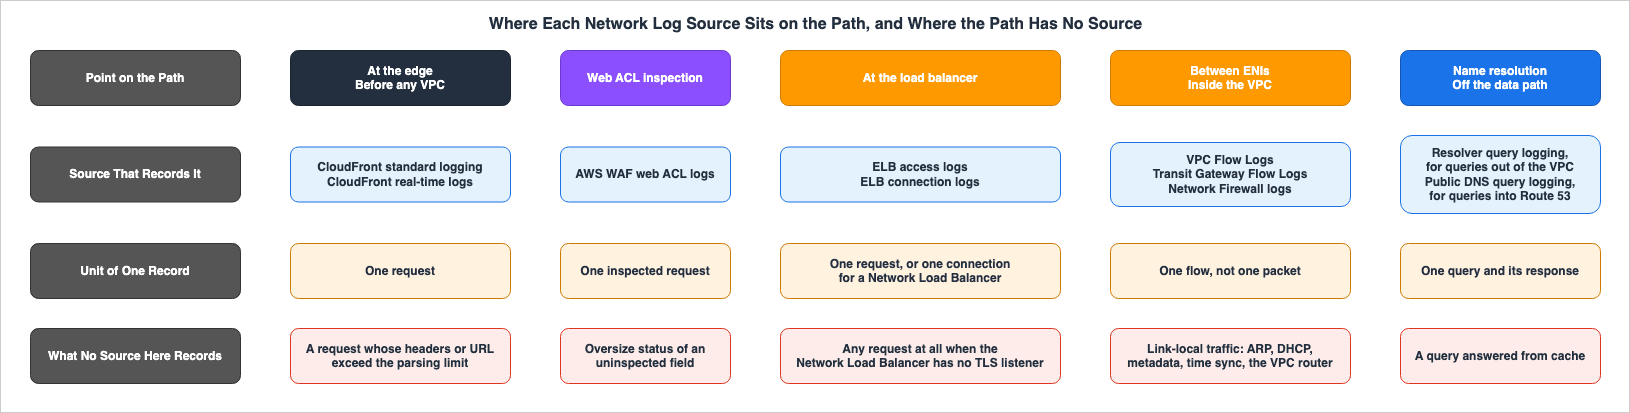
3.1 How to Read This Table
Three columns are what you look a source up by. They are the unit of a record, the state with nothing configured, and where it can be sent. A fourth column carries the primary source page that the row rests on.⚠ This table carries only what a source does record. The first article in this series had a column for what is not recorded. This article does not carry that column. Chapter 6 holds it instead. There are two reasons for this decision. First, negative statements often require a verbatim quote from a primary source, which does not fit in a cell. Second, a negative statement is always paired here with what covers it, which needs two columns rather than one. Do not read the absence of a negative statement in this table as meaning there is none. Chapter 6 carries it.
Each row stands for one source. Even within one service, a row is split when the unit of a record, the unit of enablement, or the destination differs. For example, the rows for Application Load Balancer access logs, connection logs, and health check logs are separate because the unit of a record differs. Similarly, the three rows for CloudFront are distinct because they represent different destinations.
3.2 The Sixteen Sources
| Source | Unit of a record | State with nothing configured | Where it can be sent | Primary source |
|---|---|---|---|---|
| VPC Flow Logs | A single network flow, also referred to as a flow log record. Not based on individual packets. | Nothing appears. Records start once a flow log exists. | Amazon CloudWatch Logs / Amazon S3 / Amazon Data Firehose | Logging IP traffic using VPC Flow Logs |
| Transit Gateway Flow Logs | Similarly, a single flow. Includes fields specific to transit gateways. | Nothing appears. ⚠ You must own the transit gateway to create one. | Amazon CloudWatch Logs / Amazon S3 / Amazon Data Firehose | AWS Transit Gateway Flow Logs |
| Route 53 Resolver query logging | A single DNS query and its corresponding response. | Nothing appears. Records start once a query logging configuration exists and a VPC is associated with it. | Amazon CloudWatch Logs / Amazon S3 / Amazon Data Firehose | Resolver query logging |
| Route 53 public DNS query logging | A single public DNS query received by Route 53. A separate source from the previous entry. | Nothing appears. You configure it per public hosted zone. | Amazon CloudWatch Logs only | Public DNS query logging |
| Application Load Balancer access logs (legacy) | A single request. For WebSockets, this represents a single connection, and is written when the connection closes. | Disabled | Amazon S3 only | Access logs for your Application Load Balancer |
| Application Load Balancer connection logs (legacy) | A single connection. Includes information about TLS cipher suites, handshake results, and client certificate details. | Disabled | Amazon S3 only | Connection logs for your Application Load Balancer |
| Application Load Balancer health check logs (legacy) | A single health check result for a registered target. When the check fails, the reason code is included. | Disabled | Amazon S3 only | Health check logs |
| Application Load Balancer CloudWatch Logs integration | The same log types as the three rows above. Supports only access logs, connection logs, and health check logs. | Disabled. Configure it on the Integrations tab. | Amazon CloudWatch Logs / Amazon Data Firehose / Amazon S3 | CloudWatch Logs for your Application Load Balancer |
| Network Load Balancer access logs (legacy) | A single TLS connection. Only generated if a TLS listener is configured. | Disabled | Amazon S3 only | Access logs for your Network Load Balancer |
| Network Load Balancer CloudWatch Logs integration | Similarly, a single TLS connection. Supports only access logs; does not include connection logs or health check logs. | Disabled. Configure it on the Integrations tab. | Amazon CloudWatch Logs / Amazon Data Firehose / Amazon S3 | CloudWatch logs for your Network Load Balancer |
| CloudFront standard logging (v2) | A single request from a viewer. Allows you to select the fields to output. | Disabled | Amazon CloudWatch Logs / Amazon Data Firehose / Amazon S3 | Configure standard logging (v2) |
| CloudFront standard logging (legacy) | Similarly, a single request. Fields cannot be selected. | Disabled | Amazon S3 only | Configure standard logging (legacy) |
| CloudFront real-time logs | A single request. Uses a SamplingRate to specify an integer from 1 to 100, and receives data at that percentage. | Disabled | Amazon Kinesis Data Streams only | Real-time logs |
| AWS WAF web ACL logs | A single web request inspected by AWS WAF. | Nothing appears. Records start once PutLoggingConfiguration has attached a destination. | Amazon CloudWatch Logs / Amazon S3 / Amazon Data Firehose. ⚠ Only one destination can be specified per web ACL. | Logging web ACL traffic |
| AWS Network Firewall logs | Varies by log type. FLOW represents a single flow, ALERT represents a single matched rule, and TLS represents a single TLS inspection event. | Disabled. You enable it after creating the firewall. | Amazon S3 / Amazon CloudWatch Logs / Amazon Data Firehose. Different destinations can be specified for each log type. | Logging network traffic from AWS Network Firewall |
| VPC Lattice access logs | A single request and response. Two types are available: VpcLatticeAccessLogs and VpcLatticeResourceAccessLogs, and they must be configured separately. | Disabled | Amazon CloudWatch Logs / Amazon S3 / Amazon Data Firehose | Access logs for Amazon VPC Lattice |
The confirmation date is September 23, 2026.
⚠ A note on terminology. The AWS WAF Developer Guide has updated its terminology to use "protection pack" (web ACL) for headings, reflecting the new console experience introduced in 2025. While the names of resources and APIs remain "web ACL,"
PutLoggingConfiguration serves as the entry point for configuration. This article uses "web ACL" as the subject throughout, both when referencing materials and when creating tables.3.3 Three Things This Table Shows
Reading the table vertically, three key points emerge.First, not one source emits anything when nothing is done. Every single one of the sixteen rows only produces logs if a specific feature is enabled, or if log settings are actively configured. This is a significant difference from the first article in this series. In that one, CloudTrail management events were recorded by default, and sign-in records appeared without anyone turning them on. There are no equivalent sources on the network side. What you can investigate afterward is therefore settled entirely by what was on before the incident. Chapter 4 takes this asymmetry up again.
⚠ However, the way the documentation is written is not consistent. The documentation clearly states that the logs for Elastic Load Balancing and VPC Lattice access logs are disabled by default. In contrast, the documentation for CloudFront only describes the steps to enable it, without explicitly stating that it is disabled by default. The same applies to VPC Flow Logs, Transit Gateway Flow Logs, Route 53, AWS WAF, and AWS Network Firewall – the documentation only provides instructions for configuring them. This article treats the former as an explicit statement in the documentation, and the latter as a structure in which nothing exists until a configuration is created. The conclusion is the same, but the strength of the justification differs. Since this article deals in negatives, the distinction is worth stating.
Second, the unit of a record splits five ways. There are two sources that count individual flows, two that count individual DNS queries, six that count individual requests, three that count individual connections, and one that counts individual health check results. The remaining two rows contain multiple log types. Those are the Application Load Balancer CloudWatch Logs integration and AWS Network Firewall, where the unit splits again inside the row. This distinction directly impacts whether or not you can find what you are looking for. If you are investigating why a single request returned a 400 error, opening sources related to flows will yield no answers. Conversely, if you want to know how much data was sent to a specific destination, using request-level sources will require you to aggregate the data.
Third, seven sources have only one destination available to them. Route 53's public DNS query logging goes only to Amazon CloudWatch Logs, CloudFront's real-time logs are sent exclusively to Amazon Kinesis Data Streams, and the five rows called legacy each go only to Amazon S3. A design that consolidates every destination into one place breaks at all seven. Chapter 5 takes up how it breaks.
3.4 One Source Lets You Set the Width of a Record
The table gives the unit of a record for VPC Flow Logs as a flow. There is one more layer to it. You can choose the time interval that each entry represents when creating the flow logs.The aggregation interval is the period of time during which a particular flow is
captured and aggregated into a flow log record. By default, the maximum aggregation
interval is 10 minutes. When you create a flow log, you can optionally specify a
maximum aggregation interval of 1 minute.By default, the maximum interval is 10 minutes, but you can select 1 minute when creating them. On the API side,
MaxAggregationInterval is specified in seconds, and the only valid values are 60 and 600.However, this default behavior has a condition associated with it.
When a network interface is attached to a Nitro-based
instance, the aggregation interval is always 1 minute or less,
regardless of the specified maximum aggregation interval.
For network interfaces attached to Nitro-based instances, the interval will always be 1 minute or less, regardless of the value you specify. This means that even if you configure it for 10 minutes, there may be configurations where the data is actually provided in 1-minute increments. The same configuration settings can produce different results depending on the underlying interface.
This selection is irreversible. Flow logs cannot be modified after they are created.
After you create a flow log, you can't change its configuration or the
flow log record format. For example, you can't associate a different IAM role
with the flow log, or add or remove fields in the flow log record. Instead, you
can delete the flow log and create a new one with the required configuration.
Both the aggregation interval and the record format are immutable after creation. If you need to change them, you must delete the existing flow logs and recreate them. Data that flows during this process will not be recorded. You often want to increase the granularity of your investigation during an incident, but changing the settings at that time will result in lost data. The granularity should be determined before an incident occurs.
⚠ The aggregation interval itself is not new here. Chapter 8 of AWS VPC Network Troubleshooting Guide already carries the same 10-minute and 1-minute values and the same Nitro condition, as groundwork for reading a record. What this article adds is the single point that the value cannot be changed afterward.
4. The Unit of Enablement
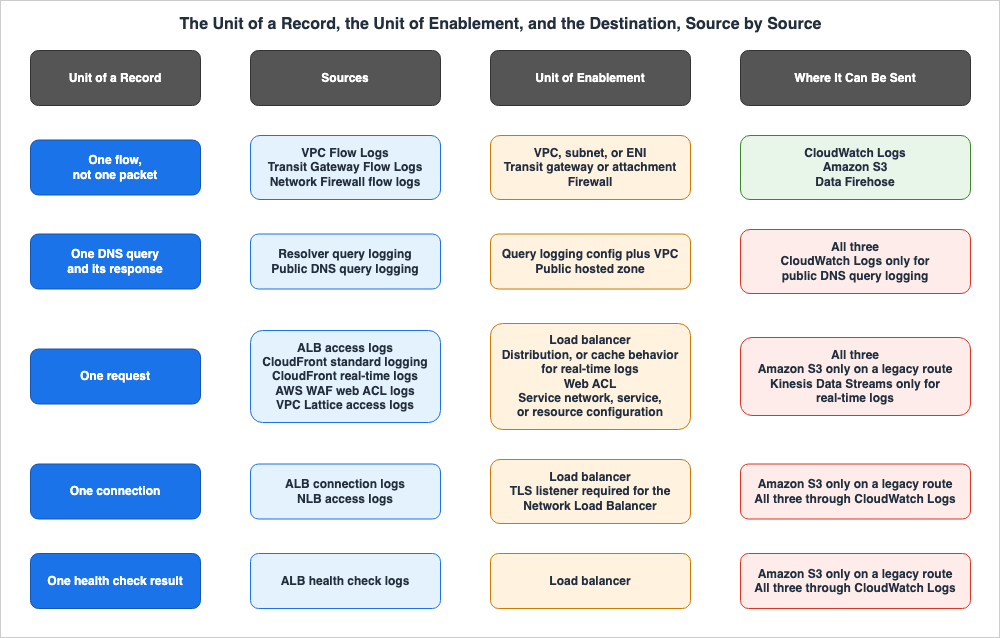
4.1 Where You Set It for Records to Appear
After the unit of a record, the next thing that decides an outcome is the unit of enablement. Which resource you set it on changes the amount of inventory work by an order of magnitude.| Source | Unit of enablement | Primary source |
|---|---|---|
| VPC Flow Logs | A three-tier structure: VPC, subnet, and network interface. Specifying a subnet or VPC will include all network interfaces within it. | Flow logs basics |
| Transit Gateway Flow Logs | The transit gateway itself, or individual attachments. | AWS Transit Gateway Flow Logs |
| Route 53 Resolver query logging | The query log configuration and the VPC associated with it. You can associate it directly with the VPC, or via a Route 53 Profile. | Managing Resolver query logging configurations |
| Route 53 public DNS query logging | Public hosted zone. | Public DNS query logging |
| Elastic Load Balancing logs | The load balancer. For legacy configurations, use the Attributes tab; for CloudWatch Logs integration, use the Integrations tab. | CloudWatch Logs for your Application Load Balancer |
| CloudFront standard logging (two types) | Distribution. | Configure standard logging (v2) |
| CloudFront real-time logs | Can be set per cache behavior. It does not have to cover the whole distribution. | Real-time logs |
| AWS WAF web ACL logs | web ACL. | Logging web ACL traffic |
| AWS Network Firewall logs | Firewall. Can be enabled after creation. | Logging network traffic from AWS Network Firewall |
| VPC Lattice access logs | Three of them: service network, service, and resource configuration. | Access logs for Amazon VPC Lattice |
The confirmation date is September 23, 2026.
4.2 The Higher the Unit Sits, the Less Gets Missed
The three tiers of VPC Flow Logs are what matters most in this chapter. Once configured for a VPC, all network interfaces within that VPC are automatically included. Newly launched instances are also automatically incorporated, as clearly stated in the user guide.If you launch an instance into your subnet after creating a flow log for your
subnet or VPC, we create a log stream (for CloudWatch Logs) or log file object (for Amazon S3)
for the new network interface.Conversely, if configured at the network interface level, newly added interfaces will not be included. Even when performing the same function, what future resources are covered depends on which level you configured.
Route 53 Resolver query logging offers a similar mechanism, albeit in a different form. You can directly associate query logs with a VPC, or you can associate them with a Route 53 Profile, which then applies to all VPCs associated with that profile. A configuration is required in each Region, as outlined in the official documentation.
This must be the same Region where you
created the VPCs that you want to log DNS queries for. If you have VPCs in
multiple Regions, you must create at least one query logging configuration
for each Region.
Opening a new Region is where this step gets missed. Gaps in logging are particularly likely to appear at Region boundaries.
AWS Network Firewall operates in a contrasting manner. You must enable logging for each individual firewall. Unlike the previous example, there is no structure that automatically includes lower-level resources once configured at a higher level. Each time you add a firewall, the same configuration steps are required.
4.3 A Constraint That Allows Only One Destination
AWS WAF has limitations regarding destinations. ThePutLoggingConfiguration API reference explicitly states two such limitations. One is that only one destination can be configured for a single web ACL.You can define one logging destination per web ACL.While this might seem like a topic for a later chapter, it belongs to the unit of enablement. In a source such as VPC Flow Logs, it is possible to send the same logs to two different locations, using one for investigation and the other for long-term storage. AWS WAF does not offer this capability. If you need to deliver logs to two locations, you will need to branch on the destination side.
The other limitation concerns the naming of destinations.
The name that you give the destination must start with aws-waf-logs-.You might encounter issues if you attempt to directly send logs to an existing bucket or log group, only to find that the name does not comply with the required format. The correct procedure is to first create the destination, and then use
PutLoggingConfiguration to associate it with the web ACL.5. What Choosing a Destination Decides
Choosing a destination is not just about where something is placed. It determines how the logs are read, the form the records will take, and even whether a destination is actually available. This chapter will examine these three aspects in turn.5.1 The Destination Table
| Destination | Sources That Can Use It | What the Choice Decides |
|---|---|---|
| Amazon CloudWatch Logs | Ten out of sixteen. Not available for CloudFront real-time logs and five legacy sources. | Can be accessed with Logs Insights. Metrics filters can be created. Live Tail allows you to view real-time streams. |
| Amazon S3 | Fourteen out of sixteen. Not available for Route 53 public DNS query logging and CloudFront real-time logs. | Can be stored for extended periods. Can be accessed with Athena. With CloudFront standard logging (v2), you can select partitions and Hive-compatible file names. |
| Amazon Data Firehose | Nine out of sixteen. Not available for five legacy sources, Route 53 public DNS query logging, and CloudFront real-time logs. | Can be delivered to other destinations. Destinations can be located outside of AWS. |
| Amazon Kinesis Data Streams | Only CloudFront real-time logs. | Data can be received in seconds. |
The confirmation date is September 23, 2026.
5.2 Consolidating Every Destination Into One Place Breaks at Seven Sources
Many organizations aim to consolidate their log destinations to a single point. It breaks at the seven sources counted in Chapter 3, every time.Route 53 public DNS query logging can only be sent to Amazon CloudWatch Logs. If your design aggregates logs to Amazon S3, this is the one path that goes elsewhere. You will need to either adjust the retention period for your log groups or configure a separate export to Amazon S3.
Real-time logs from CloudFront can only be sent to Amazon Kinesis Data Streams. That is the structure you get in exchange for speed, and how the logs are received differs from the other three destinations in kind, not degree.
The five rows called legacy can only be sent to Amazon S3. As discussed in Chapter 2, migrating to the new route removes this constraint. Keep the constraints that migration removes apart from the ones it does not.
5.3 Choosing a Destination Also Changes the Shape of the Record
Selecting a destination does not simply determine the storage location. In some cases, the format of the logs themselves changes depending on the destination.A good example is CloudFront's standard logging (v2). Only when you choose Amazon S3 will two options appear: partitioned files and Hive-compatible filenames. You can also select the output format, including Apache Parquet. However, if you choose Amazon CloudWatch Logs, these options are not available.
Application Load Balancer and Network Load Balancer operate in a similar way. When routing logs through CloudWatch Logs, you can use the Apache Parquet format when sending them to Amazon S3. However, when using the legacy route, only compressed text files are available.
⚠ Changing the format also means changing how the logs are accessed. When migrating a destination, existing queries may not necessarily continue to function as before.
6. What Is Not Recorded, and What Covers It Instead
This is the core of this article.Chapters 3 through 5 dealt with what appears once you turn it on. This chapter deals with what does not appear even after you turn it on.
6.1 A Negative Can Only Be Written From an Explicit Sentence in a Primary Source
One principle comes first. Every item in this chapter has an explicit negative sentence in a primary source. Nothing is written here as unrecorded merely because the documentation does not mention it. When three differently worded searches turn up nothing, this article says that it could not be verified.Every item in this chapter is also paired with whatever covers it. A list of items that are not recorded would invariably assist those seeking to avoid investigation. Only when presented in pairs does the writing serve to fill gaps in the record. Where nothing covers an item, this article says so plainly, and then says what question that item would have been used to answer.
6.2 Ten Items Not Captured by VPC Flow Logs
The list quoted most often out of this chapter is this one. Flow log limitations in the user guide enumerates the traffic that VPC Flow Logs does not capture.Flow logs do not capture all IP traffic. The following types of traffic are not
logged:
* Traffic generated by instances when they contact the Amazon DNS server. If you
use your own DNS server, then all traffic to that DNS server is logged.
* Traffic generated by a Windows instance for Amazon Windows license
activation.
* Traffic to and from 169.254.169.254 for instance metadata.
* Traffic to and from 169.254.169.123 for the Amazon Time Sync
Service.
* DHCP traffic.
* Traffic mirrored source traffic. You will see traffic mirrored target traffic
only.
* Traffic to the reserved IP address for the default VPC router.
* Traffic between an endpoint network interface and a Network Load Balancer network interface.
* Address Resolution Protocol (ARP) traffic.
* Traffic on a short-lived regional NAT gateway, which is deleted a few minutes after creation.There are ten items on the list. The first one carries a condition. Only traffic destined for Amazon's DNS servers is not captured; if you are using your own DNS server, all traffic to that server is recorded. The documentation itself clarifies that this is not a universal exclusion, saying so in the same sentence.
⚠ Eight of these ten are already named in an earlier article on this site. Chapter 8 of AWS VPC Network Troubleshooting Guide carries them as the third of three causes for an empty result. What this article adds is all ten in the original wording, and, in the next section, one covering measure per item. Copy the list in a shortened form and the reader is left with no grounds for whatever did not make the cut.
6.3 Each Negative, and What Covers It
The ten items above, together with the negatives the other sources carry, are set out here with what covers each one.| Not Recorded | Which Source | What Covers It |
|---|---|---|
| Communication destined for Amazon DNS servers | VPC Flow Logs | Route 53 Resolver query logging. This pair is particularly effective. Names resolved within a VPC will appear in query logs, not flow logs. |
| Communication between a VPC endpoint's network interface and a Network Load Balancer's network interface | VPC Flow Logs | CloudTrail network activity events, for the AWS services on their supported list. These record API calls that pass through the endpoint, and the endpoint owner is the one who enables them. Chapter 7 of the first article in this series holds them. |
| Original traffic of a mirroring configuration | VPC Flow Logs | The destination traffic of the mirroring configuration is recorded. The documentation states this on the same line. |
| DNS queries answered from a cache | Route 53 Resolver query logging | The response was returned, indicating that the name resolution itself was successful. Interpret this considering the TTL. It does not give you a count. |
| Many of the queries | Route 53 public DNS query logging | CloudWatch metrics. The total number of DNS queries to public hosted zones can be obtained through metrics. |
| Communication passing through a Network Load Balancer without a TLS listener | Network Load Balancer access logs | VPC Flow Logs. The Network Load Balancer's network interface is also a target for flow logs. |
| Requests with a header total exceeding 20 KB or a URL exceeding 8192 bytes | CloudFront standard logging | AWS WAF web ACL logs. This records requests that were inspected, so even if CloudFront failed to parse it, it may still remain. You can also see the number of errors through CloudWatch metrics. |
| Communication completed solely by a stateless engine | AWS Network Firewall | CloudWatch metrics. The same page states that metrics carry information for both the stateless and the stateful engine types. |
The value of clientAsn. It is not recorded unless the ASN match condition is used. | AWS WAF web ACL logs | Put an ASN match condition in a rule and it is recorded. The documentation explicitly states that otherwise, it is not recorded. |
| Labels exceeding one hundred | AWS WAF web ACL logs | The first hundred are recorded. Terminated rules remain under the terminatingRule section, so the basis for the decision itself is not lost. |
| The fact that a field not being inspected exceeded its limit | AWS WAF web ACL logs | Make that field the target of inspection. oversizeFields only shows fields that were inspected; if it was not inspected, even if it exceeded the limit, it will not appear in the list. |
| The contents of fields that were redacted | AWS WAF web ACL logs | It does not affect request sampling. The documentation explicitly states this. ⚠ Only the URI path, query string, single header, and HTTP method can be redacted, and the logs will show REDACTED. |
| Multicast traffic | Transit Gateway Flow Logs | There is no mechanism to record this. The documentation states that it is not supported. A record of it would have answered the question of which attachment multicast traffic reached. |
| Connect attachments | Transit Gateway Flow Logs | The attachment on the transport side is recorded. The documentation explicitly states that you must enable this on either the Transit Gateway or the transport attachment. |
| Communication between a client and service that is not associated with its service network | VPC Lattice access logs | The access logs for the actual service network that the communication is traversing. The API reference states that a single line in the access logs represents traffic originating from a VPC associated with that network. Visibility is limited to the owner of each network. |
The confirmation date is September 23, 2026.
The first row of this table is the most frequently used. No amount of work on the flow logs will tell you who inside the VPC looked up which name. The assumption that DNS records should be present because flow logging is enabled is fundamentally flawed.
Route 53 Resolver query logging records four types of queries.
* Queries that originate in Amazon Virtual Private Cloud VPCs that you specify, as well as the responses to those
  DNS queries.
* Queries from on-premises resources that use an inbound Resolver endpoint.
* Queries that use an outbound Resolver endpoint for recursive DNS resolution.
* Queries that use Resolver DNS Firewall rules to block, allow, or monitor domain lists.
However, there are limitations to this data source. Responses from the cache are not recorded.
VPC Resolver query logging logs only unique queries, not queries that VPC Resolver is
able to respond to from the cache.
Regardless of how many times the same name is queried within a TTL, it is only recorded once. In the example the documentation gives, the same network interface asks for the same name a second time, and that second query is not recorded. Therefore, if you count the occurrences based on this data source, the count can come out lower than the real number. It tells you whether a name was asked for. It does not tell you how many times.
6.4 Writing Down That It Cannot Be Counted
Public DNS query logging has a more significant caveat.Query logs might not capture every DNS query. The number of logged queries depends on how many
queries are submitted for a domain name (example.com) or subdomain name (www.example.com), which
resolvers your users use, and the TTL for the record. In some cases, logs contain only one query
out of every several thousand.AWS states outright that in some cases only one query in several thousand is logged. This is not a sampling setting, but rather a characteristic of the DNS system itself. If the resolver caches a response, a query does not reach Route 53 until the TTL expires.
This source will not tell you how many times a domain was reached. The same page says to use CloudWatch metrics when the count is what you need.
A similar disclaimer also exists for Elastic Load Balancing. Both the Application Load Balancer and the Network Load Balancer contain the same sentence.
Elastic Load Balancing logs requests on a best-effort basis. We recommend that you use access
logs to understand the nature of the requests, not as a complete accounting of
all requests.
It states that this feature should be used to understand the nature of requests, but not as a means of creating a complete record of every request. The discrepancy between the number of accesses in the access logs and the number of requests reported by the load balancer's metrics is due to this characteristic.
The AWS WAF developer guide elaborates on this point further.
On rare occasions, it's possible for AWS WAF log delivery to fall below 100%, with logs
delivered on a best effort basis. The AWS WAF architecture prioritizes the security of your
applications over all other considerations. In some situations, such as when logging flows
experience traffic throttling, this can result in records being dropped. This shouldn't
affect more than a few records.
What sets it apart is that it explains the reasons for these omissions. The design puts protecting the application ahead of delivering the log, so when the logging flow backs up it is the record that gets dropped. The same documentation advises contacting support if you experience more than a few instances of data loss. In other words, losing a few is inside what AWS expects.
That brings the count to three sources whose documentation states outright that records can be lost. These are the access logs for Elastic Load Balancing, the web ACL logs for AWS WAF, and the dropped records in VPC Flow Logs, which the last section of this chapter takes up. Although the explanations for these potential losses differ, the conclusion is the same: the absence of a record cannot be used as evidence that a communication did not occur.
However, there is a contrasting statement for Application Load Balancers. Unsuccessful requests are recorded.
Elastic Load Balancing logs requests sent to the load balancer, including requests that never made
it to the targets.
You cannot say that a record is missing because the request never reached a target. A malformed request is recorded, and so is a request that arrived when no healthy target existed.
6.5 Writing Down That Nothing Covers It
In the table from the previous section, one item was noted as lacking a logging mechanism: multicast traffic for Transit Gateway Flow Logs. On top of that, seven of the ten items VPC Flow Logs does not capture have no substitute that this article could find among the sources AWS provides. They are Windows license activation traffic, communication destined for instance metadata, communication destined for the Amazon Time Sync Service, DHCP traffic, ARP traffic, communication destined for the default VPC router, and communication on short-lived regional NAT gateways that expire within minutes.This article will not offer alternative logging sources for these items, as it found none. Instead, two points should be noted.
First, what this traffic is for. Five of the seven items relate to fundamental infrastructure services that the VPC implements for its users, providing functions such as license activation, address allocation, time synchronization, address resolution, and routing. In these five cases, it is unlikely that the line an investigation is looking for will be found within this layer. The questions of who did what and where are occurring above this layer. However, the remaining two items, communication destined for instance metadata and traffic on short-lived regional NAT gateways, could be the very traffic that an investigation is seeking. The former could answer the question of whether metadata (including credentials) was retrieved from the instance, while the latter could answer the question of where a workload communicated through that gateway. Because this article could not identify a log source for these two, it only notes that they are exceptions, along with the questions they would answer.
Second, when the content of the packets is required, what options are available? VPC Traffic Mirroring is a mechanism that duplicates packets directly from a network interface, serving as a complement to flow logs. However, it is not a logging source itself. You must provide your own destination to receive the duplicated packets and perform analysis there. And, as listed above, the original traffic being duplicated will not appear in the flow logs. What does appear is the mirror target side.
6.6 Two States Where a Record Appears With Nothing in It
Apart from the negatives, VPC Flow Logs has two states where a record does appear and carries nothing. Thelog-status field can take two values.The first is
NODATA, indicating that there was no data within the aggregation interval. This is a normal state. It simply means there was no communication.The second value is more problematic; it's called
SKIPDATA.VPC Flow Logs skips records when it can't capture flow log data during an
aggregation interval because it exceeds internal capacity. A single skipped record
can represent multiple flows that were not captured for the network interface during
the aggregation interval.When the internal capacity is exceeded, data loss can occur. A single
SKIPDATA entry may represent multiple flows. So the record does not say how many were lost.Without knowing this value, you might incorrectly conclude that there was no communication. While a
NODATA entry genuinely indicates the absence of communication during a specific time interval, a SKIPDATA entry provides no definitive answer. The two have to be told apart before anything is concluded from an absence.⚠ These two values are also covered by an earlier article on this site. Chapter 8 of the AWS VPC Network Troubleshooting Guide lists this as one of three potential causes when results are empty. That article treats it as one step inside a procedure; this one treats it as a property of the source. Same value, different place for the reader to be standing.
7. When the Same Event Reaches Two Sources, Which One Is Authoritative
Everything so far has dealt with the case where no record exists at all. This chapter deals with the opposite case, where several records exist and disagree with each other.7.1 One Request Reaches Three Sources
Consider an architecture where a request flows from the viewer to CloudFront, then to an Application Load Balancer, and finally to the target. That one request can leave a record in at least three places. These include CloudFront's standard logging, AWS WAF logs (if a web ACL is associated with CloudFront), and the Application Load Balancer's access logs.All three records point at the same event, and they do not say the same thing about it. The client's IP address is often the most significant point of discrepancy.
7.2 The Client IP Address Points at Something Different in Each Source
The fourth field in the Application Load Balancer access logs isclient:port, and its description contains specific conditions.client:port (4) | The IP address and port of the requesting client. If there is a proxy in
front of the load balancer, this field contains the IP address of the proxy.If a proxy is present in front, this field will display the proxy's IP address. In configurations where an Application Load Balancer is placed behind CloudFront, the
client:port field will contain CloudFront's address, not the viewer's address.CloudFront carries a condition of the same shape. It sits on the
c-ip field of standard logging.The IP address of the viewer that made the request... If the
viewer used an HTTP proxy or a load balancer to send the request, the value of this
field is the IP address of the proxy or load balancer. See also the x-forwarded-for field.Both fields write down the hop immediately in front of themselves. As records, both are correct. What differs is where each one is looking from.
Both documents point at the same remedy: the
X-Forwarded-For header. The Application Load Balancer, by default, includes the client's IP address in this header, and appends it if the header already exists. CloudFront has a field called x-forwarded-for.7.3 Which One to Treat as Authoritative
With that in place, the rule comes out as a single line: always identify the outermost source.| What You Want to Know | Which Source Is Authoritative | Why |
|---|---|---|
| The viewer's IP address | The outermost source. With CloudFront in front, that is CloudFront's c-ip. | An inner source writes down the hop immediately in front of itself. |
| Where the request stopped | The source one layer outside the layer where you suspect it stopped. | Inner sources lack the necessary records, making it impossible to determine why a record is missing. |
| What AWS WAF did | Logs from the AWS WAF web ACL. | These logs contain the final action taken and the rules that were matched. |
| Which resources the request passed through | The httpSourceName and httpSourceId from the AWS WAF web ACL logs. | These logs indicate which resources the web ACL was associated with. |
| How many bytes were transmitted | The source at the flow level. | At the request level, connection reuse and compression change what the number means. |
⚠ There is one exception to this rule. As Chapter 6 sets out, VPC Flow Logs do not record traffic between a VPC endpoint's network interface and a Network Load Balancer's network interface. Over that segment it is the outer source that has no record. Rather than moving inward, you move to the identity and control plane side: CloudTrail network activity events, for the AWS services on their supported list.
8. Delivery Delay - Not Here Yet Is Not the Same as Never Coming
Chapter 6 dealt with what does not appear even once logging is on. This chapter deals with what does appear but has not arrived yet. Mistake one for the other and you report a state that waiting would have fixed as a state that waiting will not fix.8.1 How Long to Wait
One of the most common errors in the field is to conclude that records are missing when they simply haven't arrived yet. Delivery delay differs by source, and the spread runs from minutes to hours.| Source | Official Stated Delivery Delay | Primary Documentation |
|---|---|---|
| VPC Flow Logs | Approximately 5 minutes to Amazon CloudWatch Logs, and approximately 10 minutes to Amazon S3. However, this is a best-effort delivery, and delays can occur. | Flow log records |
| Transit Gateway Flow Logs | Several minutes pass between creation and the start of collection and delivery. This is not a real-time stream. | AWS Transit Gateway Flow Logs |
| Application Load Balancer / Network Load Balancer Access Logs | Delivered in batches every 5 minutes per node. Delivery is eventually consistent. | Access logs for your Application Load Balancer |
| CloudFront Standard Logging | Several times per hour. Typically delivered within an hour, but a portion or all of the logs may be delayed by up to 24 hours. | Standard logging reference |
| AWS Network Firewall | Average delivery time of 3 to 6 minutes to Amazon CloudWatch Logs and Amazon Data Firehose, and 8 to 12 minutes to Amazon S3. | Timing of AWS Network Firewall log delivery |
| VPC Lattice Access Logs | Approximately 2 minutes to Amazon CloudWatch Logs and Amazon Data Firehose, and approximately 6 minutes to Amazon S3. All deliveries are best-effort. | Access logs for Amazon VPC Lattice |
The confirmation date is September 23, 2026.
The 24 hours on CloudFront stands out. The official documentation states:
CloudFront delivers logs for a distribution up to several times an hour. In general, a log
file contains information about the requests that CloudFront received during a given time
period. CloudFront usually delivers the log file for that time period to your destination
within an hour of the events that appear in the log. Note, however, that some or all log
file entries for a time period can sometimes be delayed by up to 24 hours.
A record that arrives late is filed under the time the event occurred, not the time it was delivered. The same page says so in the next sentence. It is normal for lines that were not present when checked yesterday to appear in the same file today.
The same property runs across sources. The AWS Network Firewall documentation words it the same way: a delayed log is written under the date and time of the period in which the requests occurred. A file is not final at the moment you first open it.
8.2 Do Not Trust It Right After You Turn It On
CloudFront also includes a note regarding the period immediately after activation.CloudFront begins to reliably deliver access logs about four hours after you enable logging.
You might get a few access logs before that time.It takes approximately four hours for reliable delivery to begin. Some content may be delivered before that, but not everything. If you enable it after an incident and attempt to determine whether logs exist during the few hours immediately following, you will inevitably make mistakes.
A similar caution applies to VPC Flow Logs. Even after creating a flow log, you will not see any data until actual traffic flows to the selected resources. The time when settings are applied and when logging begins are separate events.
8.3 What It Takes to Say Something Is Absent
In summary, verifying non-existence involves three stages.First, wait out the delivery delay of that source. The middle column of the table above is the shortest you should wait. For CloudFront, this might be a value of up to 24 hours.
Second, check the
log-status. If using VPC Flow Logs, verify whether the status is NODATA or SKIPDATA. If it is SKIPDATA, you cannot definitively state that the data did not exist.Third, confirm whether the source actually records that specific communication. The table in Chapter 6 addresses this. Only by examining all three of these factors can you confidently conclude that the data did not exist. If even one of these checks is missing, it does not provide sufficient grounds to claim non-existence.
9. What This Inventory Does Not Cover
An inventory is defined as much by what it leaves out as by what it holds. This chapter sets out those exclusions, and the date it was measured.9.1 What Was Not Measured
The tables in this article present four questions regarding sixteen different sources. Here is what was left out on purpose.This article does not carry a list of fields. Each source gains new fields with every version update. VPC Flow Logs, for example, have a default format of version 2, and fields for ECS,
encryption-status, Amazon EC2 tags, and the next hop have been progressively added. A hand-built list of every field starts falling behind the day it is published, so this article does not build one. For the fields of a given service, go to that service's own field list.Nor does it carry regional availability. The reason is the same.
It does not address pricing or stored volume. While your destination choice directly impacts these two factors, this article only answers the questions of whether logs are generated and where they can be sent.
It does not address encryption of the logs at rest. Protection on the destination side belongs to Encryption Controls by Service on AWS Storage, which holds encryption at rest.
9.2 Questions This Inventory Does Not Answer
It does not specify which sources to prioritize. That is a question determined by what needs to be protected and the available budget, and it sits outside the scope of this inventory.It does not provide answers about what can be learned from the records. While it addresses the meaning of individual lines, it does not determine what conclusions can be drawn from them; that belongs to detection and investigation.
It does not claim to be comprehensive. This article covers sixteen sources related to networking, but it does not state that these are all the records AWS publishes on the topic. As new services are introduced, additional sources will likely become available.
9.3 When This Was Measured
All the pages cited in this article were accessed and verified on September 23, 2026. Each row in the tables is based on the information contained in the relevant material on that day.One thing is worth recording here as unwritten. This article says nothing about whether AWS WAF records the request body. The developer guide's list of log fields carries no field for the body, but a field being absent from a list does not prove that the body goes unrecorded. Four differently worded searches for an explicit negative sentence turned up nothing. So this article does not say that it is not recorded. In its place, Chapter 6 carries three negatives that the same documentation does state outright. These limitations concern the
clientAsn condition, the limit of one hundred labels, and the fact that oversizeFields only lists the fields that were inspected.This one case is the article's own rule applied to itself. Simply because a piece of information is not written in the documentation does not mean that it is not recorded. Writing down that it could not be verified leaves the reader something they can work with.
10. Failure Modes
Here are seven ways the material above fails in practical use. All of these scenarios occur while the configuration screens appear to be functioning correctly.| # | Failure | Why it Occurs | How to Prevent |
|---|---|---|---|
| 1 | Reporting that traffic did not occur because it is not found in the access logs. | This assumes that the logs provide a complete record. | As Chapter 6 sets out, Elastic Load Balancing states outright that it logs on a best-effort basis. Do not use the absence of a log entry as definitive proof that nothing was sent. |
| 2 | Assuming that because VPC Flow Logs are enabled, they cover every DNS record inside the VPC. | The unit of enablement for flow logs is the VPC, which reads as though the VPC covers everything inside it. | Amazon DNS server traffic is not captured. Enable Route 53 Resolver query logging separately. |
| 3 | Despite enabling Network Load Balancer access logs, no data is appearing. | The condition that a TLS listener must be present is not readily apparent from the configuration screen. | No logs are created unless a TLS listener is present. Check using VPC Flow Logs instead. |
| 4 | Assuming that because a setting appears disabled on the configuration screen, no logs are being collected. | Legacy settings and CloudWatch Logs settings are located on separate tabs. | Check both "Attributes" and "Integrations." You cannot determine the status based on only one of these. |
| 5 | Assuming that the configuration is incorrect because no logs appear immediately after enabling logging. | The completion of the configuration and the start of data delivery occur at different times. | CloudFront takes about four hours before it delivers access logs reliably. Wait out the table in Chapter 8 before judging. |
| 6 | The Application Load Balancer access logs' client:port is reported as the viewer's IP address. | The column name "client" can be misleading. | If CloudFront is present in front of the load balancer, that IP address will appear. Look for the outermost source or the X-Forwarded-For header. |
| 7 | Concluding that no communication occurred because there are no logs for a specific time. | The log-status value is not being read. | Distinguish between NODATA and SKIPDATA. If the status is SKIPDATA, you cannot draw any conclusions. |
Scenarios two through seven are those that would likely go unnoticed unless you carefully review the documentation. All of these are based on negated statements or statements with conditions, and they do not appear on screens that are otherwise functioning correctly.
11. Frequently Asked Questions
This section addresses common questions that may arise when using the content presented in this article.If VPC Flow Logs are on, is the network record complete?
No, it does not capture everything. There are ten types of traffic that flow logs do not capture, and the most useful of these in practical terms is traffic to the Amazon DNS server. If you want to track names resolved within your VPC, you will need to enable Route 53 Resolver query logging separately.Is any network log source on by default?
No. None of the sixteen sources in this article records anything until you enable it, or create the log configuration itself. This is a significant difference from Identity and Control Plane, where CloudTrail management events are recorded by default. The documentation clearly states that Elastic Load Balancing and VPC Lattice are disabled by default; for all other services, there are simply procedures to enable logging.Is standard logging (legacy) being discontinued?
No. While the user guide mentions "previous version," there has been no announcement regarding its discontinuation. Enabling standard logging (v2) does nothing to standard logging (legacy), and both can run at once. However, the official documentation recommends using a separate bucket or path if you intend to send data from both to Amazon S3.Can public DNS query logging count accesses to a domain?
No. It is not possible to count them. AWS states that in some cases only one query in several thousand is logged. A query does not reach Route 53 while a resolver still holds the answer in cache. If you need the count, use CloudWatch metrics.Does Route 53 Resolver query logging record every DNS query?
No. Queries that are answered from the cache are not logged. Even if the same name is asked for several times inside its TTL, it is recorded once. It tells you whether a name was asked for. It does not tell you how many times.Do Application Load Balancer and Network Load Balancer access logs hold the same thing?
No. They are different. An Application Load Balancer logs each request, while a Network Load Balancer logs each TLS connection. Furthermore, access logs are only generated by a Network Load Balancer when it has a TLS listener.Does enabling AWS Network Firewall logging retain everything that passes through?
No. Not all traffic is logged. Logs come out only for traffic the policy forwards to the stateful engine. Traffic that the stateless engine finishes with produces none. The metrics carry information about that range.The same request shows two different client IP addresses. Which one is correct?
Both are correct. This is because each source is reporting the IP address of the hop immediately preceding it, from its perspective. To get the viewer's IP address, read the outermost source, or read theX-Forwarded-For header.Can the absence of a log be used as evidence that nothing was sent?
Only when three conditions hold. First, you waited out the delivery delay of that source. Second, thelog-status must not be SKIPDATA. And third, the documentation must state that the source records that type of communication. If even one of these conditions is not met, it cannot be considered valid evidence.Can web ACL logs be sent to an existing destination bucket?
Depending on the name, it may not be possible. An AWS WAF destination must have a name that begins withaws-waf-logs-. Furthermore, only one destination can be configured per web ACL.12. Summary
The network log sources have been lined up so that each one can be looked up by four questions. Five points come out of it.First, not one source emits anything by default. None of the sixteen sources in this article records anything until it is enabled, or the log configuration itself is created. What can be investigated afterward is settled entirely by what was on before the incident.
Second, the unit of a record splits five ways. A source whose line stands for a flow sits alongside one whose line stands for a DNS query, one whose line stands for a request, one whose line stands for a connection, and one whose line stands for a health check result. If the granularity you are looking for does not exist within a particular log source, no matter how thoroughly you analyze it, you will not find an answer.
Third, what is not recorded has an explicit sentence behind it in a primary source. The ten items in VPC Flow Logs, the TLS listener condition on Network Load Balancer, the Resolver cache, the one query in several thousand on public DNS query logging, and the stateless engine in AWS Network Firewall. These are not issues of configuration; they are inherent limitations of the log sources themselves. For many of these, there are ways to supplement the data. A particularly effective solution is using Route 53 Resolver query logging to fill in gaps in flow logs.
Fourth, when the same event lands in several sources, a disagreement between them is not an error. Each source is simply recording the hop immediately preceding it, from its own perspective. Treat the outermost source as authoritative.
Fifth, to confidently state that something did not happen, three conditions must be met. First, you must have waited longer than the delivery latency. Second, the
log-status must not indicate any missed events. Third, the documentation for that source must state that it records that specific type of communication. Any claim of absence that fails to meet all three of these conditions is not supported by evidence.This article concludes at the point of data collection. How to best organize the collected data is detailed in Centralized Logging and Audit Architecture on AWS, how to query the collected data is explained in CloudWatch Logs Insights Query Cookbook, and Detection Engineering on AWS holds how to build a detection on top of it. Finally, information regarding who performed what actions can be found in Where the Logs Come From on AWS - Identity and the Control Plane.
13. References
- Logging IP traffic using VPC Flow Logs - Amazon VPC User Guide
- Flow logs basics - Amazon VPC User Guide
- Flow log records - Amazon VPC User Guide
- Flow log limitations - Amazon VPC User Guide
- Flow log record examples - Amazon VPC User Guide
- AWS Transit Gateway Flow Logs - Amazon VPC Transit Gateways
- What is Traffic Mirroring? - Amazon VPC
- Resolver query logging - Amazon Route 53 Developer Guide
- Managing Resolver query logging configurations - Amazon Route 53 Developer Guide
- Public DNS query logging - Amazon Route 53 Developer Guide
- Access logs for your Application Load Balancer - Elastic Load Balancing
- Connection logs for your Application Load Balancer - Elastic Load Balancing
- Health check logs - Elastic Load Balancing
- CloudWatch Logs for your Application Load Balancer - Elastic Load Balancing
- HTTP headers and Application Load Balancers - Elastic Load Balancing
- Access logs for your Network Load Balancer - Elastic Load Balancing
- CloudWatch logs for your Network Load Balancer - Elastic Load Balancing
- Configure standard logging (v2) - Amazon CloudFront Developer Guide
- Configure standard logging (legacy) - Amazon CloudFront Developer Guide
- Standard logging reference - Amazon CloudFront Developer Guide
- Real-time logs - Amazon CloudFront Developer Guide
- Distribution settings - Amazon CloudFront Developer Guide
- Logging web ACL traffic - AWS WAF Developer Guide
- Log fields for web ACL traffic - AWS WAF Developer Guide
- Finding your web ACL records - AWS WAF Developer Guide
- PutLoggingConfiguration - AWS WAF API Reference
- Logging network traffic from AWS Network Firewall - AWS Network Firewall Developer Guide
- Timing of AWS Network Firewall log delivery - AWS Network Firewall Developer Guide
- Access logs for Amazon VPC Lattice - Amazon VPC Lattice User Guide
- Where the Logs Come From on AWS - Identity and the Control Plane, What Is On by Default, and What Is Not Recorded at All
- Centralized Logging and Audit Architecture on AWS - Multi-Account Log Aggregation, Detection, and Query with CloudTrail, Config, Security Hub, and OpenSearch
- AWS VPC Network Troubleshooting Guide - Decision Trees for Security Groups, NACLs, Route Tables, and Flow Logs
- Detection Engineering on AWS - What a Custom Source Must Satisfy Before a Detection Can Be Written, and What the Detection Still Does Not See
- Amazon Route 53 DNS Architecture Guide - Routing Policies, Resolver, Private Hosted Zones, and Hybrid DNS
- AWS Networking Glossary - VPC, Transit Gateway, PrivateLink, and VPC Lattice Explained
- AWS History and Timeline regarding Amazon VPC - Overview, Functions, Features, Summary of Updates, and Introduction
- CloudWatch Logs Insights Query Cookbook: Practical Recipes for Incident Investigation, Cost Analysis, and Security Audits
- Encryption Controls by Service on AWS Storage - What Is On by Default, Which Key You Can Choose, and What Turning It On Does Not Re-encrypt
References:
Tech Blog with curated related content
Written by Hidekazu Konishi