What Decides How Much a CloudWatch Logs Insights Query Scans - What You Choose, What CloudWatch Logs Indexes for You, What Can Change the Result, and Where Each Shows Up
First Published:
Last Updated:
When you then use a field index in a CloudWatch Logs Insights query, the query attempts to skip processing log events that are known to not include the indexed field. This reduces the scan volume of your queries that use field indexes, making it possible to return results faster.The user guide describes how queries attempt to skip processing log events that are known not to contain the indexed field. However, it does not say that the scan volume will be reduced in every query. Within
filter, indexes take effect only for queries that use the = or IN operator on a field that has an index (Section 5.1). Furthermore, some methods for reducing the scan volume can potentially alter the query results. filterIndex returns only indexed data, and the user guide says that with limit any N, the returned events may come from any portion of the time range. On September 29, 2026, CloudWatch Logs introduced a feature that automatically indexes fields based on user queries. The user guide recommends using filter rather than filterIndex for fields that have been automatically indexed.We recommend that you use filter instead of filterIndex with automatically indexed fields.The user guide gives reasons for this recommendation, including that CloudWatch Logs can update or remove automatically indexed fields and that
filterIndex returns only indexed data (Section 6.4). The user guide's page on automatically indexed fields does not explicitly state how automatic indexing changes the scan of filter queries.This article divides the factors that determine the amount of data scanned by CloudWatch Logs Insights queries into two categories: those selected by the user, and those determined by CloudWatch Logs itself. It then outlines three kinds of means for reducing the scan volume, following the wording of the sources: first, selecting the query target (time range and the choice of log group and log class); second, having the query attempt to skip processing by using an index (
= and IN with filter); and third, using shortcuts that can alter the results (filterIndex and limit any N). Regarding the second method, the user guide's filter page and overview page do not mention the impact on query results. Finally, the article lists where the scan volume can be observed – before query execution (estimate) and after query execution (within GetQueryResults under statistics) – and where the index state can be viewed (e.g., using DescribeFieldIndexes). The information is based on the CloudWatch Logs user guide, the CloudWatch Logs API reference, the AWS CLI reference, the botocore model, and What's New, checked on October 11, 2026. In addition, six queries were each run once on a single log group created for verification (Section 7.4). This article is neither an introduction to field indexes nor a guide to writing queries. It does not address pricing.Related articles on this site:
- Where AWS Publishes Version End Dates - The AWS Health Version Catalog, DescribeServiceLifecycle, and the Calendars of RDS, Aurora, EKS, Lambda, OpenSearch Service, and ElastiCache
- How Amazon Aurora serverless Decides Its Capacity - What You Set, What Aurora Decides Within Your Range, What the Maximum ACU Fixes, and Where Each Shows Up
- CloudWatch Logs Insights Query Cookbook: Practical Recipes for Incident Investigation, Cost Analysis, and Security Audits
- AWS History and Timeline regarding Amazon CloudWatch - Overview, Functions, Features, Summary of Updates, and Introduction
- AWS Observability Glossary - CloudWatch, X-Ray, Application Signals, and OpenTelemetry Explained
- AWS Observability Architecture Guide - End-to-End Tracing, Metrics, and Logs with CloudWatch, X-Ray, Application Signals, and OpenTelemetry
- Centralized Logging and Audit Architecture on AWS - Multi-Account Log Aggregation, Detection, and Query with CloudTrail, Config, Security Hub, and OpenSearch
- Where the Logs Come From on AWS - The Network, What Each Source Actually Records, and Which Traffic Never Appears in Any of Them
- Amazon CloudWatch Omni and CloudWatch - What Stays in CloudWatch, What Omni Adds With Domains, Spaces, and Grants, and Where Each Setting Is Configured
Table of Contents
- 1. What Scan Volume Means, and What This Article Covers
- 2. How to Read the Tables — Who Decides, Where You Can See It, and Whether the Result Can Change
- 3. What Affects the Scan Volume
- 4. Index Rules
- 5. filter and filterIndex, limit and limit any
- 6. Automatically Indexed Fields (September 29, 2026)
- 7. Where the Scan Volume and the Index State Show Up
- 8. Where the Sources Disagree and Where No Statement Was Found
- 9. Frequently Asked Questions about CloudWatch Logs Insights Scan Volume
- 10. Summary
- 11. References
1. What Scan Volume Means, and What This Article Covers
This section will first clarify what is meant by "scan volume" in this article, and outline the assumption that indexing reduces scan volume, while also indicating the extent to which this is documented in the sources. It then defines how names are handled, delineates the scope of this article, specifies the date checked and the sources read, and establishes the terminology used throughout this article.1.1 Scan Volume and What Indexes Reduce
In this article, "scan volume" refers to the scan volume described in the user guide. It is the amount of log events that a query reads. The figures you can see are bytes (estimate before execution, and bytesScanned after execution) and the number of log events (represented by recordsScanned after execution) (see Section 7).Scan volume is related to the time it takes for a query to return results. As mentioned earlier, the user guide states that indexes reduce the scan volume of queries that use them, allowing for faster results. The
GetQueryResults API reference specifies the maximum execution time for a query and the associated considerations.Queries time out after 60 minutes of runtime. To avoid having your queries time out, reduce the time range being searched or partition your query into a number of queries.The benefit of using indexes to reduce scan volume is conditional. The user guide's filter page limits the queries that benefit from indexes to those using
= and IN operators, stating that the like operator does not utilize indexes (see Section 5.1). Regarding index policies, the user guide clarifies that CloudWatch Logs only indexes log events ingested after the policy is created (see Section 4.3). Only log groups with the Standard log class can have index policies, and indexes apply only to the structured log formats of JSON and service logs (see Section 4.4). Therefore, this article does not generalize by stating that "creating an index always reduces scan volume."The user guide's filter and overview pages do not describe what happens to the results when the query attempts to skip processing by using an index. However, regarding
filterIndex and limit any N, the user guide explains that filterIndex limits the scope of the returned results (to only indexed data, and only results from after the index was created) and that, with limit any N, the returned events can come from any portion of the time range, without any guaranteed order (see Sections 5.2 and 5.5). This article will present these differences using a table format (see Section 2.4).1.2 Naming — Log Analytics, CloudWatch Logs Insights, Logs Insights QL
On June 15, 2026, Log Analytics was added to the CloudWatch console (What's New 2026-06-15). The user guide's Analyzing log data with CloudWatch Log Analytics page describes Log Analytics as a console experience that encompasses CloudWatch Logs Insights, Live Tail, and Contributor Insights, and designates it as the console's default experience.Log Analytics is the default experience for analyzing logs in the CloudWatch Logs console.While the name of the query functionality remains CloudWatch Logs Insights in both the user guide and the API reference, there are three query languages. The user guide refers to CloudWatch Logs Insights's own language as Logs Insights QL. The other two are OpenSearch Piped Processing Language (PPL) and OpenSearch Structured Query Language (SQL). In this article, the functionality is referred to as CloudWatch Logs Insights (shortened to Logs Insights), while the languages are referred to as Logs Insights QL, PPL, and SQL. Unless otherwise stated, the query syntax discussed in this article refers to Logs Insights QL.
The title of the first page in the user guide's chapter on field indexes, as of the date this article was checked, is "Create field indexes to improve query performance and reduce scan volume." The text string linking from the
PutIndexPolicy and PutAccountPolicy API references to this page uses a different title. This article uses the former title as the page title (Section 8.1).1.3 What This Article Covers, and What It Doesn't
This article focuses on four key areas:- Who decides each item: Whether the user chooses what affects the scan volume, or CloudWatch Logs decides it.
- Scan and result for each means: For each means of reducing scan volume, what the sources say about the scan and what they say about the result.
- Visibility: Where scan volume and the index state can be observed – before query execution, in the index state, and after execution.
- Disagreements and Statements Not Found: This covers instances where the sources say different things, and statements that were not found despite searching.
The following topics are covered in other articles on this website. This article will briefly mention them with a single sentence and a link.
- Query Examples: CloudWatch Logs Insights Query Cookbook collects example queries for use in investigations. The "Index the fields you filter on" section of that article addresses field indexing, which was added in November 2024. This article will focus solely on explaining what determines query scan volume, without recreating the example queries.
- Feature Release Date: AWS History and Timeline regarding Amazon CloudWatch includes an entry for the November 21, 2024 announcement of field indexing. This article will only list the dates of announcements necessary to explain the functionality.
- Terminology: AWS Observability Glossary contains terminology related to CloudWatch Logs Insights.
- Observability and Log Aggregation Design: AWS Observability Architecture Guide and Centralized Logging and Audit Architecture on AWS address where logs are collected and how they are queried. This article will not compare Logs Insights with other query platforms.
- Log Sources: Where the Logs Come From on AWS - The Network discusses what network logs record. This article lists data source names (e.g.,
amazon_vpc.flow) only as far as they appear in the default index list. - CloudWatch Omni: Amazon CloudWatch Omni and CloudWatch covers this topic. The article notes that AWS lists Logs Insights queries as remaining unchanged with the activation of Omni. This article will not address Omni.
The columns and values in the tables for this article are based on those found on this site in Where AWS Publishes Version End Dates and How Amazon Aurora serverless Decides Its Capacity. Values added or redefined in this article are described in Section 2. This article will not discuss the topics covered in those two articles (version end dates and Aurora serverless capacity).
This article does not cover pricing, the merits of Logs Insights against other query platforms, or which fields to index. Recommendations in the user guide are quoted as AWS recommendations, with their source.
1.4 When This Article Was Checked, and the Sources It Read
This information was verified on October 11, 2026 (UTC). The sources read are as follows:- CloudWatch Logs User Guide: The seven pages of the field index chapter (Create field indexes to improve query performance and reduce scan volume, Automatically indexed fields, Field index syntax and quotas, Create an account-level field index policy, Create a log-group level field index policy, Log group selection options when creating a query, Effects of deleting a field index policy). The query syntax pages (CloudWatch Logs Insights language query syntax, filter, filterIndex, estimate, limit, SOURCE). Analyzing log data with CloudWatch Logs Insights, Supported query languages, OpenSearch Piped Processing Language (PPL), OpenSearch Structured Query Language (SQL), Log classes, Logs Insights QL commands supported in log classes, Analyzing log data with CloudWatch Log Analytics, Use facets to group and explore logs, Intelligent tiering, CloudWatch Logs quotas, Document history.
- API and Models: CloudWatch Logs API reference (
PutIndexPolicy,DescribeIndexPolicies,DescribeFieldIndexes,DeleteIndexPolicy,PutAccountPolicy,DescribeAccountPolicies,DeleteAccountPolicy,AccountPolicy,FieldIndex,IndexPolicy,QueryStatistics,GetQueryResults,StartQuery,DescribeQueries,QueryInfo,GetLogGroupFields,LogGroup,CreateLogGroup,DescribeLogGroups). AWS CLI 2.37.12 reference:start-query,get-query-results,describe-field-indexes,put-index-policy,describe-index-policies,put-account-policy. CloudWatch Logs models for botocore 1.43.111 (published on PyPI: 2026-10-09). - Announcements: What's New (2024-11-21: field indexes, 2026-06-08: addition of commands including
limit any N, 2026-06-15: Log Analytics, 2026-07-15: intelligent tiering, 2026-09-29: two entries (automatic indexing andestimate)). - Search: This article also used the AWS documentation search (aws-knowledge MCP) to confirm that statements were not found.
- Actions Performed and Verified: On October 11, 2026 (UTC), in the us-east-1 region, this article used AWS CLI 2.37.12 to run each query once and call the APIs (
DescribeFieldIndexestwice, with and withoutindexCategories) on a single Standard log group that was created for verification purposes. The log group had a log group-level index policy configured forrequestId, and then 200 JSON log events were added. Six queries were run, in addition to callingDescribeFieldIndexesandDescribeIndexPolicies. Results are described in Section 7.4. This was a single run on a small log group, and this article does not generalize these results to other conditions.
1.5 Words with the Same Spelling, Different Meanings
This article deals with words that share the same spelling but refer to different things, and distinguishes them as follows.- Index: The index in this article refers to the field index within CloudWatch Logs. It is divided into three categories: default index (the fields that CloudWatch Logs indexes by default), policy index (fields specified by the user through the field index policy), and automatic index (fields indexed by CloudWatch Logs based on user queries). Facets, created using the same policy, offer another way to view data distribution within the console, but are not covered in this article. This is distinct from database indexes.
- Estimate: The
estimatecommand returns an estimate of the number of bytes that will be scanned without actually executing the query (see Section 7.1).statisticsincludesestimatedBytesSkippedandestimatedRecordsSkipped, which represent estimates of the amount of data skipped by the executed query using indexes (see Section 7.3). While the names are similar, they represent different concepts. - Scan:
bytesScannedrepresents the number of bytes scanned,recordsScannedrepresents the number of log events scanned, andlogGroupsScannedrepresents the number of log groups scanned. - Source: The
SOURCEcommand is used to select log groups within a query. The data source refers to the type of log (e.g.,amazon_vpc.flow).@source.logis the name of a field that is indexed by default. Thesourceof theIndexPolicyreturned byDescribeIndexPolicies(ACCOUNTorLOG_GROUP) indicates the level of the policy. This article calls the documents it relies on "the sources." - Infrequent Access: The Infrequent Access log class is selected when creating a log group, and it does not support index policies or
filterIndex(see Section 4.4). Within intelligent tiering, the Infrequent Access tier is a storage tier where data that has not been accessed for 30 days is moved. In this article, "Infrequent Access" refers to the log class unless otherwise specified. No statement about the relationship between the tier and indexes was found in the sources this article read (see Section 8.2). - Standard: The Standard log class and the Standard tier of intelligent tiering are separate. In this article, "Standard" refers to the log class unless otherwise specified.
- 30 Days: This article deals with four 30-day periods: the period for which each log event is indexed from ingestion under a policy index (see Section 4.3), the duration for which CloudWatch Logs retains automatically indexed fields (see Section 6.2), the period of up to 30 days during which indexed events continue to benefit from indexing even after the index policy is deleted (see Section 4.5), and the time period before data that has not been accessed is moved to the Infrequent Access tier within intelligent tiering. This article will explicitly state which "30-day" period is being referenced. The sources also mention other "30-day" periods, such as the duration for which facet values and data are retained, and the period for which accessed data returns to the Standard tier under intelligent tiering. However, these are not covered in this article.
2. How to Read the Tables — Who Decides, Where You Can See It, and Whether the Result Can Change
This section defines the columns and terms used in the tables in this article. The column names and values are the same as those used in Section 2 of this site's Where AWS Publishes Version End Dates, and any additions will be defined here.2.1 Common Columns
The tables that list what affects the scan volume share five common columns:Item: The value that is decided. Examples include the time range, the default index fields, or the log events the query attempts to skip.Decided By: This indicates who determines the value (see Section 2.2).What You Set: If the user can modify how this value is determined through configuration or queries, specify the name of the configuration or query element used. If the configuration is not found, writeNot found.Where You Can See It: This describes the type of location where the user can view this value, along with the specific name (see Section 2.3).Where the Source Says So: This provides the source document that supports the information in this row. A summary of the information is provided either in the cell or in the sentence following the table.
These five columns are present in the tables described in Sections 3.1 and 3.2. Other tables will have columns tailored to their specific content.
2.2 Decided By Values
The Decided By column should contain one of the following five options. The first four options correspond to values found in another article on this site, while the fifth option is a value specific to this article. In this article, AWS refers to CloudWatch Logs, a service offered by AWS.AWS: Determined by AWS. In this article, this indicates that the documentation specifies the value is determined by CloudWatch Logs, and that no setting that lets the user change this value was found in the sources this article read.You: Determined by the user.AWS, within your settings: Determined by AWS, but within the user's configured settings. In this article, this means that CloudWatch Logs determines the value, but within the user's selections (the query text, the time range, the log groups, and the index policies).The source does not say.: The documentation does not specify who determines the value.AWS, from your queries: Determined by AWS, based on the user's recent queries (equality filters using=orIN). In the sources this article read, no setting that lets the user configure this value was found. It separates out, fromAWS, the values for which the user's queries are the input.
2.3 Types of Where You Can See It
The Where You Can See It column begins with one of the following types. The first six types are the same as those used in another article on this site, while the seventh type has been added specifically for this article. This article does not use the CloudWatch metric or Not found types in this column. Not found is used in the What You Set column when a setting cannot be located. The term Documentation only has the same name as a term used in another article on this site, but its meaning has been redefined within this article.API field: Found in fields within API responses. Includes the operation name and field name.CloudWatch metric: Found in CloudWatch metrics.Query statistic: Found in query statistics (withinGetQueryResultsunder thestatisticssection). Includes the field name.Console: Found in the AWS Management Console.Documentation only: In the sources this article read, the value is only mentioned in the text of the documentation; it was not found in any API fields, query statistics, or console displays.Not found: In the sources this article read, the location where this value can be found could not be identified.Query result: Found in the values returned in response to a user's query. This type is used in this article only forestimate. While the user guide states thatestimatereturns a value without executing the query, the sources this article read did not identify any response fields that contain this value (see Section 7.1). In the response from the run on the verification date, the value was in the@estimatedBytesScannedfield within theresultssection (see Section 7.4).
Documentation only and Not found do not necessarily mean that an API or configuration is missing. The same applies to the Not found entries in the What You Set column. For the main items, the sources and terms searched are listed in Section 8.2.2.4 The Effect on the Result Column and the Scan Column
The table (Section 3.3) that lists methods for reducing scan volume includes the columns Effect on the Result and What the Source Says About the Scan. The What the Source Says About the Scan column contains what the sources say about the scan, in their own words. The Effect on the Result column will contain one of the following three options:Sets what is queried: Log events outside the range selected by the user (time range, log group, log class) will not be scanned or included in the results. Changing the selected range will change both the scan volume and the set of log events that contribute to the results. This is this article's framing; the sources' wording is, for example, "over the selected log groups and time range" (the estimate page).The source does not say.: The sources say that the query attempts to skip processing, but do not specify any impact on the results. For rows with this value, this article does not say whether the results change or stay the same.Can change the result: The documentation indicates that the method limits the scope of the returned results (for example, only indexed data) or does not guarantee the order of the returned results. This article uses the value to mean that the result can differ from that of a query of the same range withfilteror a regularlimit. The verbatim reasons are given in the text following the table and in Section 5.
2.5 Formatting Dates and Verification Dates
What's New dates should be written in the formatWhat's New YYYY-MM-DD, using the date from the announcement's postDateTime. Dates in the user guide's Document history may not always match What's New dates (see Section 8.1). This article uses What's New dates to indicate when features were added, and lists the Document history dates as disagreements. Statements from the user guide and the API reference pair the page title with the verification date, written as (checked 2026-10-11). In tables, this is added only to the first row of each table that uses the columns from Section 2. All verification dates in this article are October 11, 2026.2.6 When the Source Does Not Say, and When Sources Disagree
In the tables, only the information from the source (or a summary thereof) should be written in the cells. If the source does not provide information for a particular cell, writeThe source does not say.Before writing
The source does not say., this article searched the full text of the source document referenced in that row, as well as the linked page, and other pages from the same provider (including the seven pages in the field index chapter, the query syntax pages, the API reference, the CLI reference, the botocore models, the Document history, and What's New), using the subject of the row as well as the terms index, scan, skip, estimate, AUTO, disable, and result. If the source only describes general principles but does not specifically identify the subject of that row, this article does not write The source does not say. Instead, it writes the general principle and notes that the row's subject is not named.When sources disagree, this article lists both descriptions with their respective sources, without favoring either one. The disagreements in this article are summarized in Section 8.1.
3. What Affects the Scan Volume
This section outlines the factors that influence scan volume, dividing them into those selected by the user and those determined by CloudWatch Logs. Subsequently, it categorizes methods for reducing scan volume into three categories, and for each, it lists what the sources say about the scan and about the result.3.1 What the User Chooses
The user selects the query target (time range, log group, log class), the way to write the query, and the index policies.| Item | Decided By | What You Set | Where You Can See It | Where the Source Says So |
|---|---|---|---|---|
| Time Range | You | StartQuery's startTime and endTime. Console time range selection. | Console: Query editor. Its effect on the scan volume shows up in estimate and bytesScanned (Section 7). | estimate, StartQuery (checked 2026-10-11) |
| Log Group Selection | You | Either StartQuery's logGroupName, logGroupNames, or logGroupIdentifiers (the two that take several log groups accept up to 50), or SOURCE in the query text (up to five prefixes). Console: Log group name (up to 50) and Log group criteria (up to five prefixes, or All log groups). | Query statistic: logGroupsScanned | Log group selection options when creating a query, SOURCE, StartQuery |
| Log Class | You | logGroupClass when creating a log group. In queries, SOURCE's logGroupClass (examples and sentences on the same page use class). Console: Log class (both default to Standard). | API field: DescribeLogGroups's logGroupClass | SOURCE, Log group selection options when creating a query, LogGroup |
How to Write filter Comparisons | You | Query text. Indexes take effect only with = and IN; like does not use indexes. | Query statistic: estimatedBytesSkipped and estimatedRecordsSkipped (for queries including log groups with field index policies). | filter, QueryStatistics |
| Fields Indexed by Policy | You | PutIndexPolicy (per log group) or PutAccountPolicy's FIELD_INDEX_POLICY (per account). | API field: DescribeIndexPolicies's source (either ACCOUNT or LOG_GROUP) and DescribeFieldIndexes's indexCategory (CUSTOM). Console: Log group's Field indexes tab. | Field index syntax and quotas, PutIndexPolicy, IndexPolicy |
| Number of Results and Early Stopping | You | limit N (default 10,000, maximum 100,000) or limit any N in the query text. StartQuery's limit. | Query statistic: recordsScanned, bytesScanned, resultCount | limit, StartQuery |
The
Where You Can See It column lists representative locations confirmed in the sources this article read, and does not cover all possibilities. Regarding log group selection, the user guide's Log group selection options when creating a query page states that if your choices match more than 10,000 log groups, you will receive an error message prompting you to narrow your selection. The SOURCE command is only available through the AWS CLI and API, and is not supported in the console (see Section 5.3). The API reference for LogGroup lists three log classes, and notes that the Delivery log class does not offer features such as querying through CloudWatch Logs Insights.3.2 What CloudWatch Logs Determines
CloudWatch Logs determines the default index fields and the automatically indexed fields, the log events the query attempts to skip within the range selected by the user, the log groups thatfilterIndex scans, the point at which limit any N stops the scan, and the duration for which each event is indexed under a policy index. The last row of the table represents the estimated value before execution. The user guide describes this value as an estimate of the number of bytes the query would scan over the selected log groups and time range.| Item | Decided By | What You Set | Where You Can See It | Where the Source Says So |
|---|---|---|---|---|
| Default index fields | AWS | Not found | API field: DescribeFieldIndexes's indexCategory (DEFAULT) | Create field indexes to improve query performance and reduce scan volume (checked 2026-10-11; the list differs across the sources, Section 8.1) |
| The set of automatically indexed fields | AWS, from your queries | Not found (no setting to stop it or to keep a field from being selected was found; Section 8.2) | API field: DescribeFieldIndexes's indexCategory (AUTO. Only when indexCategories in the request includes AUTO). Console: Log group's Field indexes tab | Automatically indexed fields |
| Log events the query attempts to skip | AWS, within your settings | The = or IN operators in the query filter, and index policies (no settings found to directly select which events to skip). | Query statistic: estimatedBytesSkipped, estimatedRecordsSkipped (for queries that include log groups with field index policies). See Section 7.3. | Create field indexes to improve query performance and reduce scan volume, QueryStatistics |
Log groups scanned by filterIndex | AWS, within your settings | The filterIndex in the query, and the selected log groups. | Query statistic: logGroupsScanned | filterIndex |
The point at which limit any N stops the scan | AWS, within your settings | The value of N in limit any. | Query statistic: recordsScanned, bytesScanned (Section 7.4) | limit |
| For policy indexes, the duration for which each event is indexed (30 days from ingestion) | AWS | Not found | Documentation only | Create field indexes to improve query performance and reduce scan volume |
| The estimate value before execution | AWS, within your settings | The selected log groups and time range (the value is obtained using the estimate at the end of the query). | Query result: estimate (no description of the field that holds the value was found in the sources; in the response from the verification date, it is @estimatedBytesScanned within results; Section 7.4). Console: Query editor | estimate, What's New 2026-09-29 |
CloudWatch Logs determines which log events the query attempts to skip, but the user sets the underlying criteria. The user selects these criteria by defining the
filter in their query, establishing index policies, and choosing the query targets. The user guide's overview page, using the requestId index as an example, explains that queries using = or IN with indexed fields attempt to process only the log events that are known to contain the indexed field and the queried value, and for which CloudWatch Logs has detected a value for that field in the past.Then, any CloudWatch Logs Insights query on that log group that includes requestId = value or requestId IN [value, value, ...] will attempt to process only the log events that are known to contain that indexed field and the queried value, and that CloudWatch Logs has detected a value for that field in the past.CloudWatch Logs selects the fields for automatic indexing, using the user's recent queries as the basis (Section 6.1). No setting to stop automatic indexing was found in the sources this article read (Section 8.2).
3.3 Three Kinds of Means for Reducing Scan Volume
Means of reducing scan volume fall into three kinds, following the wording of the sources. The first involves defining the scope of the query, including specifying the time range and selecting log groups and log classes. The second has the query attempt to skip processing by using an index, through= and IN within filter statements applied to indexed fields. The third offers shortcuts that may alter the returned results, using filterIndex and limit any N. The following table outlines what the sources say about the scan and about the result for each method.| Means | What You Set | What the Source Says About the Scan | Effect on the Result | Where the Source Says So |
|---|---|---|---|---|
| Narrow the time range | startTime and endTime | The estimate page describes the estimate as "the estimated bytes that the query would scan over the selected log groups and time range." | Sets what is queried | estimate, GetQueryResults |
| Narrow the log groups and log class | logGroupNames, logGroupIdentifiers, SOURCE, console selection | Similarly, it states "over the selected log groups and time range." | Sets what is queried | estimate, Log group selection options when creating a query |
Use = or IN with the filter for indexed fields | Query text, index | "will attempt to skip processing log events that are known not to include the indexed field." | The source does not say. | filter |
Use filterIndex | Query text | "forcing a query to scan only log groups that are indexed on a field that you specify in the query" and "attempting to scan only log events from these log groups that match the value specified in the query for this field index." | Can change the result (returns only indexed data, and only results from after the index was created) | filterIndex |
Use limit any N | Query text | "stop the query as soon as N matching log events are found, without scanning remaining data." | Can change the result (the returned events can come from any portion of the time range, and the order is not guaranteed.) | limit |
The first and second rows, stating
Sets what is queried, mean that changing the scope will affect the set of log events that contribute to the results (see Section 2.4). The third row's The source does not say. simply indicates that the user guide's filter and overview pages do not describe the impact on results when the query attempts to skip processing. This article does not state whether results change or remain unchanged. Regarding automatically indexed fields, the user guide's automatic indexing page does not explicitly describe how automatic indexing changes the scan (see Section 6.4). The reasons provided in the fourth and fifth rows are quoted verbatim in Sections 5.2 and 5.5.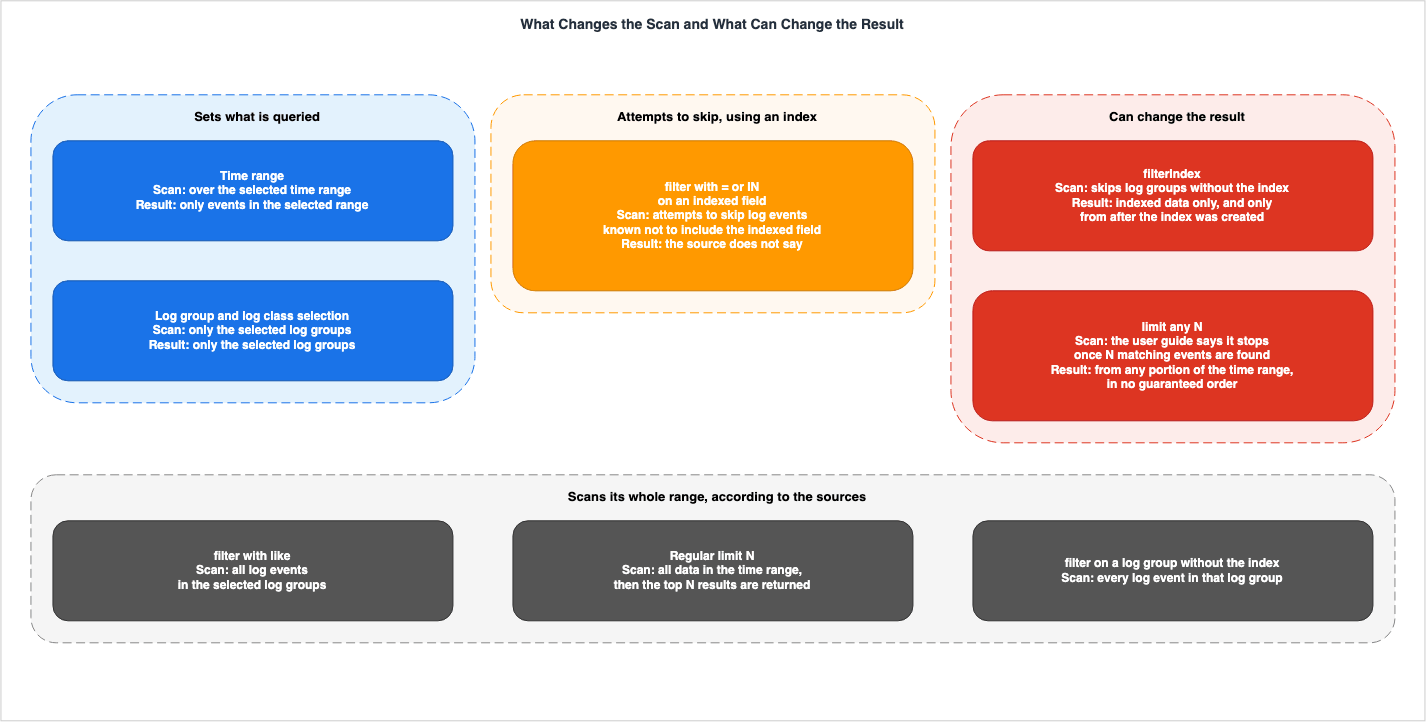
| Item | What the Source Says About the Scan | Where the Source Says So |
|---|---|---|
filter with like | "don't use indexes and always scan all log events in the selected log groups" | filter |
Regular limit N | "the query scans all data in the time range and then returns the top N results" | limit |
filter for log groups without indexes | Using the example of four log groups with indexes and one without, the filter query "will scan every log event in that fifth log group" | filterIndex |
A regular
limit N does not stop the scan early; it sets the number of results returned. The user guide's limit page states that without a limit specified, the query returns up to 10,000 results by default, and that a maximum of 100,000 can be specified.4. Index Rules
This section will cover the source of indexes, the types and limits of index policies, the scope of log events covered by indexing, constraints on log classes and formats, and what happens when a policy is deleted or is created in a monitoring account.4.1 Three Origins of Indexes, and Four Values for indexCategory
Field indexes come from three places: default indexes, policy indexes, and automatic indexes. In the API reference, DescribeFieldIndexes and FieldIndex represent the index category using four values for indexCategory.indexCategory | Who Puts the Field There | Counts Toward the 20-Field Quota | Returned When indexCategories Is Omitted | Where the Source Says So |
|---|---|---|---|---|
DEFAULT | CloudWatch Logs (default) | No ("Default field indexes are not counted towards your field index quota.") | Yes | DescribeFieldIndexes, Create field indexes to improve query performance and reduce scan volume |
CUSTOM | User (through index policy) | Yes ("These fields count toward the quota of 20 fields for each log group.") | Yes | DescribeFieldIndexes |
AUTO | CloudWatch Logs (based on user queries) | No ("These fields do not count toward the field index quota.") | No | DescribeFieldIndexes, Automatically indexed fields |
INACTIVE | User (removed from policy) or CloudWatch Logs (selecting a different field). Fields that CloudWatch Logs indexed before but does not index now. | The source does not say. | Yes | DescribeFieldIndexes |
The API reference documents two scenarios that result in an
INACTIVE status. These are when a user removes a field from their policy, and when CloudWatch Logs selects a different field based on the user's queries.INACTIVE: Fields that CloudWatch Logs indexed before but does not index now. This happens if you remove a field from the field index policy or if CloudWatch Logs automatically selects a different field based on your queries.The list of fields for the default index varies across the sources. The user guide's three pages (Overview, Field index syntax and quotas, and filterIndex), as well as the API reference for
PutAccountPolicy, list 10 fields as the default index for all log groups in the Standard log class: @logStream, @aws.region, @aws.account, @source.log, @data_source_name, @data_source_type, @data_format, traceId, severityText, and attributes.session.id. They also list default indexes for each combination of data source name and type. This combination-specific list also differs in one place across the sources. The user guide lists query_type, transport, and rcode for amazon_route53.resolver_query, while PutAccountPolicy lists transport and rcode. The API reference for PutIndexPolicy lists 5 fields: @logStream, @aws.region, @aws.account, @source.log, and traceId. This article does not treat either as an error (Section 8.1). Users can see what DescribeFieldIndexes returns as default indexes for their log groups by checking the items where indexCategory is DEFAULT. The DEFAULT entries in the response from the run on the verification date differed from both lists (Section 7.4).4.2 Index Policies — Log Group Level and Account Level
Index policies can be created at two levels: log group level and account level.| Item | Log Group Level | Account Level | Where the Source Says So |
|---|---|---|---|
| Creation Operation | PutIndexPolicy | PutAccountPolicy (policy type: FIELD_INDEX_POLICY) | PutIndexPolicy, PutAccountPolicy |
| Scope | A single log group | All Standard log groups within an account, log groups selected by log group name prefix, or log groups selected by data source name and type combination. | Field index syntax and quotas, Create an account-level field index policy |
| Number of Policies | No statement about the number was found. PutIndexPolicy creates or updates the policy for the specified log group. | Maximum 40 (20 selected by prefix, 20 selected by data source). If a policy applies to all log groups, you cannot create policies based on prefixes. Prefixes cannot overlap. | Field index syntax and quotas |
| Number of Fields per Policy | Maximum 20 | Maximum 20 | Field index syntax and quotas |
| Region | No statement about the Region was found (the policy applies to a single log group). | Only log groups within the Region where the account-level policy was created. ("Account-level policies are Region-specific") | PutAccountPolicy |
| Console | Log group's Field indexes tab | Settings > Logs tab, Account level index policies | Create a log-group level field index policy, Create an account-level field index policy |
When two policies overlap, policies applied at the log group level take precedence over account-level policies that apply to the whole log group (those without selection criteria and those selected by prefix). Account-level policies selected by data source apply at the log event level and can be applied in conjunction with log group-level policies. The user guide's Field index syntax and quotas page states the following:
Log group-level field index policies override account-level field index policies: which apply to the log group as a whole (such as, account-level policies with no selection criteria or with log group name prefix based selection criteria). Account-level policies which match at the log event level (such as, for a given data source name and type combination) will apply in addition to policies which match the log group as a whole.DescribeIndexPolicies returns log group-level policies if they exist for the specified log group. If no log group-level policies are found, it returns account-level policies that apply to that log group. The level of the returned policy is indicated in the response's source field (either ACCOUNT or LOG_GROUP). Whether data source-selected account-level policies are also returned is not specified on this page. The API reference states that when looking only for account-level policies, you should use DescribeAccountPolicies.Field names are case-sensitive. The user guide notes that the index for
RequestId does not match log events containing requestId. When indexing custom fields that begin with @, you must prefix the name with another @ (for example, if the field is @userId, the index should be @@userId). Certain fields generated by CloudWatch Logs Insights, such as @logStream and @ingestionTime, can be indexed without adding a @.4.3 Log Events Indexed — Events After Policy Creation and 30 Days
Regarding policy indexes, CloudWatch Logs only indexes log events ingested after the policy is created. The overview page in the user guide states:CloudWatch Logs indexes only the log events ingested after an index policy is created. It doesn't index log events ingested before the policy was created. After you create a field index, each matching log event remains indexed for 30 days from the log event's ingestion time.This 30-day period, under a policy index, represents the duration for which each log event is indexed from the time it is ingested. The sources word this period differently from the 30 days for automatic indexing (see Section 6.2). What's New 2024-11-21 states that policy indexes "will remain indexed for up to 30 days" (see Section 8.1).
Users can find information about the earliest log events covered by an index by examining the
firstEventTime field in the response from the DescribeFieldIndexes API. The FieldIndex entry in the API reference describes firstEventTime as follows:The time and date of the earliest log event that matches this field index, after the index policy that contains it was created.4.4 Log Classes and Log Formats
Only log groups with the Standard log class can have an index policy. The API reference forPutIndexPolicy states:Only log groups in the Standard log class support field index policies.The table on the Log classes page in the user guide indicates "Yes" for Standard under the "Field indexing" row, and "No" for Infrequent Access. The Logs Insights QL commands supported in log classes page states that the
filterIndex command cannot be used with the Infrequent Access log class.Log groups in the Infrequent Access log class support all query commands except pattern, diff, filterIndex, and unmask.The API reference for
CreateLogGroup and the Log classes page state that the log class of a log group can't be changed after the log group is created.Only structured log formats, specifically JSON and service logs, are eligible for indexing. The overview page in the user guide states the following:
Fields indexes are supported only for the structured log formats of JSON and service logs.4.5 When Deleting a Policy
The user guide's Effects of deleting a field index policy page describes two things that happen when a policy that has been active for some time is deleted. First, even after deletion, queries can continue to benefit from the indexed log events for up to 30 days. Second, if a log group-level policy is deleted, and an account-level policy applies to that log group, the account-level policy will eventually take effect.For up to 30 days after the policy is deleted, queries can still benefit from the indexed log events.The
DeleteIndexPolicy API reference states that, regarding the second point, the log group will begin using the account-level policy within a few minutes ("in a few minutes the log group begins using that account-wide policy to index new incoming log events"). This wording differs from the user guide (Section 8.1).4.6 Monitoring Account Policies
Index policies created in a monitoring account for CloudWatch cross-account observability do not apply to log groups in linked source accounts. The overview page in the user guide states:If you create a field index policy in a monitoring account, that policy is not used for log groups in linked source accounts. A field index policy applies only in the account where it is created.However, queries from the monitoring account can select log groups in the source accounts. The sources this article read do not specify whether the source account's own index policies are used in these cases (see Section 8.2).
5. filter and filterIndex, limit and limit any
This section comparesfilter (with which an index lets the query attempt to skip processing) with filterIndex (which may alter the returned results), and limit any N. It also covers how to select log groups using SOURCE, and the use of indexes in both PPL and SQL.5.1 filter's = and IN, and like
The user guide's filter page states that queries using = and IN on indexed fields will attempt to skip processing log events that are known not to include the indexed field.any CloudWatch Logs Insights query on that log group that includes filter requestId = value or filter requestId IN [value, value, ...] will attempt to skip processing log events that are known not to include the indexed field.The same page indicates that queries that benefit from indexing are limited to
= and IN; like will not utilize indexing and will instead scan all log events in the selected log groups.Only queries with filter fieldName =... and filter fieldName IN... will benefit from the field index improvements. Queries with filter fieldName like don't use indexes and always scan all log events in the selected log groups.This page does not explain how the attempt to skip processing might affect the results. This article does not state whether the results change when using
filter with = and IN (as indicated in the table in Section 3.3, which states The source does not say.).5.2 filterIndex — Returning Only Indexed Data
The user guide describes filterIndex as a command that returns only indexed data.Use filterIndex to return indexed data only, by forcing a query to scan only log groups that are indexed on a field that you specify in the query.In the "filterIndex compared to filter" section of the same page, two queries are compared using an example where four out of five log groups have an
IPaddress index, while the fifth does not.fields @timestamp, @message
| filterIndex IPaddress = "198.51.100.0"
| limit 20The user guide states the following about this
filterIndex query.The following query using filterIndex will skip scanning the log group that doesn't have the field indexed. For each indexed log group, it attempts to scan only log events that have the indexed field, and it also returns only results from after the field index was created.The query using
filter in the same example is as follows:fields @timestamp, @message
| filter IPaddress = "198.51.100.0"
| limit 20The user guide describes the following about this
filter query.In contrast, if you use filter instead of filterIndex for a query of the same five log groups, the query will attempt to scan not only the log events that contain the value in the indexed log groups, but will also scan the fifth log group that isn't indexed, and it will scan every log event in that fifth log group.From this example, it can be understood that
filterIndex does not include log events from log groups without indexes, nor does it include log events prior to the creation of an index. Conversely, filter scans log groups even if they lack indexes. This article therefore reads this as meaning that, even when searching for the same value, the results returned by filterIndex and filter may differ. This is why this article positions filterIndex as a shortcut that can change the returned results.5.3 SOURCE and 10,000 Log Groups
Queries using filterIndex can target a large number of log groups. The overview page in the user guide states:When you use the filterIndex command in your query instead of the filter command, the query will run against selected log groups on log events that have field indexes. These queries can scan as many as 10,000 log groups which you choose by specifying as many as five log group name prefixes.When starting queries using the AWS CLI and API, you can select log groups using the
SOURCE command in your query. SOURCE allows you to select log groups based on a log group name prefix (up to five), account, log class, data source, and log group tags. The SOURCE page in the user guide notes that SOURCE is not available in the console and makes the following recommendation.Because you can specify large numbers of log groups to query this way, we recommend that you use SOURCE only in queries that use field indexes that you have created.This is an AWS recommendation. This article only references this recommendation as a statement within the user guide.
5.4 Indexes in PPL and SQL
The Analyzing log data with CloudWatch Logs Insights page in the user guide describes thefilterIndex command as being specific to Logs Insights QL.The filterIndex command is available only in Logs Insights QL.Both PPL and SQL offer alternative ways to select log groups using indexes. The PPL page mentions
aws:fieldIndex within the source specification, while the SQL page highlights filterIndex(...) within the FROM clause, noting that both methods return only indexed data. The PPL page also states that the relevant log groups are automatically selected ("The relevant log groups are automatically selected, based on the fields specified in the filterIndex command."). The following is an example from the SQL page in the user guide.SELECT * FROM `filterIndex('region' = 'us-east-1')`;This article does not delve into the detailed syntax for PPL and SQL. No statement about whether the
estimate command is available in PPL and SQL was found in the sources this article read (see Section 8.2).5.5 limit and limit any N
A regular limit N does not reduce the amount of data scanned. The user guide's limit page compares it with limit any N as follows.With a regular limit, the query scans all data in the time range and then returns the top N results. With limit any, the query completes early once enough results are found, which means the returned events may come from any portion of the time range.limit any N was added on June 8, 2026 (What's New 2026-06-08). This announcement describes limit any N as "to fetch the first N results." This is a different phrasing than the user guide's description, which states that results can come from any portion of the time range (Section 8.1). The user guide states that limit any N stops the query once it finds N matching log events, without scanning any remaining data.Use limit any N to stop the query as soon as N matching log events are found, without scanning remaining data.The note on the same page says that the order of the returned results is not guaranteed.
Because limit any stops scanning early, the results are not guaranteed to be in any particular order. If you need ordered results, use limit without any together with sort.The user guide provides an example query:
fields @message | limit any 1According to the user guide, with
limit any N, the scan stops at the point where N matching log events are found, and it is not determined where those events originate within the time range. The reason this article positions limit any N as a shortcut that can change the returned results is due to two statements: "may come from any portion of the time range" and "not guaranteed to be in any particular order." Statistics from running limit any 1 on the verification date are described in Section 7.4.6. Automatically Indexed Fields (September 29, 2026)
This section details automatic indexing, added on September 29, 2026, covering who selects the fields, how long they are kept, where they show up, the user guide's note, how to move a field to a policy, and what was not found in the sources.6.1 CloudWatch Logs Selects, Based on the User's Queries
What's New 2026-09-29 announced that CloudWatch Logs now automatically indexes frequently queried fields. The Automatically indexed fields page in the user guide states:CloudWatch Logs automatically indexes fields based on their recent use in CloudWatch Logs Insights equality filters that use the = or IN operators. These indexes are in addition to default field indexes and the field indexes that you configure in policies. You do not need to configure a policy for automatically indexed fields.CloudWatch Logs is the system that selects fields for automatic indexing. The input is the recent use of equality filters (using
= and IN) within user queries. This article writes the Decided By value for this selection as AWS, from your queries (see Section 2.2). CloudWatch Logs updates the set of automatically indexed fields based on recent query activity, and fields removed from the set will stop being indexed for newly ingested log events.CloudWatch Logs updates the set of automatically indexed fields based on recent query activity. When CloudWatch Logs removes a field from the set, it stops indexing newly ingested events for that field.No statement about the length of the "recent" period, or about how many times a field must be used to be selected, was found in the sources this article read (see Section 8.2).
6.2 30 Days, and the Field Quota
The user guide states that CloudWatch Logs retains automatically indexed fields for 30 days.CloudWatch Logs manages automatically indexed fields and retains them for 30 days. To keep a field indexed permanently, add it to an account-level or log-group level field index policy.However, the user guide does not clarify whether this 30-day period refers to the duration for which fields are retained in the set, or the length of time that indexes for individual log events are kept. Regarding policy indexes, the user guide states that each log event is indexed for 30 days from ingestion (Section 4.3). The automatic index page does not state this (Section 8.2).
Automatically indexed fields do not count toward the quota of 20 fields per log group. The
DescribeFieldIndexes API reference states, "These fields do not count toward the field index quota." What's New 2026-09-29 states, "don't count toward your 20-field-per-log-group limit."6.3 Where They Show Up
Automatically indexed fields are visible in both the console and the API. The user guide states that the Field indexes tab for a log group lists the automatically indexed fields. In the API, you must includeAUTO in the indexCategories parameter within a DescribeFieldIndexes request. Requests that omit indexCategories will not return automatically indexed fields.Include AUTO in the indexCategories request parameter. The response sets indexCategory to AUTO for automatically indexed fields. Requests that omit indexCategories do not return automatically indexed fields.In the CLI, include
AUTO in the --index-categories parameter for the describe-field-indexes command. The following example demonstrates specifying all four values. The log group name is for illustrative purposes only.aws logs describe-field-indexes \
--log-group-identifiers my-log-group \
--index-categories DEFAULT CUSTOM AUTO INACTIVEWhen the
indexCategories parameter is omitted, the response includes DEFAULT, CUSTOM, and INACTIVE fields (see Section 4.1). To check the automatically indexed fields, be sure to explicitly specify AUTO. In the run on the verification date, the response received within a minute after the first query did not include any AUTO entries (see Section 7.4).6.4 Use filter for Automatically Indexed Fields — the User Guide's Note and Its Reasons
The user guide's Automatically indexed fields page recommends using filter instead of filterIndex for automatically indexed fields, and explains the reasons why.We recommend that you use filter instead of filterIndex with automatically indexed fields. CloudWatch Logs can update or remove these fields based on query patterns. CloudWatch Logs retains them for only 30 days. The filterIndex command returns only indexed data. Because CloudWatch Logs updates the set based on query activity, a filterIndex query does not search events ingested before CloudWatch Logs selected the field or after CloudWatch Logs stopped indexing it. If you use filterIndex, add the field to a field index policy to keep it indexed regardless of query activity.The user guide explains the recommendation in four points. These are that CloudWatch Logs may update or remove these fields based on query patterns, that CloudWatch Logs retains these fields for only 30 days, that
filterIndex returns only indexed data, and that, because CloudWatch Logs updates the set based on query activity, queries using filterIndex will not search for log events ingested before CloudWatch Logs selected the field for indexing, or after it stopped indexing. The behavior of filterIndex is described in Section 5.2, and updates to the set are discussed in Section 6.1.The automatic indexing page does not explicitly state how automatic indexing changes the scan of
filter queries. The general principle outlined on the user guide's overview page states that queries using indexes attempt to skip processing (see the introduction and Section 1.1). What's New 2026-09-29 states the following about automatic indexing. This is an announcement and not a specification within the user guide.CloudWatch Logs identifies the fields in your queries that you use for filtering with the = and IN operations and indexes them automatically, enabling queries to run faster and scan less data.This site's earlier article, CloudWatch Logs Insights Query Cookbook, discusses the use of
filterIndex for indexes created by users, as a feature added in November 2024. The Cookbook focuses on policy indexes, while the user guide's note above pertains to automatically indexed fields. The limitation stated on the filterIndex page, that it returns only results from after the field index was created, is not a statement limited to automatically indexed fields (Section 5.2).6.5 Moving to Policies
If you want a particular field to be indexed continuously, regardless of query activity, the user guide says to add that field to a field index policy. What's New 2026-09-29 also mentions moving fields to a policy using either the console or API ("promote it to a field index policy using the console or API"). The user guide's instructions detail how users can add fields to a policy on a per-log group basis, using the "Manage field indexes" section within the "Field indexes" tab of a log group in the console. If this operation creates a new log group-level policy, the account-level policy that previously applied to the entire log group will no longer apply to that specific log group, as described later in this section.This article reads this as meaning that a field added to a policy has an
indexCategory of CUSTOM. The API reference defines CUSTOM as "Fields that you added manually to the field index policy," and states that CloudWatch Logs always indexes these fields and that they count toward the quota of 20 fields per log group.If a log group currently has no log group-level policy but is still subject to an account-level policy, the prioritization rules outlined in Section 4.2 will apply. The user guide's Field index syntax and quotas page states:
If you create log-group level index policy, that log group does not use account-level policies that match at the log group level.Creating a new log group-level policy will cause account-level policies that previously applied to the entire log group (those without selection criteria and those that select based on prefixes) to no longer apply to that specific log group. Account-level policies that select based on data sources will continue to apply (
PutIndexPolicy says they "may still apply"). The source field in the response shows the level of the policy that DescribeIndexPolicies returns (see Sections 4.2 and 7.2).No statement was found in the sources this article read about what happens to the indexing of log events that were previously indexed automatically before being moved to a policy (see Section 8.2).
6.6 What Was Not Found in the Sources
The following three were not found in the sources this article read. First, a way to stop automatic indexing or to keep specific fields from being selected. Second, the criteria used for selection, such as the length of "recent" or the number of uses. Third, the meaning of the 30 days in Section 6.2. The sources and terms searched are listed in Section 8.2. This article does not state that these items are unavailable or that there are no criteria; rather, it simply notes that they were not found.7. Where the Scan Volume and the Index State Show Up
This section lists the locations where the scan volume is visible, separating them into sections for before and after query execution. Between these sections, it lists the locations where the index state is visible.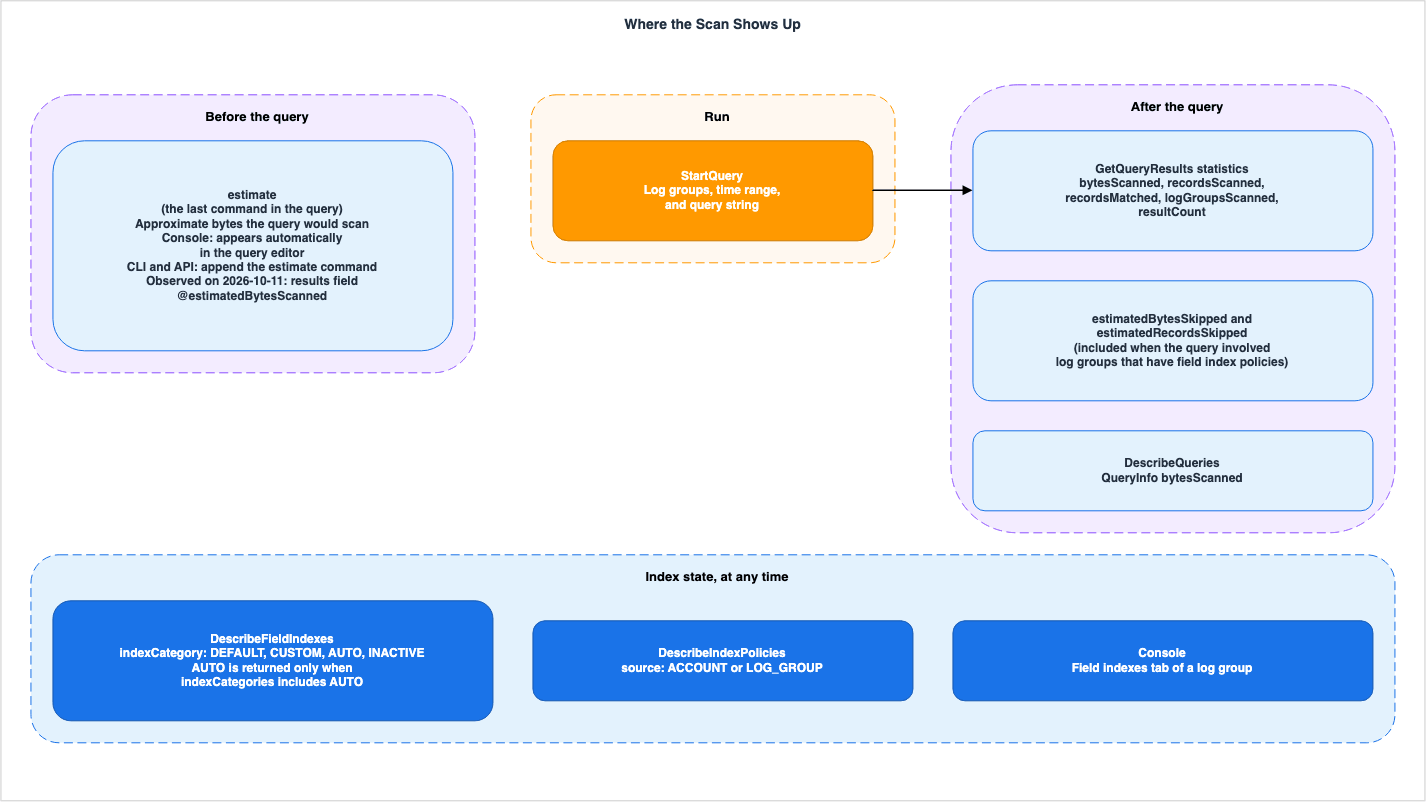
7.1 Before Execution — estimate
The estimate command returns an estimate of the number of bytes that will be scanned without actually executing the query. It was announced in What's New 2026-09-29. The estimate page in the user guide states:Use the estimate command to return the estimated bytes that the query would scan over the selected log groups and time range, without running the query. Using the estimated bytes returned by this command, you can refine your log group selection, time range and filters before you run the query.The
estimate command must be the last command in the query.The estimate command must be the last command in the query.The value returned by
estimate is an approximation and may differ from the actual volume of data scanned.The value that estimate returns is approximate and can differ from the actual volume of data scanned when you run the query.The example in the user guide uses the following query.
fields @timestamp, @message
| filter @message like /error/
| estimate
What's New 2026-09-29 notes that the method for using
estimate differs between the console and the CLI/API. In the console, the estimate is displayed automatically in the query editor when you change the log group selection, the time range, or the query text. With the AWS CLI and API, users must explicitly request the estimate by adding the estimate command to the end of the query.In the CloudWatch console, the estimate appears automatically in the query editor when you change the log group selection, time range, or query text. When using the AWS CLI or API, append the estimate command to your query to request it explicitly.No statement was found in the sources this article read about which field in the response contains the value returned by
estimate when using the CLI or API. No mention of a field to store the estimate value was found in the API reference (GetQueryResults and QueryStatistics), the CLI reference, or the botocore models (Section 8.2). The estimate page does not state whether the estimate takes into account the amount of data skipped due to indexing. Nor do the sources this article read say whether the bytesScanned value in the statistics section of a query with the estimate command represents the estimated value. In the response obtained on the verification date, the value was found in the results section under the name @estimatedBytesScanned, while the bytesScanned value in statistics was 0 (Section 7.4). This field name was not found in the sources this article read.The Document history section of the user guide includes an entry for
estimate dated July 22, 2026. The postDateTime for the announcement in What's New is September 29, 2026. This article uses the latter as the announcement date and lists the two as a disagreement (Section 8.1).7.2 Index State — DescribeFieldIndexes and DescribeIndexPolicies
The state of indexes can be found using DescribeFieldIndexes. The API reference begins its description of DescribeFieldIndexes with "Returns a list of field indexes discovered in log data." According to the API reference, the FieldIndex within the response contains the following items for each field:| Field | What the API Reference Says | Where the Source Says So |
|---|---|---|
fieldIndexName | "The string that this field index matches." | FieldIndex |
indexCategory | One of DEFAULT, CUSTOM, AUTO, or INACTIVE (see Section 4.1). | FieldIndex, DescribeFieldIndexes |
type | Either FACET or FIELD_INDEX ("This determines how the field is indexed and can be queried.") | FieldIndex |
firstEventTime | "The time and date of the earliest log event that matches this field index, after the index policy that contains it was created." | FieldIndex |
lastEventTime | "The time and date of the most recent log event that matches this field index." | FieldIndex |
lastScanTime | "The most recent time that CloudWatch Logs scanned ingested log events to search for this field index to improve the speed of future CloudWatch Logs Insights queries that search for this field index." | FieldIndex |
logGroupIdentifier | If the index is part of a policy at the log group level, this is the ARN of that log group. | FieldIndex |
The
DescribeFieldIndexes request takes logGroupIdentifiers (required, up to 100) and indexCategories (up to four). If you omit indexCategories, AUTO will not be returned (see Section 6.3).The level of the policy returned by
DescribeIndexPolicies is specified in the source field within each IndexPolicy in the response. The possible values are ACCOUNT (account-level) and LOG_GROUP (log group-level). The criteria for which policies are returned are described in Section 4.2.7.3 After Execution — GetQueryResults statistics
After the query is executed, you can view the amount of data scanned in the statistics section of the GetQueryResults response. For queries that include log groups with field index policies, you can also see an estimate of the amount of data skipped. The API reference for QueryStatistics includes the following seven fields:| Field | What the API Reference Says |
|---|---|
bytesScanned | "The total number of bytes in the log events scanned during the query." |
recordsScanned | "The total number of log events scanned during the query." |
recordsMatched | "The number of log events that matched the query string." |
logGroupsScanned | "The number of log groups that were scanned by this query." |
estimatedBytesSkipped | "An estimate of the number of bytes in the log events that were skipped when processing this query, because the query contained an indexed field." |
estimatedRecordsSkipped | "An estimate of the number of log events that were skipped when processing this query, because the query contained an indexed field." |
resultCount | "The number of rows in the final query result set." |
Regarding the conditions under which the two fields representing skipped data are included in the response, the
QueryStatistics documentation states:If the query involved log groups that have field index policies, the estimated number of skipped log events and the total bytes of those skipped log events are included.This sentence names log groups that have field index policies. The sources this article read do not specify whether these two fields are included when only default or automatic indexing is used (see Section 8.2).
The description for
GetQueryResults's statistics states that the values reflect the full raw results of the query ("These values reflect the full raw results of the query."). The API reference indicates that when the status is Running, only partial results are returned, and that the final results can be viewed later by retrying when the status is Scheduled or Running.The
QueryInfo within the response from DescribeQueries, which returns a list of queries, also includes bytesScanned. The API reference describes this as "The total number of bytes scanned by the query." QueryInfo also includes queryDuration (milliseconds taken to execute the query).7.4 Observations from the Verification Date
On October 11, 2026 (UTC), the following six queries were run against the single small log group described in Section 1.4. The time range for each query was set from one hour before to five minutes after the query execution. Log events were ingested after the index policy was created, and the first query was initiated approximately three minutes after ingestion.Q1: fields @timestamp, @message | filter requestId = "r-007"
Q2: fields @timestamp, @message | filterIndex requestId = "r-007"
Q3: fields @timestamp, @message | filter @message like /r-007/
Q4: fields @timestamp, @message | filter requestId = "r-007" | estimate
Q5: fields @message | limit any 1
Q6: fields @timestamp, @message | filter path = "/api/item" | limit 5The following table shows the number of rows in the
results section of the GetQueryResults response, as well as the values in the statistics section. The requestId fields for Q1 and Q2 are present in the index policy, while the path field for Q6 is not.| Query | Rows in results | bytesScanned | recordsScanned | recordsMatched | estimatedBytesSkipped |
|---|---|---|---|---|---|
| Q1 | 1 | 17,800 | 200 | 1 | 0 |
| Q2 | 1 | 17,800 | 200 | 1 | 0 |
| Q3 | 1 | 17,800 | 200 | 1 | 0 |
| Q4 | 1 | 0 | 0 | 0 | 0 |
| Q5 | 1 | 17,800 | 200 | 200 | 0 |
| Q6 | 5 | 17,800 | 200 | 200 | 0 |
For all six queries, the values for
estimatedRecordsSkipped, logGroupsScanned, and resultCount were 0, 1, and the number of rows in results, respectively. These results show the following five points:- Where the
estimatevalue appears: In the Q4 response, the estimated value was found in theresultssection, within a field named@estimatedBytesScanned, and was represented as the string "17800". ThestatisticsfieldsbytesScannedandrecordsScannedwere both 0. The name of this field was not found in the sources this article read (Section 8.2). Under the same conditions, thebytesScannedvalue for Q1 was also 17,800. The user guide describes theestimatevalue as an approximation (Section 7.1). This article does not generalize from this single match. - Amount skipped: Even when using
filterwith=(Q1) andfilterIndex(Q2) for fields with an index, within this log group,estimatedBytesSkippedwas 0, and the amount scanned was the same as withlike(Q3). The reason why the amount skipped was 0 is unclear from both the sources and this single result. This article does not judge the reason. Both skipped fields were present in every query response for this log group, which has a field index policy. TheDescribeFieldIndexesresponse at that time did not includelastScanTime(see "Index state" below). This article does not judge the relationship between the zero amount skipped and the missinglastScanTime. limit any 1: Q5 returned a single record, butrecordsScannedwas 200 andbytesScannedwas 17,800, the same as Q6. The user guide states thatlimit any Nstops the query as soon as N matching log events are found, without scanning the remaining data (Section 5.5). This article does not judge the relationship between the statistics values for this small log group and this statement. The record returned was the last log event inserted (r-199).- Index state: The
DescribeFieldIndexescall returned the same 9 items for both requests: one with 4 values inindexCategoriesand one without. One item wasCUSTOM(requestId, withtypeset toFIELD_INDEX), and eight wereDEFAULT.AUTOandINACTIVEwere not present. The results were obtained within a minute after the initial query. The eightDEFAULTitems were@logStream,@aws.account(both withtypeset toFIELD_INDEX),@aws.region,@data_source_name,@data_source_type,@data_format,severityText, andresource.attributes.service.name(the last six withtypeset toFACET). Compared to the 10-field list of default indexes in the sources (Section 4.1),@source.log,traceId, andattributes.session.idwere missing, andresource.attributes.service.nameis not in the lists in the sources. This article does not judge the reason for these differences. For each item,firstEventTimeandlastEventTimecorresponded to the earliest and latest times of the inserted log events. The response did not includelastScanTime, and thelogGroupIdentifierfield contained the log group's ARN for theDEFAULTitems as well. - Policy: The
DescribeIndexPoliciescall returned a single policy for the log group, withsourceset toLOG_GROUP.
Each of these results was obtained on the verification date by running each query or call once (
DescribeFieldIndexes twice, with and without indexCategories), on a single small log group containing 200 log events in us-east-1. These values will not be used for performance comparisons in this article.8. Where the Sources Disagree and Where No Statement Was Found
This section outlines where the sources this article read say different things, and the statements that were not found despite searching.8.1 Where the Sources Disagree
The following table lists disagreements between the sources and differences in wording. This article treats none of them as an error. The verification date is October 11, 2026.| Topic | One Source | The Other Source | Where Discussed |
|---|---|---|---|
| Default index fields | The user guide (across three pages) and PutAccountPolicy list 10 fields. | PutIndexPolicy lists 5 fields. | Section 4.1 |
| Default indexes for data sources | The user guide (across three pages) lists query_type, transport, and rcode for amazon_route53.resolver_query. | PutAccountPolicy lists transport and rcode. | Section 4.1 |
| Strength of the wording on skipping | The user guide's overview and filter pages use "attempts to skip" or "attempt to skip." PutAccountPolicy and PutIndexPolicy use "attempt to skip." | The Analyzing log data with CloudWatch Logs Insights page states, "The query skips processing log events that are known to not include the indexed field, and processes less data." The QueryStatistics section states, "Using field indexes to skip log events in queries reduces scan volume and improves performance." The overview page's sentence right after "attempts to skip" ("This reduces the scan volume of your queries that use field indexes") and the example sentence in PutIndexPolicy ("will process fewer log events") are also stated definitively. | Introduction, Section 5.1 |
| Which log events are processed | The filter page states that the query attempts to skip processing log events "known not to include the indexed field." | The overview page states that the query attempts to process only the log events "known to contain that indexed field and the queried value." PutAccountPolicy also states that the query attempts to process only the log events where the indexed field matches the specified value. | Sections 3.2, 5.1 |
| Index policy duration (30 days) | The user guide states, "each matching log event remains indexed for 30 days from the log event's ingestion time." | What's New (2024-11-21) states, "will remain indexed for up to 30 days." | Section 4.3 |
Results returned by limit any N | What's New (2026-06-08) states, "to fetch the first N results." | The user guide states, "the returned events may come from any portion of the time range." | Section 5.5 |
| After deleting a policy at the log group level | The user guide states that account-level policies will eventually apply. | DeleteIndexPolicy states, "in a few minutes." | Section 4.5 |
| Combining policies selected for data sources | The user guide states, "will apply in addition." PutAccountPolicy states, "still apply." | PutIndexPolicy states, "may still apply." | Sections 4.2, 6.5 |
| Unit of the 20-field quota | The Field index syntax and quotas page and PutIndexPolicy state 20 per policy ("As many as 20 fields can be included in the policy."). | DescribeFieldIndexes states "the quota of 20 fields for each log group," and What's New 2026-09-29 states "20-field-per-log-group limit." | Sections 4.1, 4.2, 6.2 |
estimate date | The user guide's Document history includes an entry for July 22, 2026. | What's New's postDateTime shows 2026-09-29. | Section 7.1 |
| Field index date | The user guide's Document history includes an entry for November 20, 2024. | What's New's postDateTime shows 2024-11-21. | Section 1.3 |
| Title of the first page of the field index chapter | The user guide's title is "Create field indexes to improve query performance and reduce scan volume." | The strings used in the API reference links for PutIndexPolicy and PutAccountPolicy use a different title. | Section 1.2 |
| Entry point for selecting a log group | The Log group selection options when creating a query page starts with navigation from Logs and Logs Insights. | The Analyzing log data with CloudWatch Log Analytics page describes Log Analytics as the console's default experience. | Section 1.2 |
Term used to select a log class with SOURCE | The keyword list on the SOURCE page uses logGroupClass. | The same page's examples and text use class. | Section 3.1 |
| Ways to select a log group using indexes | The Analyzing log data with CloudWatch Logs Insights page describes the filterIndex command as specific to Logs Insights QL. | The PPL page lists aws:fieldIndex, and the SQL page lists filterIndex(...), as ways to return only indexed data. | Section 5.4 |
This article does not judge the reason for any of the disagreements. The last row simply highlights a difference between a command and an alternative phrasing, and does not necessarily represent a contradiction. The PPL page itself also uses the term
filterIndex command (Section 5.4). In addition, the differences between the responses obtained on the verification date and the descriptions in the sources are described in Section 7.4.8.2 Where No Statement Was Found
The following two tables list the statements this article looked for and did not find. Not finding a statement does not prove that none exists. The tables list the sources and terms searched. The first table concerns automatic indexing.| What Was Looked For | Where It Was Looked For | Search Terms | Result |
|---|---|---|---|
| Methods to disable automatic indexing, methods to prevent specific fields from being selected | Seven pages of the field index chapter, API reference, CLI reference, botocore 1.43.111 model, What's New 2026-09-29, AWS documentation search | disable, opt out, turn off, stop, auto, AUTO, automatically index | 0 statements on this. Among operations in the botocore model whose input descriptions contain auto, only DescribeFieldIndexes (where AUTO is specified) relates to indexes. The keys of an index policy document described in the API reference are Fields and FieldsV2 (with types FIELD_INDEX and FACET), but no keys related to automatic indexing were found. |
| Criteria for selecting automatic indexing (recent period, frequency) | Same as above | recent, frequently, threshold | The user guide mentions "based on their recent use" and "based on recent query activity." DescribeFieldIndexes states "based on your query patterns and usage," and What's New says "the fields you query frequently." No results were found for descriptions related to specific periods or frequencies. |
| The meaning of the 30-day period for automatic indexing | Automatically indexed fields, DescribeFieldIndexes, What's New 2026-09-29 | 30 days, retain | Only mentions "retains them for 30 days," "retains them for only 30 days," and "are retained for 30 days." No results were found for descriptions related to the indexing period for individual log events. |
| How automatically indexed log events are handled when moving to a policy | Automatically indexed fields, Field index syntax and quotas, PutIndexPolicy, What's New 2026-09-29 | promote, permanently, existing | Only mentions "To keep a field indexed permanently, add it to an account-level or log-group level field index policy" and What's New's "promote it to a field index policy using the console or API." |
User guide descriptions of how the filter scan changes with automatic indexing | Automatically indexed fields, filter | scan, skip | No mentions of scan or skip were found on the automatic indexing page. The indexing section on the filter page only provides examples of user-created indexes. |
The second table concerns
estimate, statistics, and other items.| What Was Looked For | Where It Was Looked For | Search Terms | Result |
|---|---|---|---|
Field where the estimate value is returned | estimate, GetQueryResults, QueryStatistics, StartQuery, CLI Reference, botocore 1.43.111 model | estimate, estimated bytes | 0 statements on this. In botocore, the descriptions that contain estimate, other than QueryStatistics and its two skipped fields, are only those for metric filters. It is not stated whether the bytesScanned value in the statistics section of a query with estimate represents an estimated value. In the response on the verification date, the value was in the @estimatedBytesScanned field within results, and bytesScanned was 0 (Section 7.4). This field name appears 0 times in the sources. |
Whether estimate can be used in PPL and SQL | PPL, SQL, Supported query languages page | estimate | 0 results on the PPL and SQL pages. |
Whether the value of estimate accounts for the amount skipped by the index | estimate, What's New 2026-09-29 | index, skip | 0 results. |
Whether estimatedBytesSkipped is included when only default or automatic indexes are involved | QueryStatistics, GetQueryResults | field index policies, default, automatic | The only relevant text mentions "log groups that have field index policies." |
Whether indexes with type set to FACET are used when the query attempts to skip processing | Use facets to group and explore logs, seven pages in the field index chapter, filter, filterIndex, Analyzing log data with CloudWatch Logs Insights, FieldIndex, PutIndexPolicy, PutAccountPolicy, QueryStatistics | facet, FACET, skip | 0 results that link facets to skipping. PutIndexPolicy states, "When you create a field index, you can optionally set it as a facet to enable this interactive analysis capability." |
Impact on results when the query attempts to skip processing using = and IN with filter | Create field indexes to improve query performance and reduce scan volume, filter, filterIndex | result, results | 0 statements on this, except for a statement about returning results faster and a description of the number of results returned by an example query ("The query limits the results to 20 log events"). The comparison example on the filterIndex page only describes the results range on the filterIndex side. |
| Indexes used when a monitoring account queries log groups in a source account | Seven pages in the field index chapter, PutIndexPolicy, PutAccountPolicy | monitoring account, source account | The only relevant text states that policies created in a monitoring account do not apply to a source account, and a paragraph on the filterIndex query states that a monitoring account can select a source account. The facets page states that a monitoring account cannot see facets based on log data from a source account. |
| Settings to modify the default index | Overview page, Field index syntax and quotas, PutIndexPolicy, PutAccountPolicy | default, remove, disable, exclude | The only relevant text states that the default index is added to the indexes defined in the policy ("in addition to"). |
| Settings to change the 30-day period for index policies | Same as above, plus IndexPolicy | 30 days, retention, retain, period | 0 statements on this. |
| Number of policies per log group | Field index syntax and quotas, PutIndexPolicy, DescribeIndexPolicies | only one, one policy, per log group | 0 statements on this (the text "Only one account policy can be created per data source name and type combination" refers to account-level policies). |
| Relationship between intelligent tiering tiers and indexes | Intelligent tiering page, What's New 2026-07-15 | index, field index | 0 statements on this. The page states, "Your query experience remains the same regardless of which access tier your log data resides in." |
9. Frequently Asked Questions about CloudWatch Logs Insights Scan Volume
This article addresses questions that may arise when you're trying to reduce query scan volume or when you see the announcement of automatic indexing.Q1. Does creating a field index reduce the amount of data scanned for every query?
Not necessarily. The user guide's filter page states that, amongfilter queries, only = and IN queries benefit from indexing, while like queries will scan all log events in the selected log groups (Section 5.1). Even for = and IN, what the user guide says is that the query attempts to skip processing (Section 5.1). While filterIndex also utilizes indexing, it limits the scope of the returned results (Section 5.2). According to the user guide and the API reference, with policy indexes, CloudWatch Logs only indexes log events ingested after the policy was created, and only log groups in the Standard log class can utilize these policies. Indexing is only applied to structured formats, specifically JSON and service logs (Sections 4.3 and 4.4).Q2. Do filter and filterIndex return the same results?
Not necessarily. The user guide states that filterIndex returns only indexed data and only results from after an index was created. In the user guide's example (where indexes exist for 4 out of 5 log groups), filter scans every log event in the 5th log group, which does not have an index, while filterIndex skips that log group (Section 5.2). The user guide's filter page and overview page do not explain how the query's attempt to skip processing with an index affects the results of filter with = and IN.Q3. Should filterIndex be used for automatically indexed fields?
The user guide recommends using filter instead of filterIndex for automatically indexed fields. The user guide cites the following reasons: CloudWatch Logs may update or remove these fields, they are only retained for 30 days, and filterIndex returns only indexed data. It also says that, because CloudWatch Logs updates the set of automatically indexed fields based on query activity, queries using filterIndex will not search log events ingested before CloudWatch Logs selected the field or after CloudWatch Logs stopped indexing it. The user guide advises that if you choose to use filterIndex, you should add that field to a field index policy (see Section 6.4).Q4. Does adding limit 20 reduce the amount of data scanned?
Not according to the user guide. The user guide states that a regular limit query scans all data in the time range before returning the top N results. The user guide gives limit any N as a way to stop the scan earlier, but the order of the returned results is not guaranteed, and events can originate from any portion of the time range (see Section 5.5). The statistics from running limit any 1 on a small log group on the verification date are described in Section 7.4.Q5. Does the value of estimate match the value of bytesScanned after execution?
Not necessarily. The user guide states that the estimate value is an approximation and may differ from the actual amount scanned (Section 7.1). The sentence in which the user guide makes this comparison refers to "the actual volume of data scanned" and does not name bytesScanned. In the single run on a small log group on the verification date, the estimate value (Q4) and the bytesScanned value of the same query without estimate (Q1) were both 17,800 (Section 7.4). This is a single instance of a match, and this article does not generalize from it.Q6. Can automatic indexing be stopped?
In the sources this article read, no method was found to stop automatic indexing or to keep it from indexing specific fields (Section 8.2). The user guide explains that adding a policy is a way to continue indexing fields (Section 6.5).Q7. What happens with log groups that have the "Infrequent Access" log class?
According to the API reference and the user guide, log groups using the Infrequent Access log class cannot have index policies. They also cannot utilizefilterIndex (see Section 4.4). The log class cannot be changed after the log group is created (see Section 4.4). The Infrequent Access tier used for intelligent tiering is separate from the log class, and the relationship between tiers and indexes was not found in the sources this article read (see Sections 1.5 and 8.2).Q8. When was the information in this article verified?
It was verified on October 11, 2026 (UTC). Automatic indexing andestimate were announced only recently, on September 29, 2026 (the What's New date; the Document history lists estimate in its July 22, 2026 entry; see Section 8.1). The information in the user guide may change. When reading, check the latest user guide and What's New.10. Summary
- What affects the scan volume is split between what the user chooses and what CloudWatch Logs decides: Users can choose the time range, log group, log class, the way
filteris written, index policies, andlimitandlimit any. CloudWatch Logs determines the default index fields and the automatically indexed fields, the log events the query attempts to skip within the user-selected range, the log groups thatfilterIndexscans, and the point at whichlimit any Nstops the scan. - The means of reducing the scan volume fall into three kinds: The selection of the time range, log group, and log class defines the scope of the query. With
=andINinfilteron an indexed field, the query attempts to skip processing by using the index. The user guide's filter page and overview page do not describe how that attempt to skip processing affects the results.filterIndexandlimit any Nare shortcuts that can alter the returned results. - The benefit of an index is conditional: In
filter, only=andINbenefit from indexing;likewill scan all log events in the selected log groups. Index policies only index log events ingested after the policy is created. The user guide states that each event is indexed for 30 days from ingestion (What's New 2024-11-21 states "up to 30 days"). Policies are only supported for the Standard log class, and indexing is limited to structured formats for JSON and service logs. - CloudWatch Logs selects automatically indexed fields based on the user's queries: Automatic indexing was announced on September 29, 2026. Automatically indexed fields do not count toward the 20-field quota, and they are visible in the
DescribeFieldIndexesoutput whenAUTOis specified, as well as in the Field indexes tab. The user guide recommends usingfilterinstead offilterIndexfor automatically indexed fields. The automatic indexing page does not explicitly describe how automatic indexing changes the scan offilterqueries. No statement about how to stop it or about the selection criteria was found in the sources this article read. - The scan volume shows up before and after the query, and the index state shows up through separate operations: Before execution, you can use
estimate(an approximation; automatically displayed in the console; in the AWS CLI and API, the user adds it at the end of the query). After execution, you can useGetQueryResultsand view thestatistics(e.g.,bytesScanned,recordsScanned). Estimated amounts of data skipped are available for queries that include log groups with field index policies. The state of the index can be viewed usingDescribeFieldIndexesandDescribeIndexPolicies. In the sources this article read, no fields were found in the response that contain theestimatevalue. In the response from the run on the verification date, the value was in the@estimatedBytesScannedfield within theresultssection.
11. References
- Create field indexes to improve query performance and reduce scan volume - Amazon CloudWatch Logs
- Automatically indexed fields - Amazon CloudWatch Logs
- Field index syntax and quotas - Amazon CloudWatch Logs
- Create an account-level field index policy - Amazon CloudWatch Logs
- Create a log-group level field index policy - Amazon CloudWatch Logs
- Log group selection options when creating a query - Amazon CloudWatch Logs
- Effects of deleting a field index policy - Amazon CloudWatch Logs
- CloudWatch Logs Insights language query syntax - Amazon CloudWatch Logs
- filter - Amazon CloudWatch Logs
- filterIndex - Amazon CloudWatch Logs
- estimate - Amazon CloudWatch Logs
- limit - Amazon CloudWatch Logs
- SOURCE - Amazon CloudWatch Logs
- Analyzing log data with CloudWatch Logs Insights - Amazon CloudWatch Logs
- Supported query languages - Amazon CloudWatch Logs
- OpenSearch Piped Processing Language (PPL) - Amazon CloudWatch Logs
- OpenSearch Structured Query Language (SQL) - Amazon CloudWatch Logs
- Log classes - Amazon CloudWatch Logs
- Logs Insights QL commands supported in log classes - Amazon CloudWatch Logs
- Use facets to group and explore logs - Amazon CloudWatch Logs
- Optimize storage costs with Amazon CloudWatch Logs Intelligent Tiering - Amazon CloudWatch Logs
- CloudWatch Logs quotas - Amazon CloudWatch Logs
- Analyzing log data with CloudWatch Log Analytics - Amazon CloudWatch Logs
- Document history - Amazon CloudWatch Logs
- PutIndexPolicy - Amazon CloudWatch Logs
- PutAccountPolicy - Amazon CloudWatch Logs
- DescribeIndexPolicies - Amazon CloudWatch Logs
- IndexPolicy - Amazon CloudWatch Logs
- DescribeFieldIndexes - Amazon CloudWatch Logs
- FieldIndex - Amazon CloudWatch Logs
- StartQuery - Amazon CloudWatch Logs
- GetQueryResults - Amazon CloudWatch Logs
- QueryStatistics - Amazon CloudWatch Logs
- DescribeQueries - Amazon CloudWatch Logs
- QueryInfo - Amazon CloudWatch Logs
- LogGroup - Amazon CloudWatch Logs
- CreateLogGroup - Amazon CloudWatch Logs
- DescribeLogGroups - Amazon CloudWatch Logs
- DeleteIndexPolicy - Amazon CloudWatch Logs
- DescribeAccountPolicies - Amazon CloudWatch Logs
- describe-field-indexes - AWS CLI Command Reference
- Amazon CloudWatch Logs announces field indexes and enhanced log group selection in Logs Insights - What's New
- Amazon CloudWatch Logs Insights adds 23 new query commands and functions - What's New
- Amazon CloudWatch introduces Log Analytics for unified log analysis - What's New
- Amazon CloudWatch Logs announces intelligent tiering for storage - What's New
- Amazon CloudWatch Logs now automatically indexes frequently queried fields - What's New
- Amazon CloudWatch Logs Insights now lets you estimate bytes scanned before running a query - What's New
- botocore - GitHub
References:
Tech Blog with curated related content
Written by Hidekazu Konishi