MCP Server Testing and Debugging Guide - Inspector, Integration Tests, Transports, and CI Regression
First Published:
Last Updated:
This guide is the testing and debugging companion to the MCP implementation cluster on this site. It does not teach you how to build an MCP server — for that, see the MCP Server Implementation Reference and the MCP Server on AWS Lambda Complete Guide. Instead it answers three questions that every team running MCP servers eventually has to answer:
- Which layer do you test, and what do you verify at each one?
- When do you reach for the MCP Inspector versus an automated integration test?
- How do you keep regressions out once the server is in production and the protocol keeps moving underneath you?
The MCP specification is versioned by date, and the version is moving quickly. The current revision at the time of writing is
2025-11-25 (the immediately prior revision was 2025-06-18, and before that 2025-03-26 and 2024-11-05). Because the wire format, the authorization model, and the SDK surfaces all changed across those revisions, every technique in this guide is anchored to a specific, verifiable behavior in the current spec rather than to folklore. Where the official tooling is mid-rename or mid-restructure, this guide says so explicitly and tells you what to pin.A note on scope. This guide deliberately stays at the client-independent level for the protocol and the Inspector, and it delegates the deep dives that already exist elsewhere: Lambda-specific local testing and OAuth wiring go to the MCP Server on AWS Lambda Complete Guide; the security question of whether a third-party server is safe (as opposed to correct) goes to the MCP Tool Poisoning Defense Guide; and the mechanics of running anything unattended in CI go to the Claude Code CI/CD and Headless Automation guide.
1. Introduction: Three Layers, Three Kinds of Failure
The single most useful idea for testing MCP servers is that a server is not one thing — it is three things stacked on top of each other, and each layer fails differently and is tested differently.- The protocol layer. Below your business logic sits a JSON-RPC 2.0 conversation that follows a strict lifecycle: an
initializerequest, a capability negotiation, a version handshake, and then a stream of requests, responses, and notifications over a chosen transport. Failures here look like "the client never finishes connecting", "the server advertises a capability it does not implement", or "the session dies on reconnect". They are independent of what your tools do. - The server-logic layer. This is your code: the handlers behind
tools/list,tools/call,resources/list,resources/read,prompts/list, andprompts/get. Failures here look like "the tool returns the wrong shape", "the input schema does not match what the handler actually reads", or "an unhandled exception becomes a generic protocol error with no useful message". - The client-integration layer. Finally there is the real client — Claude Code, Claude Desktop, or another host — with its own configuration, its own transport selection, its own authentication flow, and its own idea of when a tool is worth calling. Failures here look like the infamous "it works in the Inspector but not in Claude Code".
These layers map onto a testing strategy. You verify the protocol layer with the MCP Inspector (interactive) and with transport-level checks (
curl, process harnesses). You verify the server-logic layer with unit and integration tests that talk to your handlers through an in-memory transport, with no process and no network. You verify the client-integration layer by debugging from the client side — reading the client's connection status and logs — and by running a client-integration smoke test in CI. The rest of this guide walks each layer in turn, then shows how to wire the whole thing into a regression pipeline.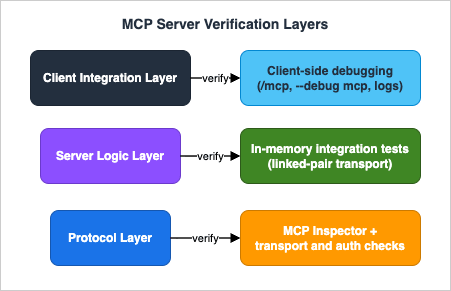
2. Where MCP Servers Fail: A Layered View
Before writing a single test, it pays to enumerate the failure modes by layer. A test you cannot tie to a concrete failure mode is usually a test you do not need.* You can sort the table by clicking on the column name.
| Layer | Typical failures | Primary verification |
|---|---|---|
| Protocol | Failed initialization, version mismatch, a capability advertised but not implemented, a session that dies on reconnect | MCP Inspector and transport probes (Sections 3, 5) |
| Server logic | Schema and implementation drift, wrong result shape, unstructured errors, a description too vague to trigger tool selection | In-memory integration tests (Section 4) |
| Client integration | Environment and working-directory differences, scope or approval issues, truncated output, authentication state | Client-side debugging and CI smoke test (Sections 7, 9) |
2.1 Initialization and Capability Negotiation Failures
Every MCP connection begins with theinitialize request. The client sends a protocolVersion it supports — the spec says it SHOULD send the latest it supports — together with its capabilities. The server MUST respond with the same version if it supports it, or otherwise with another version it supports; if the client cannot accept the server's choice, the client SHOULD disconnect. A version mismatch is surfaced as a JSON-RPC error with code -32602 and the message Unsupported protocol version.Typical failures at this stage:
- The server hard-codes one
protocolVersionstring and rejects everything else, so a client on a newer or older revision cannot connect at all. - The server advertises a capability in the
initializeresult —tools,resources,prompts,logging— but never actually implements the corresponding methods. Clients trust the advertised capabilities; an advertised-but-missing capability is a latent failure that only fires when the client first uses it. - For HTTP transports, the client fails to send the
MCP-Protocol-Versionheader on requests after initialization (more on this in Section 5).
2.2 Tool Schema Failures
The most common server-logic failure is drift between the declared input schema and the handler implementation. The server publishes a JSON Schema for each tool intools/list; the client validates the model's tool call against that schema before dispatching; your handler then reads the arguments. If the schema says a field is optional but the handler dereferences it unconditionally, or the schema names a field userId but the handler reads user_id, the tool will fail at runtime in a way that no schema-level check catches. Schema drift is the single biggest argument for the integration tests in Section 4, which exercise the real handler against the real declared schema.A subtler variant: the schema is valid and the handler matches it, but the description is poor, so the model never selects the tool. This is not a protocol failure at all — it is a discoverability failure — but it presents identically ("my tool isn't called") and is worth ruling out early. The Inspector (Section 3) lets you see exactly what schema and description the client receives.
2.3 Runtime and Error-Reporting Failures
When a tool handler raises, what does the client see? A well-behaved server converts the failure into a structured tool result with an error indication rather than letting it collapse into a generic transport error. The difference matters for debugging: a structured error tells the model (and you) what went wrong; a generic-32603 Internal error tells nobody anything. Tests at the server-logic layer should assert not only the happy path but also that a failing tool returns a useful, structured error.2.4 Transport Failures
Transport failures are insidious because they often appear only under conditions your interactive testing never reproduces: a dropped connection mid-stream, a session that is supposed to resume but does not, a server that writes a stray log line to stdout and corrupts the stdio framing. Section 5 is devoted to these, because they are the failures most likely to pass every unit test and still break in production.2.5 Authorization Failures
For HTTP-based servers that require authorization, an entire class of failures lives in the OAuth 2.1 handshake: a missing or malformedWWW-Authenticate header on the 401, Protected Resource Metadata that points at the wrong authorization server, tokens that are accepted even though their audience does not match the server. Section 6 treats authorization as a testable surface with concrete observations to assert, while delegating the implementation details to the Lambda guide.3. Interactive Debugging with the MCP Inspector
The MCP Inspector is the official, open-source, transport-agnostic tool for exercising a server by hand. It lives in themodelcontextprotocol/inspector repository and runs without installation through npx. It is the right first stop when you have a server and you want to see — directly, with your own eyes — what it advertises and how it responds.Delegation note. The MCP Server on AWS Lambda Complete Guide already contains a hands-on walkthrough of running the Inspector against a Python server in its "Local Testing — mcp dev and the Inspector" section, including the
mcp dev workflow and connecting the Inspector to a locally running ASGI app. This section deliberately stays client- and runtime-independent: it explains what the Inspector is and what to verify with it, so you can apply it to any server regardless of language or hosting. For the Lambda-flavored, copy-along version, follow that section instead of repeating its steps here.3.1 Launching the Inspector
The Inspector takes a server launch command and runs it for you. For a stdio server you pass the command and its arguments directly:npx @modelcontextprotocol/inspector node build/index.jsnpx @modelcontextprotocol/inspector uvx mcp-server-git --repository ~/code/myrepo3.2 What to Verify in the UI
Once connected, the Inspector exposes the server through a small set of panes. The valuable habit is to treat each pane as a checklist against the failure modes from Section 2:- Server connection pane. Choose the transport (stdio, SSE, or Streamable HTTP), set command-line arguments, and inject environment variables. This is where you reproduce the exact launch environment the real client uses — which, as Section 7 explains, is frequently the difference between "works in the Inspector" and "works in Claude Code". You can also export the working configuration as a single server entry or as a complete servers file, which is handy for transcribing a known-good setup into a client configuration.
- Tools tab. List the tools, read each one's input schema and description, and call it with custom inputs. This is where you confirm the schema the client actually receives and rule out the schema-drift and discoverability failures from Section 2.2. If a tool "isn't being called" by a model, the first question is whether its description, as shown here, actually tells a model when to use it.
- Resources tab. List resources, inspect their metadata and content, and — where the server supports it — exercise subscription/update notifications.
- Prompts tab. List prompt templates, inspect their arguments, and render them with sample values to see the generated messages.
- Notifications pane. This pane surfaces the log messages and notifications the server emits. It is your window into the server's own structured logging (Section 8) during an interactive session.
3.3 Authentication in the Inspector
For remote servers behind an authorization layer, the Inspector lets you attach credentials to the outgoing connection — most directly by supplying a bearer token or custom HTTP headers (for example with a--header flag) so that requests carry an Authorization header. This is enough to test a server that expects a valid access token: you mint a token out of band and hand it to the Inspector. The exact extent of any built-in interactive authorization-code flow in the current Inspector UI is something to confirm against the official documentation before relying on it; in this guide we describe only what is firmly supported — token and header injection — and treat the end-to-end discovery handshake as something to verify with the transport- and authorization-level checks in Sections 5 and 6.3.4 The Inspector CLI for Scripts and CI
The Inspector also has a non-interactive CLI mode, which is what makes it useful beyond manual exploration. In CLI mode it runs a single method against your server and prints the result, which means you can call it from a shell script or a CI job:# List the tools a server exposes, non-interactively
npx @modelcontextprotocol/inspector --cli node build/index.js --method tools/list# Call a specific tool with arguments
npx @modelcontextprotocol/inspector --cli node build/index.js \
--method tools/call --tool-name add --tool-arg a=2 --tool-arg b=3tools/list, tools/call, resources/list, and prompts/list. The CLI mode is the bridge between interactive debugging and the automated regression suite in Section 9: the very same tools/list call you eyeball in the UI becomes a snapshot you diff in CI.4. Unit and Integration Tests for Server Logic
Interactive testing finds problems; automated testing keeps them found. The most important automated test for an MCP server is one that connects a real client to your real server in memory — no subprocess, no socket — and exercises the protocol end to end against your actual handlers. This catches schema drift, capability mismatches, and error-shape regressions in milliseconds, and it runs anywhere.Both official SDKs ship an in-memory transport for exactly this purpose. This is the cleanest available testing surface, and it is worth understanding why: an in-memory transport pairs a client and a server in the same process by wiring their read/write streams directly together, so the test exercises the full request/response/notification machinery — initialization, capability negotiation, schema validation, serialization — without any of the flakiness of spawning a process or binding a port.
4.1 TypeScript: InMemoryTransport.createLinkedPair()
The TypeScript SDK exposesInMemoryTransport, whose static createLinkedPair() returns a connected pair of transports — one for the client, one for the server. You connect a Client to one end and your server to the other, then drive the client as a test would drive any client.import { Client } from "@modelcontextprotocol/sdk/client/index.js";
import { McpServer } from "@modelcontextprotocol/sdk/server/mcp.js";
import { InMemoryTransport } from "@modelcontextprotocol/sdk/inMemory.js";
import { z } from "zod";
import { describe, it, expect } from "vitest";
function buildServer(): McpServer {
const server = new McpServer({ name: "calc", version: "1.0.0" });
server.registerTool(
"add",
{
description: "Add two integers and return the sum.",
inputSchema: { a: z.number(), b: z.number() },
},
async ({ a, b }) => ({
content: [{ type: "text", text: String(a + b) }],
}),
);
return server;
}
describe("calc server", () => {
it("lists the add tool with the declared schema", async () => {
const [clientTransport, serverTransport] =
InMemoryTransport.createLinkedPair();
const server = buildServer();
const client = new Client({ name: "test", version: "1.0.0" });
await Promise.all([
server.connect(serverTransport),
client.connect(clientTransport),
]);
const { tools } = await client.listTools();
expect(tools.map((t) => t.name)).toContain("add");
const result = await client.callTool({
name: "add",
arguments: { a: 2, b: 3 },
});
expect(result.content[0].text).toBe("5");
await client.close();
});
});InMemoryTransport (and the high-level server class) differs between the established single-package line and the newer split packages, where the transport is re-exported from the client and server packages for in-process testing. Pin the SDK version your tests target and match the import path to it; do not copy an import string across a major version boundary without checking.4.2 Python: the in-memory test Client
The Python SDK provides an in-memory testing path: you construct aClient around your server object, and the SDK wires them together over an in-memory transport with no subprocess. This is the intended way to test a server without spawning a process. The exact symbol names below track the SDK's newer (2.x) line; on the current stable release (pip install mcp) the high-level server is FastMCP imported from mcp.server.fastmcp and the in-memory client is wired through ClientSession over a linked stream pair. Confirm the symbols against your pinned version's examples (see the version note that follows).import pytest
# These symbols target the SDK's newer (2.x) line. On the current stable release
# (pip install mcp), use: from mcp.server.fastmcp import FastMCP (see version note below)
from mcp import Client
from mcp.server import MCPServer # high-level server
app = MCPServer("calc")
@app.tool()
def add(a: int, b: int) -> int:
"""Add two integers and return the sum."""
return a + b
@pytest.mark.asyncio
async def test_add_tool_is_listed_and_callable():
async with Client(app) as client:
tools = await client.list_tools()
assert "add" in [t.name for t in tools.tools]
result = await client.call_tool("add", {"a": 2, "b": 3})
assert result.content[0].text == "5"FastMCP (imported from mcp.server.fastmcp), and the current source tree introduces MCPServer (imported from mcp.server) as its successor. They are the same high-level server, not two products. Pin your SDK version and use whichever name that version ships — from mcp.server.fastmcp import FastMCP on the established line, from mcp.server import MCPServer on newer revisions. The mcp.Client in-memory testing entry point shown above is part of that same newer line; on the current stable release you instead wire the test through ClientSession over a linked stream pair — check the examples for the version you install.A note on a stale helper. Older Python examples — including some elsewhere in this site's MCP cluster — reach for a
create_connected_server_and_client_session(...) helper to wire a client to a low-level Server instance in tests. That helper is not part of the current public SDK surface; the supported in-memory testing path is the high-level client shown above (or ClientSession over a linked stream pair on the current stable line). If you are maintaining an older test suite that imports it, treat that as a migration target rather than a pattern to copy into new code.4.3 What to Assert
An in-memory test is most valuable when it asserts the things that actually drift:- The tool/resource/prompt inventory. Assert the exact set of names from
tools/list. This single assertion catches accidental additions and removals — and, as Section 9 shows, becomes a snapshot you can diff over time. - The declared schema. Assert that each tool's input schema contains the fields your handler reads, with the right required/optional markers. This is the antidote to schema drift.
- The happy path and the error path. Call each tool with valid arguments and assert the result shape; then call it with arguments that should fail and assert that you get a structured error result rather than an exception that escaped as a generic protocol error.
- Capability honesty. If your server advertises the
resourcesorpromptscapability, assert thatresources/listorprompts/listactually returns — an advertised-but-unimplemented capability is a real bug.
These tests are fast, deterministic, and free of transport flakiness, which makes them the backbone of the CI regression suite in Section 9.
5. Testing Transports: stdio and Streamable HTTP
The current spec defines two standard transports: stdio and Streamable HTTP. (Streamable HTTP replaces the older HTTP+SSE transport from the2024-11-05 revision; if you are testing against a server that still speaks the old dual-endpoint flavor, you are testing a deprecated transport and should plan to migrate.) The in-memory tests of Section 4 deliberately bypass the transport, which is exactly why you need a separate set of checks that exercise the transport itself.5.1 Testing stdio
For stdio, the server reads newline-delimited JSON-RPC messages fromstdin and writes them to stdout. Two rules dominate testing:- Messages are newline-delimited and must not contain embedded newlines. A message that is accidentally pretty-printed across multiple lines breaks framing.
- The server MUST NOT write anything to
stdoutthat is not a valid MCP message. This is the single most common stdio failure: a strayprint(), a library that logs to stdout, a debugging line left in — any of these corrupts the JSON-RPC stream and the client disconnects with a confusing parse error. Logging belongs onstderr, which the spec reserves for exactly this purpose (and which the client treats as diagnostic, not as an error signal).
The cleanest transport test is to connect a real client over stdio and assert it can complete the handshake and list tools — this proves both that the framing is correct and that nothing is polluting stdout. Beyond that, two targeted checks are worth automating:
- A stdout-purity check. Launch the server, send a single
initializerequest, and assert that every line the server writes to stdout parses as JSON. Any non-JSON line is a contamination bug. - An environment check. stdio servers launched by a client inherit only a limited, platform-dependent subset of environment variables, and the working directory may be undefined. Tests should launch the server the way the client does — with an explicit
envand absolute paths — so that "works when I run it in my shell" does not mask "fails when the client launches it" (see Section 10).
# Stdout-purity smoke check: every stdout line must be valid JSON.
# (Illustrative — a real harness would send a full initialize handshake.)
printf '%s\n' '{"jsonrpc":"2.0","id":1,"method":"initialize","params":{"protocolVersion":"2025-11-25","capabilities":{},"clientInfo":{"name":"probe","version":"0"}}}' \
  | node build/index.js \
  | while IFS= read -r line; do
      printf '%s' "$line" | python3 -c 'import sys,json; json.loads(sys.stdin.read())' \
        || { echo "NON-JSON ON STDOUT: $line" >&2; exit 1; }
    done
5.2 Testing Streamable HTTP
Streamable HTTP is richer and has more to verify. The server exposes a single MCP endpoint (for examplehttps://example.com/mcp) that supports both POST and GET. The testable mechanics:- Protocol-version header. After initialization, the client MUST include an
MCP-Protocol-Versionheader on every subsequent request, set to the negotiated version (for exampleMCP-Protocol-Version: 2025-11-25). If the server receives a request with an invalid or unsupported value, it MUST respond400 Bad Request. And if a request arrives with no such header, the server SHOULD assume2025-03-26for backward compatibility — a subtle default that is easy to get wrong and worth an explicit test. - Session management. A server MAY assign a session by returning an
MCP-Session-Idheader on the response that carries theinitializeresult. The ID must consist of visible ASCII characters only. Once assigned, the client MUST echo it in theMCP-Session-Idheader on every later request. A server that requires a session SHOULD respond400 Bad Requestto non-initialization requests that omit the header, and MUST respond404 Not Foundto requests carrying a session ID it has terminated — on a404, a client MUST start a fresh session with a newinitialize. These three status-code behaviors (400 for missing, 404 for terminated, fresh init after 404) are precisely the kind of thing an automated test should pin. - Content negotiation and streaming. On
POST, the client MUST send anAcceptheader listing bothapplication/jsonandtext/event-stream. For a request, the server MUST answer with either a single JSON object (Content-Type: application/json) or an SSE stream (Content-Type: text/event-stream) — and the client must handle both. For responses and notifications the client merely accepts, the server MUST return202 Acceptedwith no body. A server-initiated stream is opened by the client issuing aGETwithAccept: text/event-stream; a server that does not offer one returns405 Method Not Allowed. - Resumability. Servers MAY attach an
idto SSE events; if they do, the ID must be globally unique within the session. To resume after a dropped stream, the client issues aGETwith aLast-Event-IDheader, and the server MAY replay the messages that would have followed — but only on the stream that disconnected. Testing resumability means dropping a stream deliberately and asserting that a reconnect withLast-Event-IDdoes not lose or duplicate messages.
A few
curl probes make these behaviors concrete in a test:ENDPOINT="https://example.com/mcp"
# 1. Initialize and capture the assigned session id from the response headers.
SID=$(curl -s -D - -o /dev/null -X POST "$ENDPOINT" \
-H "Content-Type: application/json" \
-H "Accept: application/json, text/event-stream" \
-H "MCP-Protocol-Version: 2025-11-25" \
-d '{"jsonrpc":"2.0","id":1,"method":"initialize","params":{"protocolVersion":"2025-11-25","capabilities":{},"clientInfo":{"name":"probe","version":"0"}}}' \
| awk -F': ' 'tolower($1)=="mcp-session-id"{print $2}' | tr -d '\r')
# 2. A non-initialize request that omits the session id should be rejected (HTTP 400).
curl -s -o /dev/null -w "no-session -> %{http_code}\n" -X POST "$ENDPOINT" \
-H "Content-Type: application/json" \
-H "Accept: application/json, text/event-stream" \
-H "MCP-Protocol-Version: 2025-11-25" \
-d '{"jsonrpc":"2.0","id":2,"method":"tools/list"}'
# 3. The same request WITH the session id should succeed.
curl -s -o /dev/null -w "with-session -> %{http_code}\n" -X POST "$ENDPOINT" \
-H "Content-Type: application/json" \
-H "Accept: application/json, text/event-stream" \
-H "MCP-Protocol-Version: 2025-11-25" \
-H "MCP-Session-Id: ${SID}" \
-d '{"jsonrpc":"2.0","id":3,"method":"tools/list"}'
# 4. An explicit session teardown is a DELETE to the same endpoint.
curl -s -o /dev/null -w "delete -> %{http_code}\n" -X DELETE "$ENDPOINT" \
-H "MCP-Protocol-Version: 2025-11-25" \
-H "MCP-Session-Id: ${SID}"6. Testing Authorization Flows
Authorization in MCP applies to HTTP-based transports; stdio servers are expected to take credentials from their environment rather than run an OAuth flow, so for stdio the "authorization test" is really the environment test from Section 5.1. For HTTP servers that do require authorization, the current spec builds on OAuth 2.1 and assigns the MCP server the role of an OAuth resource server. The full implementation — discovery documents, token validation, the authorization-server relationship — is covered in the authorization section of the MCP Server on AWS Lambda Complete Guide, which also includes a step-by-stepcurl smoke test of the discovery chain in its "Smoke-Testing the OAuth Wiring" section. This section stays focused on what to assert.The high-value authorization checks, each tied to a spec requirement:
- The challenge. An unauthenticated request MUST receive a
401 UnauthorizedwhoseWWW-Authenticateheader points at the server's Protected Resource Metadata via aresource_metadataparameter. Assert that the401arrives and that the header is present and well-formed — a missing or malformed challenge breaks client discovery entirely. - Protected Resource Metadata (RFC 9728). Fetch the metadata document the challenge points to and assert it includes an
authorization_serversfield naming at least one authorization server. This is the document clients use to find where to get a token. - Authorization Server Metadata. Assert the named authorization server publishes metadata via OAuth 2.0 Authorization Server Metadata (RFC 8414) or OpenID Connect Discovery — the current revision accepts either, where earlier revisions accepted only the former.
- Resource indicators and audience binding (RFC 8707). This is the security-critical one. Clients MUST include a
resourceparameter identifying the target MCP server in both authorization and token requests, and the server MUST validate that an incoming access token was issued for it as the audience. The test that matters: present a token whose audience is some other resource and assert the server rejects it with401. A server that accepts a foreign-audience token is vulnerable to token passthrough, which the spec explicitly forbids. - The status-code contract. Assert
401for a missing or invalid token,403(with aWWW-Authenticatecarryingerror="insufficient_scope") for a valid token without sufficient scope, and400for a malformed request.
Two further checks round out an authorization suite. First, token expiry: present an expired access token and assert the server rejects it with
401 rather than honoring it. Lifetime is enforced at the resource server, and a server that ignores a token's expiry is as exposed as one that ignores its audience. Second, the negative path for the resource itself: assert that the protected endpoint is genuinely unreachable without a token — not merely that a valid token is accepted when present — so that a misconfiguration which leaves the endpoint open is caught rather than masked by a test client that always sends a token.You do not need a full identity provider to write most of these tests. The challenge, the metadata documents, and the status-code contract can all be probed with
curl against a running server, and the audience-binding check needs only two tokens with different audiences. Keep these probes in your integration suite so an authorization regression — a relaxed audience check, a dropped WWW-Authenticate header — is caught the moment it lands.7. Debugging from the Client Side
When a server passes every interactive and automated test and still misbehaves inside a real client, the problem has moved to the client-integration layer. Two clients dominate today — Claude Code and Claude Desktop — and both expose enough diagnostics to localize the fault quickly.7.1 Claude Code
Claude Code manages MCP servers through a small set ofclaude mcp subcommands and one in-session panel:claude mcp listshows every configured server and a status indicator;claude mcp get <name>shows the details of one server, including whether a project-scoped server is still pending your approval.- The
/mcppanel, run inside a Claude Code session, is the fastest health check: it shows each configured server, its connection status, the number of tools it exposes, whether you have approved it for the current project, and — for remote servers — its authentication state. A server that connects but shows zero tools, or one stuck on "pending approval", is diagnosed here in seconds. claude --debug mcpstarts Claude Code with MCP debug output enabled, surfacing the server's stderr — which is exactly where a stdio server should be sending its diagnostics (Section 5.1). The--debugflag accepts category filters, soclaude --debug "api,mcp"narrows the noise to the subsystems you care about, and--debug-file <path>writes the log to a file. (Note: the current documented way to see MCP debug output is--debug mcp; if you have older notes referencing a standalone--mcp-debugflag, the category-filtered--debugform is what the current documentation describes.)claude --safe-modestarts with all customizations — including MCP servers — disabled, which is the cleanest way to confirm whether an MCP server is the cause of a broader problem: if the symptom disappears in safe mode, an extension is responsible.
A few environment variables shape MCP behavior and are worth knowing when a server "works but times out":
MCP_TIMEOUT governs how long Claude Code waits for a server to start, MCP_TOOL_TIMEOUT governs individual tool execution, and MAX_MCP_OUTPUT_TOKENS caps how much output a tool may return before it is truncated. A tool that returns a large payload can be silently capped; raising the limit (or trimming the output) resolves a class of "the tool result looks cut off" reports.MCP servers in Claude Code are configured at one of three scopes —
local (this project, just you), project (this project, shared via a checked-in .mcp.json), and user (all your projects) — with local taking precedence over project over user. A surprising amount of "the server isn't loading" turns out to be a scope or precedence issue, which claude mcp list makes visible.7.2 Claude Desktop
Claude Desktop is configured through a JSON file and writes its MCP diagnostics to disk:- Configuration lives at
~/Library/Application Support/Claude/claude_desktop_config.jsonon macOS and%APPDATA%\Claude\claude_desktop_config.jsonon Windows (reachable from Settings → Developer → Edit Config). - Logs live at
~/Library/Logs/Claude/on macOS and%APPDATA%\Claude\logson Windows. Themcp.logfile records connection-level events and failures; a per-servermcp-server-<name>.logcaptures that server's stderr. Tailing them while you reproduce a problem is the most direct way to see what the client sees:
# Follow all MCP logs live on macOS while reproducing the issue.
tail -n 20 -F ~/Library/Logs/Claude/mcp*.log- Chrome DevTools can be enabled for deeper inspection by creating a
developer_settings.jsonwith{"allowDevTools": true}alongside the config file; the Console panel surfaces client-side errors and the Network panel shows message payloads and connection timing.
One operational detail catches everyone at least once: after changing server code, you must fully quit and reopen the client (closing the window is not enough), and after changing configuration you must restart the client. A server that "didn't pick up my change" is very often a server that simply was not restarted.
7.3 A Companion Tool for Configuration
A large share of client-side failures are configuration failures — a malformedclaude_desktop_config.json, a relative path where an absolute one is required, a missing env entry. A configuration builder-and-validator that catches these before they reach the client removes an entire category of round-trips. This site's companion MCP Server Config Builder and Validator tool is designed for exactly that.8. Logging and Tracing
Good observability turns a silent failure into a legible one. MCP gives you real, spec-defined logging primitives; it does not (yet) give you distributed tracing, and being precise about that distinction keeps you from building on something that is not actually there.8.1 Structured Logging Is in the Spec
The MCP specification defines alogging capability. A server that declares it can emit log messages to the client as notifications/message notifications, each carrying a severity level drawn from the standard syslog levels (RFC 5424: debug through emergency), an optional logger name, and arbitrary structured data. The client can also call logging/setLevel to ask the server to filter below a chosen severity. This is the right channel for server diagnostics on every transport, and it is especially important for Streamable HTTP, where (unlike stdio) the client does not capture the server's stderr. Design your servers to emit structured log notifications at meaningful boundaries — request received, tool dispatched, error caught — and you get diagnostics that show up directly in the Inspector's notifications pane (Section 3.2) and in client logs.8.2 Correlation: Request IDs and Session IDs
For correlating the messages of a single logical operation, MCP gives you two identifiers out of the box:- JSON-RPC request IDs. Every request carries an
idthat is unique within the session (and must not be null). Logging the request ID alongside each message lets you stitch a request to its response and to any notifications emitted while handling it. - The
Mcp-Session-Id. On Streamable HTTP, the session header identifies the connection across many requests, so logging it lets you reconstruct the arc of a whole session. (Stdio has no session ID — its "session" is the lifetime of the process.)
There is also a reserved
_meta field in the base protocol for attaching metadata to interactions, with certain key prefixes reserved for MCP itself. It is a convenient place to thread your own correlation data, within the reservation rules.8.3 Tracing: What Exists and What Does Not
Here precision matters. Distributed tracing — OpenTelemetry spans, W3C trace-context propagation viatraceparent/tracestate/baggage — is not part of the ratified MCP specification. The logging utility makes no mention of it, and the base protocol's _meta field does not reserve trace-context keys. Trace-context propagation in MCP is an open proposal and discussion in the protocol's GitHub community, not an adopted feature, and there has been active debate among observability practitioners about whether the protocol should carry trace context at all.What does exist is ecosystem tooling: third-party packages (for example, community OpenTelemetry instrumentation for MCP) can wrap an SDK to emit spans, and a host application can of course run its own tracing around the MCP calls it makes. Claude Code itself ships OpenTelemetry telemetry — but that is product-usage telemetry for the Claude Code application, a separate concern from tracing an MCP server's request handling. The honest, current-state guidance is therefore: rely on the spec's structured logging plus request-ID and session-ID correlation for portable observability; treat trace-context propagation as an ecosystem add-on you opt into deliberately, not as a protocol feature you can assume a client will honor. Anything stronger than that is, today, a claim the specification does not support — and writing tests against a feature the spec does not define is a good way to encode folklore into your suite.
9. Regression Testing in CI
Everything so far is a technique; this section assembles those techniques into a pipeline that runs on every change and keeps regressions out. The general mechanics of running tools unattended — headless invocation, authenticating in CI, parsing structured output, the official GitHub Action — are covered in the Claude Code CI/CD and Headless Automation guide; this section focuses on the MCP-specific checks that belong in that pipeline.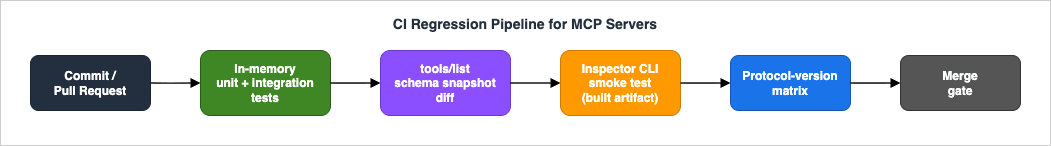
- In-memory unit and integration tests. The Section 4 tests run first because they are the fastest and catch the most. They assert the tool/resource/prompt inventory, the declared schemas, and the happy- and error-path behavior of every handler.
- A tool-list (and schema) snapshot. Capture
tools/list— the names and their input schemas — as a committed snapshot, and fail the build when it changes unexpectedly. This is the regression check that matters most for downstream consumers: a renamed tool, a removed parameter, or a tightened schema is a breaking change for every agent that depends on the server, and a snapshot diff turns that into a reviewable, intentional decision rather than a surprise in production. You can produce the snapshot from an in-memory client (Section 4) or from the Inspector CLI (Section 3.4). - A client-integration smoke test. Use the Inspector's CLI mode to connect to the built server over its real transport and run
tools/list(and a representativetools/call), proving that the packaged artifact actually starts and speaks the protocol — not just that the source-level handlers work. This is the check that catches "works in tests, fails when launched", including stdout-contamination and environment problems. - A protocol-version matrix. Because the spec is versioned by date and clients in the wild span several revisions, run the smoke test against each
protocolVersionyou intend to support and assert the server negotiates correctly (and rejects unsupported versions with the right error). This is what keeps a server that "works with my client today" from quietly breaking the moment a client on a different revision connects.
A compact GitHub Actions sketch ties them together:
name: mcp-server-regression
on: [push, pull_request]

jobs:
  test:
    runs-on: ubuntu-latest
    steps:
      - uses: actions/checkout@v4
      - uses: actions/setup-node@v4
        with:
          node-version: "22"

      - name: Install and build
        run: |
          npm ci
          npm run build

      # 1. In-memory unit/integration tests (fast, fail-first).
      - name: Unit and integration tests
        run: npm test

      # 2. Tool-list snapshot: fail if the public tool surface changed.
      - name: Snapshot tools/list
        run: |
          npx @modelcontextprotocol/inspector --cli node build/index.js \
            --method tools/list > tools.actual.json
          diff -u tools.snapshot.json tools.actual.json

      # 3. Client-integration smoke test against the built artifact.
      - name: Smoke test a tool call
        run: |
          npx @modelcontextprotocol/inspector --cli node build/index.js \
--method tools/call --tool-name add --tool-arg a=2 --tool-arg b=3MCP-Protocol-Version makes the server fall back to its default revision.10. Common Pitfalls
A short catalog of the failures that recur most often, each with the symptom, the cause, and the fix.- Logging to stdout on a stdio server. Symptom: the client disconnects immediately or reports a JSON parse error; the Inspector shows a broken connection. Cause: a
print(), a library default, or a leftover debug line writes non-protocol bytes to stdout and corrupts the framing. Fix: send all logging to stderr (or use the spec'snotifications/messagelogging), and add the stdout-purity check from Section 5.1 to CI. - Schema and implementation drift. Symptom: a tool fails at call time even though
tools/listlooks fine. Cause: the declared input schema and the handler have diverged — a renamed field, an optional marked required, a type mismatch. Fix: the in-memory integration tests of Section 4 that exercise the handler against the declared schema; assert both the happy and error paths. - "Works in the Inspector, fails in Claude Code." Symptom: the server is perfect interactively but does nothing in the real client. Cause: almost always an environment difference — the client launches the server with a different working directory, a narrower set of environment variables, or a relative path that does not resolve. Fix: reproduce the client's exact launch environment (the Inspector's connection pane lets you set args and env to match), use absolute paths everywhere, and put required variables in the configuration's
envblock rather than relying on inheritance. - No protocol-version pinning. Symptom: the server works with one client and breaks with another, or breaks after a client update. Cause: the server assumes a single
protocolVersionand does not negotiate, or an HTTP client omits theMCP-Protocol-Versionheader and the server applies the wrong default. Fix: negotiate versions properly ininitialize, send the header on every HTTP request after init, and run the protocol-version matrix from Section 9. - A server that starts too slowly. Symptom: the client intermittently reports that the server failed to connect. Cause: the server performs expensive work — downloading data, opening upstream connections — before it finishes
initialize, and exceeds the client's startup timeout. Fix: defer expensive work until after initialization completes, raise the client's startup timeout where it is configurable (MCP_TIMEOUTin Claude Code), and add a test that asserts the handshake completes within a bounded time. - Advertising a capability you do not implement. Symptom: the client calls a method and gets a generic error. Cause: the
initializeresult advertisesresources,prompts, orlogging, but the corresponding handler is missing or a stub. Fix: a capability-honesty assertion in the integration suite (Section 4.3). - Treating "passes the Inspector" as "is safe." Symptom: a server is functionally correct but introduces a security risk. Cause: functional testing answers "does it work", not "is it safe to trust" — a malicious or compromised server can be perfectly well-behaved on the wire. Fix: a correctness suite does not replace a security review; for the latter, see the MCP Tool Poisoning Defense Guide.
11. Frequently Asked Questions
Why does my server work in the MCP Inspector but not in Claude Code?Nearly always an environment difference. The Inspector, by default, runs the server in your shell's environment; Claude Code launches it with a different (often narrower) set of inherited variables, a working directory that may be undefined, and only the
env entries you explicitly provide. Reproduce the client's launch conditions in the Inspector's connection pane — set the same args and env, use absolute paths — and the discrepancy usually appears. Then confirm with claude --debug mcp to read the server's stderr as the client sees it.How do I test an MCP server without a real client?
Use the SDK's in-memory transport (Section 4): the TypeScript SDK's
InMemoryTransport.createLinkedPair() or the Python SDK's in-memory testing Client. These connect a real client to your real server in the same process, with no subprocess and no network, so you exercise the full protocol — initialization, schema validation, tool calls — in a fast, deterministic unit test. It is the single highest-value test to write first.Should I test against the MCP spec version my client uses, or the latest?
Both, via a version matrix (Section 9). The spec is versioned by date —
2025-11-25 is current — and real clients span several revisions. Pin the versions you intend to support, assert your server negotiates each one correctly in initialize, and assert it rejects unsupported versions with the proper error rather than failing in some undefined way.My tool's output looks truncated in Claude Code. Is the server broken?
Possibly not. Claude Code caps tool output via
MAX_MCP_OUTPUT_TOKENS (Section 7.1); a large result can be truncated before you ever see a server-side problem. Check whether the output exceeds the cap, then either raise the limit or have the tool return a more compact result.Can I trace a request across my MCP server with OpenTelemetry?
Not through anything the specification guarantees. Distributed tracing and W3C trace-context propagation are not part of the ratified MCP spec (Section 8.3) — they are an open proposal plus third-party ecosystem tooling. What the spec does give you is structured logging (
notifications/message, severity levels, logging/setLevel) plus per-request JSON-RPC IDs and the Mcp-Session-Id for correlation. Build your portable observability on those; treat OTel tracing as an opt-in add-on, not an assumed protocol feature.Do I need to test authorization for a stdio server?
No OAuth flow, no. The authorization spec applies to HTTP transports; stdio servers take credentials from their environment. For stdio, the equivalent check is the environment test from Section 5.1 — make sure the secrets the server needs are actually present in the launch environment the client provides.
Is a clean test suite the same as a safe server?
No. Correctness testing — the subject of this guide — verifies that a server does what it claims. It says nothing about whether the server, or a tool it exposes, is safe to trust. Those are different questions with different tools; for the safety side, see the MCP Tool Poisoning Defense Guide.
12. Summary
MCP servers fail silently, and the antidote is to test each of the three layers with the cheapest tool that can see that layer's failures. Use the MCP Inspector — interactively and through its CLI mode — to exercise the protocol and confirm what your server actually advertises. Write in-memory integration tests with the SDKs' linked transports to pin your tool inventory, your declared schemas, and your error shapes in fast, deterministic unit tests. Verify the transports directly: keep stdout pure on stdio, and pin the session and protocol-version contract on Streamable HTTP. Treat authorization as a testable surface with concrete status-code and audience-binding assertions. When a server passes everything and still misbehaves, debug from the client side with/mcp, claude --debug mcp, and the client log files. Build portable observability on the spec's structured logging and request/session correlation, and resist the temptation to assume tracing features the spec does not define. Finally, assemble these into a CI regression pipeline whose tool-list snapshot and protocol-version matrix turn breaking changes into reviewable decisions.For the surrounding cluster: build with the MCP Server Implementation Reference, deploy a remote, authenticated server with the MCP Server on AWS Lambda Complete Guide, find a server to test against in the MCP Server Ecosystem Reference 2026, harden what you adopt with the MCP Tool Poisoning Defense Guide, and run any of it unattended with the Claude Code CI/CD and Headless Automation guide.
13. References
- Model Context Protocol — Specification: Versioning (current revision)
- Model Context Protocol — Specification 2025-11-25: Lifecycle
- Model Context Protocol — Specification 2025-11-25: Transports
- Model Context Protocol — Specification 2025-11-25: Authorization
- Model Context Protocol — Specification 2025-11-25: Logging utility
- Model Context Protocol — MCP Inspector documentation
- modelcontextprotocol/inspector — GitHub repository (UI and CLI modes)
- Model Context Protocol — Connect to local MCP servers (config and log locations)
- modelcontextprotocol/typescript-sdk — GitHub repository (InMemoryTransport)
- modelcontextprotocol/python-sdk — GitHub repository and Testing documentation
- Claude Code — MCP documentation (claude mcp, /mcp, scopes)
- Claude Code — CLI reference (--debug, --safe-mode)
- MCP Server Implementation Reference - hidekazu-konishi.com
- MCP Server on AWS Lambda Complete Guide - hidekazu-konishi.com
- MCP Server Ecosystem Reference 2026 - hidekazu-konishi.com
- MCP Tool Poisoning Defense Guide - hidekazu-konishi.com
- Claude Code CI/CD and Headless Automation - hidekazu-konishi.com
References:
Tech Blog with curated related content
Written by Hidekazu Konishi