AWS Lambda Cold Start Mitigation Guide - Provisioned Concurrency, SnapStart, and Code-Level Techniques
First Published:
Last Updated:
This article is a single, decision-grade reference for designing Lambda functions whose cold-start behavior is acceptable in production. It walks through the execution-environment lifecycle, the per-language realities of Python, Node.js, Java, Go, and .NET, the three primary mitigation tools (Provisioned Concurrency, SnapStart, and code-level techniques), how to measure cold starts in production, a decision flowchart for picking the right mitigation, and the anti-patterns that quietly defeat every other optimization.
Cost numbers are intentionally out of scope. The current AWS Lambda pricing page is the authoritative reference for that — anything I write here would be stale within a few months. Instead, I focus on design judgment: when each mitigation is the right call, what it costs you in operational complexity, and how to measure that you actually got faster.
For background on Lambda's evolution and the platform features referenced throughout this guide, see AWS History and Timeline of Amazon Lambda. For one realistic workload that lives or dies by cold-start behavior, see MCP Server on AWS Lambda Complete Guide, where every agent tool call hits the cold-start path on a fresh tenant.
1. Introduction — Why Cold Starts Still Matter in 2026
By 2026, AWS Lambda has had nearly a decade to mature its execution model. SnapStart is generally available for Java, Python, and .NET. Provisioned Concurrency has had Application Auto Scaling for years. Container image lazy loading is on by default. Yet cold-start questions still dominate Lambda design reviews, for three reasons.First, the workloads have shifted. The original Lambda use case — asynchronous image processing, S3 event handlers, scheduled jobs — was largely tolerant of one-time startup penalties. The modern fleet is dominated by synchronous APIs (Lambda behind API Gateway, AppSync, ALB) and AI agent tool calls, both of which sit directly in front of users with strict tail-latency budgets.
Second, AI agents are unusually punishing. A single user prompt may issue 5–50 tool calls in sequence, often hitting different functions. Even a 200 ms cold start, multiplied across a tool-call chain, becomes a multi-second user-visible delay. Tenant isolation patterns (one Lambda function per tenant or per role) make warm-environment reuse less effective than it was in the days of one big shared API.
Third, the mitigation tools each carry trade-offs that are easy to get wrong. Provisioned Concurrency that is set too low does not help; set too high it is expensive. SnapStart can now be combined with Provisioned Concurrency on the same function version (announced at re:Invent 2023), but it still silently breaks code that assumes ephemeral state (random seeds, network connections, cached credentials) is freshly generated on every cold start. Container image bloat can wipe out a SnapStart speedup before it begins. Naive code-level "optimization" — removing all top-level imports — sometimes makes things worse.
This guide is structured around the order in which I work through cold-start questions during a design review:
- Understand the lifecycle so you can talk about which phase is slow.
- Know your language's characteristic shape — Python is not Java, Java is not Go.
- Choose between Provisioned Concurrency and SnapStart based on workload patterns and runtime.
- Apply code-level mitigations regardless of whether you also use 3.
- Pick the right deployment package format.
- Measure before, during, and after. Without measurement, you have a feeling, not a fix.
2. The Cold Start Lifecycle (Init Phase Anatomy)
Every Lambda invocation runs inside an execution environment — a Firecracker microVM with your code and runtime loaded. The environment passes through three phases.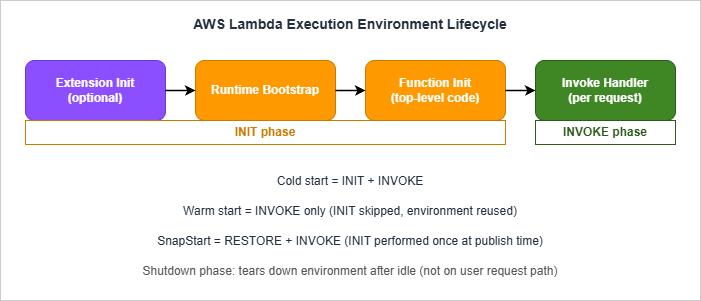
- Download package. The deployment package is fetched — a ZIP archive from Lambda's internal store, or layers from Lambda's internal layer store, or an OCI container image from ECR. For container images this step uses lazy loading: only the layers and files needed to start the runtime are pulled eagerly; the rest stream in on first read.
- Start runtime. The runtime binary boots. For Python this is the CPython interpreter; for Node.js, the V8 engine; for Java, the JVM; for .NET, the CoreCLR; for Go, the compiled binary's loader. Custom runtimes (
provided.al2023) skip this step because the runtime is your code. - Run extensions. Each Lambda extension registered for the function runs its init phase before user code. AWS Lambda Powertools, X-Ray, third-party APM agents like Datadog or New Relic — all add Init time here.
- Run function init. Module-level code in your handler file executes. Top-level imports, global variable assignments, framework startup, AWS SDK client construction, configuration loads — anything outside the handler function body.
Init Duration on the first REPORT. Extensions consume part of the 10-second budget; if they are slow, your function-init code has correspondingly less time before extended init kicks in.Invoke phase. The Lambda Runtime API calls your handler with the event payload. This is the only phase that runs on every invocation, warm or cold. The Invoke phase has the function timeout you configured (max 15 minutes).
Shutdown phase. After a period of inactivity, the environment is torn down. Lambda does not document an exact timeout, and observed lifetimes vary widely with traffic and concurrency — from a few minutes for low-volume functions to several hours for steady traffic. Extensions get a Shutdown event with a 2-second budget; the handler does not.
2.1 Cold Start vs Warm Start
A cold start invocation pays Init + Invoke. A warm start pays only Invoke. The same execution environment can serve thousands of warm invocations before the platform tears it down.For SnapStart-enabled functions the model changes: Init runs once at version publish time; subsequent fresh-environment invocations pay Restore + Invoke, where Restore is the time to load the snapshot and run any post-restore hooks. This restructuring is what makes SnapStart fundamentally different from Provisioned Concurrency (see §5).
2.2 Reading Cold-Start Time From Logs
Lambda emits structured records for cold starts. The two record types you care about areREPORT (every invocation) and INIT_REPORT (SnapStart only).For a standard cold start, the
REPORT line includes an Init Duration field:REPORT RequestId: 1a2b3c4d-... Duration: 250.06 ms Billed Duration: 251 ms
Memory Size: 1024 MB Max Memory Used: 350 MB Init Duration: 410.77 msREPORT instead carries Restore Duration and Billed Restore Duration. The Init phase is reported separately as an INIT_REPORT record at version creation.Total cold-start latency the user sees:
| Mode | User-visible cold-start time |
|---|---|
| On-demand | Init Duration + Duration |
| Provisioned Concurrency (warm hit) | Duration only (no Init seen during invocation; Init was paid in advance) |
| SnapStart | Restore Duration + Duration |
There is also a special case called a suppressed init: if a Provisioned Concurrency environment fails to initialize quickly enough to serve a request, Lambda may run the Init phase inline at invocation time. The
REPORT line then shows a Duration that silently includes the Init time without a separate field. CloudWatch Logs Insights queries that filter on @initDuration > 0 will miss these — be careful when computing cold-start counts. See §8 for the queries that do catch them.2.3 INIT Phase Billing — Read the Current Pricing Page
Lambda's billing treatment of the Init phase has shifted over time. Historically, on-demand functions using managed runtimes with ZIP packaging did not bill for Init time, while SnapStart and Provisioned Concurrency did. AWS has periodically tightened this, and the current behavior — including whetherBilled Duration in the REPORT line includes Init time for your specific runtime and packaging combination — should be confirmed against the Lambda pricing page and the billing documentation before you size capacity. The practical implication is the same in either world: accurate cold-start measurement is now a cost-management exercise as well as a latency one, because Init time can show up on the invoice as well as on your latency dashboard.3. Language Profiles — Python, Node.js, Java, Go, and .NET
The cold-start shape varies by an order of magnitude across runtimes. Below are the typical patterns; absolute numbers depend on package size, layer count, dependencies, and memory configuration. Treat the ranges as rough orientation, not benchmarks — your number will be different. Always measure your own workload.3.1 Python
Typical cold-start range: 100–600 ms for a small function (boto3 imported); 800 ms–2 s for a function with heavyweight imports (pandas, numpy, AWS Lambda Powertools with all utilities, large ORM frameworks).Init phase breakdown: CPython interpreter startup is fast (~30–50 ms); the bulk of Init time is your top-level
import statements and any module-level work they trigger. import boto3 alone takes ~150–250 ms on Lambda's arm64 because it scans for service definitions.Knobs that move the needle:
- Lazy import modules used only by some handlers (see §6).
- Pre-resolve boto3 clients once at module level, reuse on warm invocations.
- Strip unused service shapes with tools like
botocore-stubsis overkill in most cases; the simpler answer is to import onlyboto3.client("s3")rather than the high-levelboto3.resource("s3")which is slower. - AWS Lambda Powertools is fine but its top-level utilities (especially the parser with Pydantic v2) compile schemas at import — opt-in only the utilities you need.
3.2 Node.js
Typical cold-start range: 50–250 ms for a small function; 400 ms–1 s for one with a large bundle (Apollo, NestJS, AWS SDK v3 with many clients).Init phase breakdown: V8 boot is fast (~20–40 ms). The dominant cost is
require() resolution for CommonJS or module loading for ESM. Each node_modules directory hop and each transitive dependency adds disk I/O. AWS SDK v3's modular design means importing only @aws-sdk/client-s3 instead of aws-sdk (v2) saves a significant chunk.Knobs that move the needle:
- Bundle and tree-shake with esbuild (the Lambda SAM CLI does this automatically when
BuildMethod: esbuildis set on a Node.js function). A bundled function with dead-code elimination is dramatically smaller thannode_modulesshipped raw. - Use AWS SDK v3 modular packages, not v2. The runtime ships v3 only since
nodejs20.x. - Enable top-level await in
nodejs20.x+ when you genuinely need it; otherwise it adds startup work for no benefit.
3.3 Java
Typical cold-start range without SnapStart: 1.2–6 s, with the high end driven by Spring Boot or other reflection-heavy frameworks. (Quarkus is comparatively lightweight on the JVM and dramatically faster as a GraalVM native image, so do not lump it in with Spring.) Even a bareHello World handler on Java 21 cold-starts in ~1 s because the JVM has to bootstrap, JIT-compile the class loader, and load the basic library classes.Init phase breakdown: JVM startup, classpath scanning, framework initialization (Spring's bean container can easily take seconds to construct), JIT warmup. Tiered compilation helps after warmup but does not help the cold start itself.
Knobs that move the needle:
- SnapStart is the single biggest lever (see §5). It moves Init to publish time and reduces user-visible cold start to roughly Restore + Invoke (typically a few hundred milliseconds, vs. multi-second Init).
- Tiered compilation tuning: setting
JAVA_TOOL_OPTIONS=-XX:+TieredCompilation -XX:TieredStopAtLevel=1skips the slower C2 compiler for short-running functions, trading peak warm performance for faster startup. Valid trade-off for Java functions that handle bursty traffic. - CRaC runtime hooks — implement the
org.crac.Resourceinterface and register viaCore.getGlobalContext().register(this)to runbeforeCheckpoint/afterRestorelogic that re-establishes connections, refreshes secrets, and reseeds randomness after restore (see §5.3 for the code pattern). - GraalVM native image is an alternative that compiles Java to a native binary and dramatically cuts cold start, at the cost of a much heavier build process and reduced reflection support. Practical for a small subset of functions but not a default recommendation.
3.4 Go
Typical cold-start range: 80–250 ms.Init phase breakdown: Go produces a single static binary; there is no interpreter or VM. The Init phase is dominated by the binary's startup and any work in your
init() functions (module-level code in Go). Cold starts are intrinsically fast and consistent.Knobs that move the needle:
- Use
provided.al2023with the Go binary as the bootstrap (the dedicatedgo1.xruntime was deprecated; Go on Lambda has been a custom runtime since 2024). - Compile with
arm64— Graviton runs Go workloads exceptionally well. - Avoid heavy
init()functions. Frameworks like Gin or Echo do little at module load; ORM frameworks like Ent or generated gRPC stubs can do a lot. - Connection pooling matters more for Go than for many other runtimes because Go's
net/httpclient anddatabase/sqlpool are lightweight enough to set up at module level cheaply.
3.5 .NET
Typical cold-start range without SnapStart: 800 ms–3 s. .NET 8+ on Lambda is much faster than .NET Core 3.1 was, but the CoreCLR still needs to bootstrap and run JIT.Init phase breakdown: CoreCLR boot, assembly loading, JIT compilation, and any
Startup class equivalents (the Lambda Annotations framework does some reflection at init time).Knobs that move the needle:
- SnapStart (see §5). Available for .NET 8+. The Lambda Annotations framework needs version 1.6.0+ for full SnapStart compatibility.
- Native AOT (
dotnet publish -c Release -r linux-arm64 --self-contained true /p:PublishAot=true) compiles ahead-of-time to a native binary, eliminating JIT and dramatically reducing cold start. Trade-off: no reflection-based serialization (use source generators), more complex build, larger artifact. - Trim unused assemblies with
<PublishTrimmed>true</PublishTrimmed>. Adds build complexity but can halve the cold start for large applications.
3.6 Comparison Summary
| Runtime | Typical cold start (no mitigation) | SnapStart support | Native AOT support | Best mitigation if cold-sensitive |
|---|---|---|---|---|
| Python 3.12+ | 100–600 ms (small); 800 ms–2 s (heavy imports) | Yes (3.12+) | No | Code-level + SnapStart |
| Node.js 20+ | 50–250 ms (small); 400 ms–1 s (large bundles) | No | No | Code-level + bundling + Provisioned Concurrency |
| Java 11+ | 1.2–6 s | Yes (11+) | Via GraalVM (manual) | SnapStart |
Go (provided.al2023) | 80–250 ms | No | N/A (already AOT) | Code-level only is usually enough |
| .NET 8+ | 800 ms–3 s | Yes (.NET 8+) | Yes (Native AOT) | SnapStart or Native AOT |
The single biggest decision is Java/.NET vs everything else. If you are on the JVM or CoreCLR, SnapStart or Native AOT will dominate every other lever. If you are on Python, Node.js, or Go, code-level techniques and (for the most latency-sensitive synchronous APIs) Provisioned Concurrency are your tools. Note also that Node.js does not currently support SnapStart — verify the latest at the Lambda SnapStart documentation before committing.
4. Provisioned Concurrency — When and How
Provisioned Concurrency (PC) is the brute-force answer to cold starts. You tell Lambda to keep N execution environments fully initialized at all times; invocations route to those environments and pay only the Invoke phase. The cold start moves from runtime to provisioning time.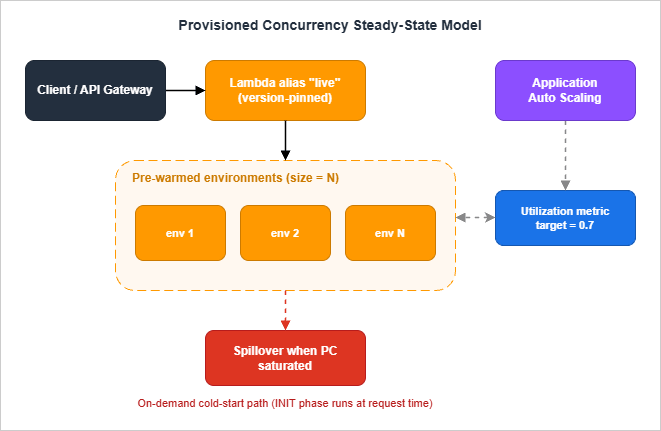
4.1 Where PC Sits in the Architecture
PC is configured on a function version or alias, never on$LATEST. A typical setup:- Create a published version of the function:
aws lambda publish-version --function-name api. - Create or update an alias pointing at that version:
aws lambda update-alias --function-name api --name live --function-version 7. - Configure PC on the alias:
aws lambda put-provisioned-concurrency-config --function-name api --qualifier live --provisioned-concurrent-executions 10.
arn:aws:lambda:region:acct:function:api:live), not the bare function ARN. If they invoke $LATEST, the PC setting on the alias is irrelevant and you pay for warm environments that get no traffic.4.2 Application Auto Scaling Integration
Static PC is rarely the right answer because traffic is rarely flat. The recommended pattern is:- Register the alias as a scalable target with Application Auto Scaling.
- Apply a target tracking policy on the
LambdaProvisionedConcurrencyUtilizationpredefined metric (target value typically 0.6–0.8). - Optionally add scheduled scaling for known peak windows (business hours, batch windows).
aws application-autoscaling register-scalable-target \
    --service-namespace lambda \
    --resource-id function:api:live \
    --scalable-dimension lambda:function:ProvisionedConcurrency \
    --min-capacity 2 \
    --max-capacity 100

aws application-autoscaling put-scaling-policy \
    --service-namespace lambda \
    --resource-id function:api:live \
    --scalable-dimension lambda:function:ProvisionedConcurrency \
    --policy-name pc-utilization-target \
    --policy-type TargetTrackingScaling \
    --target-tracking-scaling-policy-configuration '{
      "TargetValue": 0.7,
      "PredefinedMetricSpecification": {
        "PredefinedMetricType": "LambdaProvisionedConcurrencyUtilization"
      }
}'AWSServiceRoleForApplicationAutoScaling_LambdaConcurrency is created in your account on first registration; it has permission to call Lambda's PC APIs.4.3 Sizing PC
The sizing question is "how many warm environments do I need at this moment?". Approximate by:- p95 concurrent executions during a representative load window, observed from the
ConcurrentExecutionsmetric. Round up. - Add headroom for the time the auto scaler takes to react. PC scale-up takes a minimum of around 2–3 minutes to provision new environments — if your traffic doubles in 30 seconds, the auto scaler will be late and you will see cold starts during the gap.
- Keep target utilization conservative (0.6–0.7) so that small bursts do not spill into on-demand; raise it (0.8) when traffic is smoother.
4.4 Detecting PC Init Type at Runtime
The environment variableAWS_LAMBDA_INITIALIZATION_TYPE reveals which path the environment took. Values:on-demand— standard cold start pathprovisioned-concurrency— PC pre-warmed environmentsnap-start— SnapStart restored environment (set on functions where SnapStart is enabled, see §5)
afterRestore hook already handled).import os
IS_PROVISIONED = os.environ.get("AWS_LAMBDA_INITIALIZATION_TYPE") == "provisioned-concurrency"
# Heavy warmup that's fine to run pre-traffic but unsafe on the user request path
if IS_PROVISIONED:
_prewarm_caches()4.5 Spillover Behavior
When the number of concurrent invocations exceeds the configured PC value, spill traffic falls back to standard on-demand initialization. PC does not "queue" requests for warm environments; it is a floor, not a ceiling. Combined with Reserved Concurrency (which is a ceiling), you can shape behavior precisely:- PC only: Floor of warm environments, on-demand spillover above.
- PC + Reserved Concurrency: Floor of warm + ceiling that throttles excess traffic.
- PC > Reserved Concurrency: Configuration error — Lambda rejects this on update.
4.6 When to Use PC
Choose PC when:- The runtime is Node.js (no SnapStart available) or you cannot meet SnapStart's runtime constraints.
- You have a predictable concurrent baseline that justifies always-warm environments.
- You need deterministic invocation latency (PC has no Restore phase variation; SnapStart can have small Restore-time variance).
- You are integrating with services that are sensitive to even occasional second-or-more responses (synchronous Step Functions tasks with tight timeouts, AppSync resolvers feeding interactive UIs).
- Traffic is highly bursty and unpredictable. PC sized for the average will not catch the bursts; PC sized for the bursts is over-provisioned the rest of the time.
- The function is asynchronous (queue-driven, S3 events, scheduled). Cold starts in async paths are usually invisible to users.
- The runtime supports SnapStart and the function meets SnapStart's constraints (see §5).
4.7 PC Sizing in Practice — Three Real Patterns
The Application Auto Scaling integration in §4.2 covers the mechanics; what experienced teams actually configure looks like one of three patterns, depending on traffic shape:Pattern A: Steady traffic with a 9-to-5 envelope. An internal API serving employees in one timezone has predictable working-hour load. Configure PC at the daytime concurrency floor (say, 20), and scale to a small reserve (5) outside business hours via a scheduled scaling action. The cost difference between "always 20" and "20 during work hours, 5 overnight" is meaningful for a small team and the user-visible latency is identical, because no real user is hitting the function at 03:00. The trick is the scheduled scaling has to fire before the morning traffic, not when it arrives; set it for half an hour earlier than the first user logs in.
Pattern B: Spiky traffic with a known peak. A campaign-launch endpoint goes from zero to peak in seconds and back to zero an hour later. Configure target-tracking auto scaling on a target utilisation of 70%, with a minimum of 0 (or a small floor like 2 if there is constant baseline) and a maximum that comfortably exceeds the expected peak. Target tracking will pre-warm the function as utilisation climbs, before users see the cold-start tail. The maximum exists to bound surprise costs: a runaway loop in a downstream service can otherwise consume PC capacity unchecked.
Pattern C: Tail latency matters more than average. A synchronous customer API has an average concurrency of 5 but a 99th percentile around 25. PC sized for the average leaves 75th-percentile users hitting cold starts; PC sized for the 99th percentile is over-provisioned 95% of the time. The right answer is usually PC for the 75th percentile, on-demand for the long tail, with the function's own code path designed so the long-tail cold-start cost is measured and acceptable. This is where SnapStart, when available, is the better tool: it shrinks the cold-start cost of the spillover instances enough that the gap between provisioned and on-demand stops being painful.
The pattern you cannot make work with PC alone is "infrequent, high-priority requests with strict latency SLOs and no predictability." For that combination the architectural answer is a different topology — a small always-warm container, an EventBridge scheduled keep-alive, or a non-Lambda runtime — rather than fighting PC into a shape it was not designed for.
5. Lambda SnapStart — Mechanics and Caveats
SnapStart takes a Firecracker microVM memory and disk snapshot of your function's initialized execution environment, encrypts it, and caches it. On invocation against a fresh environment, Lambda restores from that snapshot rather than running Init from scratch.5.1 What Runs When
| Phase | Standard cold start | SnapStart cold start |
|---|---|---|
| Init (download, runtime, extensions, function init) | At invocation time | At version publish time, once |
| Snapshot creation | N/A | After Init, before publish completes |
beforeCheckpoint runtime hooks | N/A | After Init, before snapshot is taken |
| Restore (load snapshot, page in, run hooks) | N/A | At invocation time, before handler |
afterRestore runtime hooks | N/A | After restore, before handler |
| Handler invocation | After Init | After Restore |
Init runs once per published version, on AWS infrastructure, before the version becomes invokable. The Init time is reported as
INIT_REPORT. Subsequent fresh-environment invocations pay only Restore + Invoke. Restore is typically in the low hundreds of milliseconds vs. multi-second Init.5.2 Runtime and Region Coverage
As of late 2025, SnapStart is supported on:- Java 11 and later (managed runtimes only; no
provided.alXJava) - Python 3.12 and later
- .NET 8 and later (with
Amazon.Lambda.Annotations1.6.0+ for the annotations framework)
- Node.js, Ruby, OS-only
provided.alXruntimes, and container images (ZIP packaging only). - Amazon EFS, ephemeral storage greater than 512 MB.
$LATEST: SnapStart works only on published versions and aliases pointing at versions.
5.3 The "Uniqueness" Problem
The seductive promise of SnapStart — no code changes needed — is true for the simple case and untrue for several common cases. Anything that is supposed to be unique per execution environment but was generated during Init will be shared across every restored environment, because they all spring from the same snapshot.Concretely:
SecureRandomseeds captured at module load- UUIDs generated at module load (process IDs, instance identifiers)
- Cached credentials, JWT signing keys, anything resolved from Secrets Manager or Parameter Store at startup
- Database / HTTP connections that are alive in the snapshot — TCP state on the remote does not match
- Caches keyed by "request ID 0" or similar startup-time placeholders
import org.crac.Core;
import org.crac.Resource;

public class App implements Resource {
  public App() {
    Core.getGlobalContext().register(this);
  }

  @Override
  public void beforeCheckpoint(org.crac.Context<? extends Resource> ctx) {
    // Tear down anything stateful before the snapshot is taken
    closePooledConnections();
  }

  @Override
  public void afterRestore(org.crac.Context<? extends Resource> ctx) {
    // Re-establish anything that's per-environment unique
    rebuildPooledConnections();
    refreshSecureRandomSeed();
  }
}beforeSnapshot and afterRestore callbacks; .NET uses ISnapStartLifecycle through the Lambda Annotations framework.A practical heuristic: anything that takes secrets, randomness, or networked connections must be deferred to after-restore (or to the first handler invocation). Anything that loads static configuration (parsing a JSON config file, compiling regex patterns, building an in-memory lookup table) is fine to leave in Init.
5.4 Optimizing What Runs Inside Init
Because Init runs at publish time on AWS infrastructure, the more you push into Init, the more you save at restore time. The "advanced priming" pattern from the AWS Compute Blog deliberately invokes downstream services during Init so that the JIT (for Java) and the connection pool (for any runtime) are warm in the snapshot. Combined withafterRestore hooks that just refresh rather than rebuild, this can drop a 1.5 s Restore + Invoke down to a few hundred milliseconds.The trade-off is build/publish time (Init now actually runs at every deploy) and snapshot size (more pages of memory dirty at snapshot time means slower paging-in at restore). Measure before and after.
5.5 SnapStart vs Provisioned Concurrency
| Dimension | SnapStart | Provisioned Concurrency |
|---|---|---|
| Runtime support | Java 11+, Python 3.12+, .NET 8+ | All runtimes |
| Container images | Not supported | Supported |
| Predictable latency | High; Restore time is bounded | Highest; warm environment, no Init |
| Cost shape | Per snapshot caching + per restoration (Python/.NET); no extra cost (Java) | Per provisioned-environment-hour |
| Burst handling | Naturally elastic (each cold environment restores from snapshot) | Bounded by configured PC count; spills to on-demand |
| Code changes for correctness | Yes (uniqueness hooks) | None |
| Combinable with the other? | Yes — since re:Invent 2023, SnapStart and Provisioned Concurrency can both be applied to the same published function version. PC keeps a pre-restored environment hot; SnapStart accelerates the spillover beyond the PC pool. | |
The clean rule of thumb: on Java/Python/.NET ZIP packages with predictable workloads, SnapStart usually wins. On Node.js, Go, container images, or workloads with hard latency tails that cannot tolerate Restore variance, Provisioned Concurrency is the answer. For workloads that need both a deterministically warm core (PC) and fast restoration of spillover capacity (SnapStart), the two are now stackable on the same published version — the spike beyond the PC pool restores from snapshot rather than running full Init. Section 9 expands this into a flowchart.
6. Code-Level Mitigation Patterns
These are the techniques that pay for themselves regardless of whether you also use SnapStart or Provisioned Concurrency. They cost nothing to operate, are language-agnostic in spirit, and frequently account for the difference between a 600 ms cold start and a 1.5 s one.6.1 Lazy Imports / Lazy Initialization
The single largest lever for Python and Node.js cold starts. Move imports and expensive initializations from module top level into the function or class that actually uses them. The first invocation of that handler pays the cost; every other handler runs faster.Python — anti-pattern:
import boto3
import pandas as pd       # 400 ms+ at import
from PIL import Image     # 100 ms+ at import

s3 = boto3.client("s3")

def lambda_handler(event, context):
    if event.get("op") == "small_op":
        return {"ok": True}        # never touches pandas or PIL
    df = pd.read_parquet(...)
    img = Image.open(...)
return process(df, img)import boto3
s3 = boto3.client("s3")
_pd = None
_PIL = None
def _pandas():
global _pd
if _pd is None:
import pandas as pd # only when needed
_pd = pd
return _pd
def _pil_image():
global _PIL
if _PIL is None:
from PIL import Image
_PIL = Image
return _PIL
def lambda_handler(event, context):
if event.get("op") == "small_op":
return {"ok": True}
df = _pandas().read_parquet(...)
img = _pil_image().open(...)
return process(df, img)const AWS = require("aws-sdk"); // v2: full SDK loaded
const stripe = require("stripe")(process.env.SK); // network module loaded
const sharp = require("sharp"); // native binding loaded
exports.handler = async (event) => {
if (event.op === "ping") return { ok: true };
// ...
};import { S3Client } from "@aws-sdk/client-s3";
const s3 = new S3Client({});
let _stripe;
let _sharp;
const stripe = async () => {
if (!_stripe) {
const { default: Stripe } = await import("stripe");
_stripe = new Stripe(process.env.SK);
}
return _stripe;
};
const sharp = async () => {
if (!_sharp) {
const mod = await import("sharp");
_sharp = mod.default;
}
return _sharp;
};
export const handler = async (event) => {
if (event.op === "ping") return { ok: true };
// ...
};6.2 Top-Level Initialization for Reusable Resources
The mirror image of lazy import: things that are always used should live at module scope so warm invocations skip them.import boto3
import json
# At module scope: created once per environment, reused on warm invocations
S3 = boto3.client("s3")
DDB = boto3.resource("dynamodb").Table("Orders")
CONFIG = json.loads(open("config.json").read()) # static config
def lambda_handler(event, context):
# No client construction here
return DDB.get_item(Key={"id": event["id"]})6.3 Connection Pooling and SDK Reuse
Database connections, HTTP clients, and AWS SDK clients should be created once per execution environment and reused across warm invocations. This is an Init-phase optimization that also dramatically cuts per-invocation latency once warm.import boto3
from botocore.config import Config
# One client, one connection pool, reused across all warm invocations
S3 = boto3.client(
"s3",
config=Config(
retries={"max_attempts": 3, "mode": "adaptive"},
connect_timeout=2,
read_timeout=10,
max_pool_connections=10, # tune to your concurrency
),
)pymysql or psycopg2 connections at module scope work but have failure modes when the database fails over (the connection is dead but the client thinks it is alive). RDS Proxy handles failover transparently.6.4 Bundling and Tree Shaking (Node.js, Python)
For Node.js, bundle with esbuild before deploy. The Lambda SAM CLI does this automatically withBuildMethod: esbuild:Resources:
ApiFunction:
Type: AWS::Serverless::Function
Metadata:
BuildMethod: esbuild
BuildProperties:
Minify: true
Target: "es2022"
Sourcemap: false
EntryPoints:
- app.ts
External:
- "@aws-sdk/*" # provided by the runtime
Properties:
Runtime: nodejs20.x
Handler: app.handler
CodeUri: src/For Python, bundling is less common but dependency pruning is critical. Tools like
pip-compile plus a requirements-prod.txt that excludes dev dependencies, combined with python -m pip install --target package/ --no-cache-dir --no-deps -r requirements-prod.txt, prevent test frameworks and linting tools from being shipped to production.6.5 JVM-Specific Knobs (Java)
Without SnapStart, Java cold starts are dominated by JVM startup and JIT warmup. Two environment variables move the needle:Environment:
Variables:
JAVA_TOOL_OPTIONS: "-XX:+TieredCompilation -XX:TieredStopAtLevel=1 -Xshare:auto"-XX:+TieredCompilation -XX:TieredStopAtLevel=1skips the slower C2 compiler. Warm performance is somewhat lower than full tiered, but for short-running functions the trade-off favors fast startup.-Xshare:autoenables Class Data Sharing if the runtime ships aclasses.jsaarchive (the AWS-managed Java runtimes do).
TieredStopAtLevel=1 in that case and consider invoking your hot path during Init as a priming step.6.6 .NET Native AOT
For .NET 8+ functions where you control the build pipeline and can accept the constraints, Native AOT eliminates JIT and most cold-start cost. The function compiles to a self-contained native binary; cold start drops from ~1–3 s to ~150–300 ms.<PropertyGroup>
<OutputType>Exe</OutputType>
<TargetFramework>net8.0</TargetFramework>
<PublishAot>true</PublishAot>
<InvariantGlobalization>true</InvariantGlobalization>
</PropertyGroup>dotnet publish -c Release -r linux-arm64 --self-contained true and deploy as a provided.al2023 runtime function with the binary as the bootstrap.Constraints:
- No reflection-based serialization; use
System.Text.Jsonsource generators. - Limited dynamic code generation; libraries that emit IL at runtime do not work.
- Build complexity goes up; cross-compilation between macOS/Windows dev and Linux ARM64 deploy needs care.
7. Container Image vs Zip Package
Lambda supports two deployment package formats: ZIP (up to 250 MB unzipped) and OCI container images (up to 10 GB). The cold-start trade-offs differ.7.1 ZIP Package
The classic format. Lambda extracts the ZIP into the execution environment's/var/task and runs from there. Cold-start time scales roughly linearly with package size up to a point — a 5 MB ZIP and a 50 MB ZIP differ by tens of milliseconds in download, but a 200 MB ZIP can add hundreds of milliseconds.Use when: package fits comfortably under 50 MB, dependencies are simple, you want SnapStart (which only supports ZIP).
7.2 Container Image
Uses OCI container images stored in Amazon ECR. Lambda introduced lazy loading in 2023: instead of pulling the entire image before starting, only the layers and files needed to start the runtime are fetched eagerly; the rest stream in on first read.Lazy loading dramatically reduces the cold-start penalty of large images, but it does not eliminate it. The first read of any file not yet pulled blocks. A function that touches 200 MB of code on its hot path will pay 200 MB worth of streaming latency, just spread over the first few invocations rather than concentrated up front.
Use when: package exceeds 250 MB unzipped, you have non-Python/non-Node native dependencies that are awkward to package as Lambda layers, you want consistency between local and production builds via Docker, or you need to deploy ML models or heavy binaries.
Avoid when: you want SnapStart (not supported), you want sub-100 ms cold starts on a small function (ZIP wins by a noticeable margin for tiny packages).
7.3 Choosing Optimized Base Images
For container images, the base image matters. The AWS-providedpublic.ecr.aws/lambda/<runtime> images are tuned for fast startup. Avoid building from generic python:3.12-slim and reimplementing the Lambda Runtime API — the cold-start cost is measurable.FROM public.ecr.aws/lambda/python:3.12-arm64
COPY requirements.txt ./
RUN pip install --no-cache-dir -r requirements.txt -t /var/task
COPY src/ /var/task/
CMD ["app.handler"]provided.al2023 base with a custom runtime adapter and a more aggressive layer split sometimes wins; measure your specific case.7.4 Comparison
| Dimension | ZIP (managed runtime) | Container image |
|---|---|---|
| Max size | 250 MB unzipped | 10 GB |
| Cold-start floor | ~80 ms (Go), ~150 ms (Node, Python) | ~200 ms (lazy load + tiny image) |
| SnapStart support | Yes (Java/Python/.NET) | No |
| Layer support | Yes (5 max) | N/A (use multi-stage Docker) |
| Local development parity | Lower — Lambda layer simulation needed | Higher — same image runs anywhere |
| ECR involvement | None | Required |
8. Measuring Cold Starts — X-Ray, Powertools, CloudWatch Logs Insights
Without measurement, every optimization above is speculation. The good news is that Lambda emits everything you need in CloudWatch Logs and X-Ray; the work is in querying it.8.1 CloudWatch Logs Insights
Detect cold starts and aggregate Init Duration:fields @timestamp, @duration, @initDuration, @memorySize, @maxMemoryUsed
| filter @type = "REPORT" and ispresent(@initDuration)
| stats count() as cold_starts,
avg(@initDuration) as avg_init_ms,
pct(@initDuration, 50) as p50_init_ms,
pct(@initDuration, 95) as p95_init_ms,
pct(@initDuration, 99) as p99_init_ms
by bin(5m)
| sort @timestamp descRestore Duration from the message:fields @timestamp, @message
| filter @type = "REPORT"
| parse @message /Restore Duration: (?<restoreMs>[0-9.]+) ms/
| stats count() as restored,
avg(restoreMs) as avg_restore_ms,
pct(restoreMs, 95) as p95_restore_ms
by bin(5m)fields @type, @initDuration, @duration
| filter @type = "REPORT"
| stats count() as total_invocations,
count(@initDuration) as cold_with_init_field,
sum(@initDuration > 0) as cold_starts
| eval cold_ratio = cold_starts / total_invocations8.2 AWS X-Ray
X-Ray distinguishes the Init subsegment from Invoke subsegments automatically when active tracing is enabled (Tracing: Active in SAM). The Service Map shows Init time as a separate segment on the function node.For SnapStart, X-Ray emits a
Restore subsegment instead of Init. Both are visible in the trace timeline.Enable X-Ray on the function:
Globals:
  Function:
Tracing: ActiveAWSLambdaTracingExecutionRole managed policy (SAM auto-attaches when Tracing: Active).8.3 AWS Lambda Powertools
Powertools'Tracer wraps the X-Ray SDK and adds a cold_start annotation on the first invocation of each environment, making it trivially queryable in X-Ray Analytics.from aws_lambda_powertools import Tracer
tracer = Tracer(service="orders")
@tracer.capture_lambda_handler
def lambda_handler(event, context):
return process(event)annotation.ColdStart = true returns just cold-start traces with full waterfall.For richer per-segment instrumentation:
@tracer.capture_method
def fetch_order(order_id):
    return DDB.get_item(Key={"id": order_id})

@tracer.capture_method
def call_payment_service(order):
    # captured as its own subsegment in X-Ray
return requests.post(PAYMENT_URL, json=order, timeout=2).json()8.4 CloudWatch Embedded Metric Format (EMF) and Lambda Insights
Powertools'Metrics utility emits EMF-formatted log lines that CloudWatch automatically converts into metrics, including custom cold-start counters. For broader OS-level visibility (CPU, memory, network) enable Lambda Insights by attaching the LambdaInsightsExtension layer; Insights publishes per-execution-environment metrics including init_duration.Resources:
ApiFunction:
Properties:
Layers:
# The account ID and version differ per region and per architecture.
# us-east-1 / arm64 example shown; look up the current ARN for your
# region and architecture in the Lambda Insights documentation:
# https://docs.aws.amazon.com/lambda/latest/dg/monitoring-insights.html
- !Sub "arn:aws:lambda:${AWS::Region}:580247275435:layer:LambdaInsightsExtension-Arm64:53"
Policies:
- CloudWatchLambdaInsightsExecutionRolePolicyx86_64 and arm64 architectures. Always resolve the correct ARN from the Lambda Insights documentation at deploy time rather than copying a hard-coded ARN from any blog post.Lambda Insights is the only tool that gives you per-environment memory and CPU during the Init phase itself — useful for debugging "why is my Init suddenly 800 ms" mysteries that turn out to be a layer doing CPU-intensive work at import.
8.5 What to Alarm On
Two metric-math alarms cover most cases:- Cold-start rate > N%:
100 * (cold_starts / total_invocations). A sudden rise from baseline indicates either deploy churn (every deploy invalidates warm environments) or a traffic pattern change exceeding your PC headroom. - p95 Init/Restore Duration > threshold: most useful as a regression detector when you push code that bloats imports.
8.6 A Cold-Start Observability Dashboard
Once you have the metrics from §8.1–8.4, the goal is to turn them into a dashboard that an on-call engineer can glance at during an incident and immediately know whether cold starts are involved. The dashboard I keep on every Lambda-heavy service has six widgets, in this order:- Cold-start rate over the last 24 hours, plotted alongside total invocations. The shape tells you instantly whether a latency complaint is "the function is slow under load" or "the function is being asked to scale faster than it can." A flat 1% rate that climbs to 8% during the incident window is a different problem from a steady 1% the whole time.
- p50, p95, p99 Init Duration over time. The p99 line is the user-facing tail; the gap between p50 and p99 measures how much variance there is in the init path. Wide gaps suggest a non-deterministic dependency: an SDK that probes regional metadata, a slow DNS resolver, an at-import network call that should not be there.
- Cold starts by version (or alias). After a deploy, the new version's init time can differ from the old; charting cold-start count and Init Duration grouped by version surfaces accidental regressions before they become incidents. A deploy that doubles Init Duration is almost always something a reviewer could have caught with this graph in mind.
- PC Spillover counter. The metric
ProvisionedConcurrencySpilloverInvocationstells you how many requests fell through PC and hit on-demand instead. A non-zero number means your sizing is wrong, your auto scaling did not keep up, or you have a sudden traffic spike. Trending this against time-of-day reveals patterns you might otherwise miss. - SnapStart Restore Duration p95. SnapStart's restore path is fast but not free, and a Restore that climbs over 200 ms usually points at something the snapshot is loading on demand — a network call to Secrets Manager, an unfrozen S3 file, a stale handle that needs reopening. Compare against the function's tagging strategy and you usually find the culprit in two clicks.
- A correlated panel of "function p99 latency" against "cold-start rate". This is the single graph that answers the question "is the user-visible slowness driven by cold starts, or by something else?" If the two lines move together, mitigation belongs in this article. If they do not, the bottleneck is downstream and you should look elsewhere.
The dashboard is more useful than any single alarm because incidents rarely fit the alarm thresholds you imagined. A six-widget overview lets the on-call engineer triage in thirty seconds, decide whether the playbook in this article applies, and either start mitigation or hand off to the next layer of the stack with confidence.
9. Decision Flowchart — Choosing the Right Mitigation
Pulling the previous sections together: how do you decide what to do?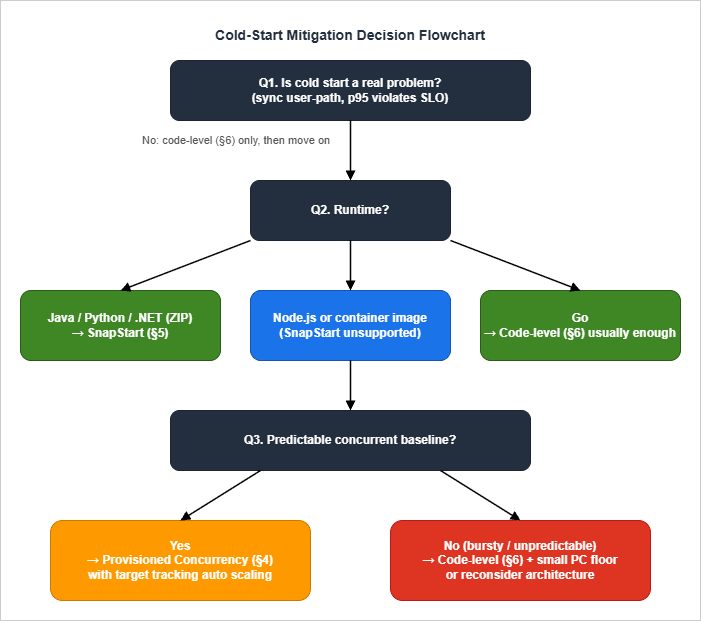
- Confirm the problem is real. Pull p95/p99 Init Duration from CloudWatch Logs Insights and compare against your latency SLO. Cold starts on async paths (SQS consumers, EventBridge handlers, S3 events) almost never warrant the operational cost of mitigation. If p99 cold start is well under your budget, stop here and apply code-level patterns (§6) for hygiene, then move on.
- Apply code-level patterns regardless of whether you also use a platform mitigation. They are cheap and they compound.
- Branch on runtime:
- Java / Python / .NET on ZIP packages: Try SnapStart first. Verify uniqueness assumptions (§5.3), wire up
beforeCheckpoint/afterRestorehooks, deploy, measure. SnapStart wins on operational simplicity (no auto-scaling tuning), elastic burst handling, and cost shape for spiky workloads. - Node.js, Go, container images, runtimes/configurations not supported by SnapStart: Skip to step 4.
- Java / Python / .NET on ZIP packages: Try SnapStart first. Verify uniqueness assumptions (§5.3), wire up
- Branch on traffic shape:
- Predictable concurrent baseline (steady or scheduled peaks): Provisioned Concurrency with Application Auto Scaling target tracking. Set
min-capacityto your overnight baseline; let target tracking float between min and max during the day; add a scheduled scale-up before known business peaks. - Bursty, unpredictable: Code-level patterns only. Optionally a small PC floor (1–2) to keep one environment warm at all times, accepting that bursts will still see some cold starts. Consider architectural changes — if cold start truly cannot be tolerated, the workload may belong on ECS Fargate or App Runner instead.
- Predictable concurrent baseline (steady or scheduled peaks): Provisioned Concurrency with Application Auto Scaling target tracking. Set
- Special case — Go: Code-level patterns are usually sufficient. Most Go cold-start "problems" are actually
init()doing too much. Profile before assuming you need PC. - Special case — extremely tight latency (<100 ms p99 cold-start): Native AOT (.NET) or GraalVM (Java) compete with Go and may beat SnapStart in absolute terms. Build complexity goes up substantially. Worth the investment only when other levers exhausted.
A useful sanity check before committing to any of the platform options: can you describe the workload's peak concurrency and burst shape from production data, not from intuition? Almost every botched PC sizing I have reviewed starts with "we figured we needed about X" rather than a CloudWatch chart. The Insights query in §8.1 answers the question in three minutes; running it before deciding which branch of this flowchart applies is the cheapest correctness improvement available. Similarly, before enabling SnapStart, run a one-week shadow deployment in a non-production alias and compare Init versus Restore durations under realistic traffic; the gap that looks attractive in benchmarks sometimes shrinks when measured against your actual init code, and the gap that looks small in a microbenchmark sometimes grows once your real dependency graph is loaded. Treat the flowchart as a starting hypothesis; let the measurements decide which leaf you actually land on.
10. Anti-Patterns
Independent of all of the above, these are the patterns I see repeatedly defeat otherwise-reasonable cold-start strategies.Provisioned Concurrency over-allocation. Setting PC = peak concurrency makes warm-environment hits 100% but burns money. The right number is well below peak, with auto scaling pulling in extra environments as needed and accepting some cold starts on steep ramps. Target utilization 0.7 is a healthier setpoint than 0.5.
Heavy I/O in Init. Module-level
requests.get(), boto3.client("ssm").get_parameter(...), or psycopg2.connect(...) calls run on every cold start (or on every PC pre-warm, or — most insidiously — on every restore for non-SnapStart functions). Move them behind first-use lazy initialization, or hoist them to the build pipeline (Parameter Store → environment variable injection at deploy time).Layer stacking. Lambda allows up to 5 layers. Each adds Init time (the layer is downloaded and mounted). Three layers each adding 30 ms is 90 ms before your code runs. Consolidate layers; for very large dependencies, prefer container images over layer abuse.
Breaking SnapStart uniqueness silently. The most painful incidents I have seen are intermittent: a function appears to work in load testing but produces duplicate IDs, identical "random" passwords, or stale credentials in production because a Java
java.util.Random or SecureRandom instance was seeded once at Init time and the seed is in the snapshot — every restored environment then produces the same sequence. The same hazard applies in Python and .NET when randomness, UUIDs, or cached secrets are resolved at module load. The CRaC / SnapStart hooks exist for exactly this; use them.Container image bloat. A 4 GB container image with 200 transitive dependencies streams in over many invocations and silently degrades performance for the first user of every fresh environment. Multi-stage builds,
.dockerignore, and a RUN step that prunes test fixtures and language docs typically halve image size with no functional change.Confusing PC and Reserved Concurrency. Reserved Concurrency caps total parallel executions; Provisioned Concurrency pre-warms environments. They compose (PC ≤ Reserved is enforced) but solve different problems. Setting Reserved Concurrency hoping it will reduce cold starts has no effect — that's PC's job.
Disabling X-Ray to "save Init time". The X-Ray SDK adds ~10–30 ms at Init. Disabling it may shave a small amount but loses the visibility you need to debug the next cold-start regression. Keep it on for production functions that face users.
Optimizing the wrong runtime. A team I worked with spent two weeks tuning a Python function's imports before discovering the actual bottleneck was a Lambda layer that bundled an unused 80 MB ML model. Always profile before optimizing.
Treating warm-up pings as a strategy. Scheduled CloudWatch Events that ping a function every 5 minutes "to keep it warm" mostly do not work: Lambda's environment teardown logic is not based on time-since-last-invoke alone, ping invocations create noise in your metrics, and one ping per 5 minutes does not keep more than one environment warm. PC is the supported, efficient version of this idea.
11. Summary
Cold starts on AWS Lambda are not solved by a single setting. They are managed by a combination of:- Knowing where time is spent (Init lifecycle, §2; per-runtime profiles, §3) so the discussion is concrete.
- Code-level patterns (§6) that pay for themselves regardless of platform features — lazy import, top-level reuse for always-used resources, connection pooling, bundling, language-specific JVM and CoreCLR knobs.
- Platform features used in the right place: SnapStart on Java/Python/.NET ZIP packages with predictable workloads (§5); Provisioned Concurrency on Node.js, container images, or where SnapStart's Restore-time variance is unacceptable (§4).
- Continuous measurement through CloudWatch Logs Insights, X-Ray, Powertools, and Lambda Insights (§8) — without it, every change above is a guess.
| Workload shape | Runtime | Recommended primary mitigation |
|---|---|---|
| Synchronous API, predictable load, latency-sensitive | Java / Python / .NET | SnapStart + code-level (§5, §6) |
| Synchronous API, predictable load, latency-sensitive | Node.js | Provisioned Concurrency + code-level (§4, §6) |
| Synchronous API, bursty | Any | Code-level + small PC floor (§6, §4) |
| Asynchronous (queue, S3, EventBridge) | Any | Code-level only (§6) |
| Sub-100 ms p99 hard requirement | .NET / Java | Native AOT / GraalVM (§3.5, §3.3) |
| ML inference, large dependencies | Any | Container image + code-level (§7, §6) |
| Lambda@Edge | Node.js / Python | Code-level only — platform features unsupported |
The decision flow in §9 captures the same idea in branching form. The anti-patterns in §10 are the failure modes that quietly defeat every other lever.
If you are starting a Lambda function today and want to spend the least time worrying about cold starts: pick Python 3.12 or Go on
arm64, ZIP-package it, apply §6 patterns, measure with §8 tools, and add SnapStart (Python) or accept the natural Go cold-start floor. The day you have a real measured violation against a real SLO, return to this guide and pick the targeted mitigation.A final caveat that is hard to overstate: cold-start mitigation is a continuous discipline, not a one-time project. Two forces conspire to make a function that was healthy six months ago slow today. The first is dependency drift: an SDK upgrade adds a new at-import metadata fetch, a logging library introduces a 50 ms initialisation, a tracing layer adds CPU work to the cold path. None of those changes are obvious in a code review, and each adds 20–100 ms to Init Duration. Without the dashboard from §8.6 alarming on regression, the slow creep accumulates until a customer complaint forces an investigation that should have been a deploy gate. The second force is traffic drift: the function that handled 10 invocations per minute when you sized PC now handles 100, the ratio of cold to warm has changed, and the assumptions baked into your auto-scaling configuration no longer fit. Treat both forces explicitly: revisit Init Duration trends every quarter, and revisit PC and SnapStart configuration every time the function's traffic profile shifts by more than 2x.
The compounding effect of doing this consistently is significant. A team that disciplines its cold-start posture for two years ends up with functions that are five times faster to start than the average AWS-blog example, with a clear paper trail showing each improvement was deliberate, measured, and tied to a real-user metric. None of the individual interventions in this article will get you there alone. Practice with all of them, in combination, against the workloads that actually carry your business, will.
For complementary context on the platform itself, see AWS History and Timeline of Amazon Lambda. For one realistic production workload that hits every cold-start consideration in this guide, see MCP Server on AWS Lambda Complete Guide.
12. References
Official AWS documentation- Improving startup performance with Lambda SnapStart
- Monitoring for Lambda SnapStart
- Configuring provisioned concurrency for a function
- Understanding Lambda function scaling
- Understanding the Lambda execution environment lifecycle
- AWS Lambda runtimes
- Lambda quotas
- Application Auto Scaling — services that integrate (Lambda)
- New — Provisioned Concurrency for Lambda Functions
- AWS Lambda SnapStart for Python and .NET functions is now generally available (2024-11)
- AWS Lambda now supports SnapStart for Python and .NET functions (What's New, 2024-11)
- Optimizing cold start performance of AWS Lambda using advanced priming strategies with SnapStart
- Scheduling AWS Lambda Provisioned Concurrency for recurring peak usage
- AWS Lambda standardizes billing for INIT phase (effective 2025-08-01)
- AWS Lambda Powertools (Python) — Tracer utility
- AWS Lambda Powertools (Java) — Tracing
- AWS Lambda Powertools (TypeScript) — Tracer
- AWS Lambda Powertools (.NET)
- aws-samples/aws-lambda-autoscale-provisioned-concurrency-example
- awsdocs/application-auto-scaling-user-guide — Lambda integration page
Related Articles on This Site
- AWS History and Timeline of Amazon Lambda
The platform evolution that brought us each of the cold-start mitigations discussed in this guide. - MCP Server on AWS Lambda Complete Guide
A worked example where every agent tool call sits on the cold-start path; §16 of that guide briefly references SnapStart and Provisioned Concurrency, while this article is the deep dive. - Add CloudFront, WAF, Lambda@Edge, and ACM to a Custom Origin like AWS Amplify Hosting
Lambda@Edge has its own cold-start considerations (no Provisioned Concurrency, no SnapStart, replicated globally) that complement the patterns in this guide. - CloudWatch Logs Insights Query Cookbook
Practical Logs Insights recipes for incident investigation, security audit, performance analysis, and cross-service correlation — including the Lambda cold-start queries used in §8.
References:
Tech Blog with curated related content
Written by Hidekazu Konishi